. 2021 Jul 27;144(4):286-302.
doi: 10.1161/CIRCULATIONAHA.120.052318. Epub 2021 May 25.

Integrated Single-Cell Atlas of Endothelial Cells of the Human Lung

Affiliations

Integrated Single-Cell Atlas of Endothelial Cells of the Human Lung

Jonas C Schupp et al. Circulation. .

Abstract

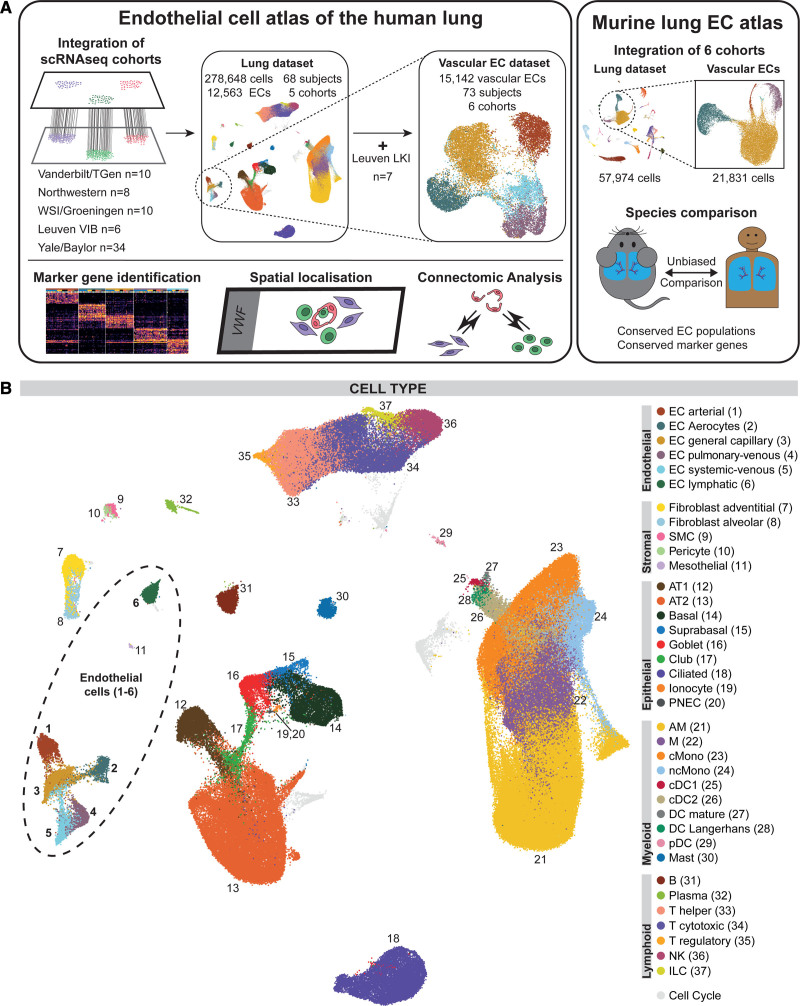
Background: Cellular diversity of the lung endothelium has not been systematically characterized in humans. We provide a reference atlas of human lung endothelial cells (ECs) to facilitate a better understanding of the phenotypic diversity and composition of cells comprising the lung endothelium.

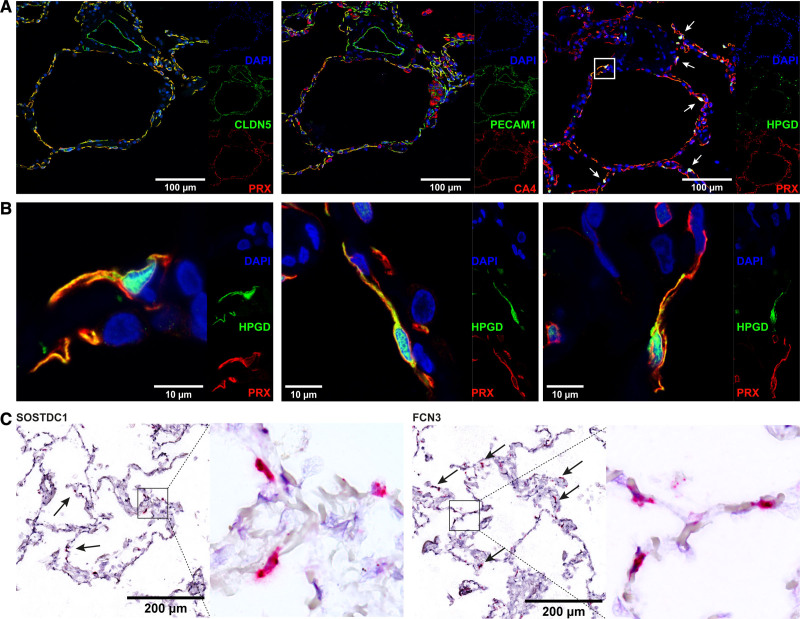
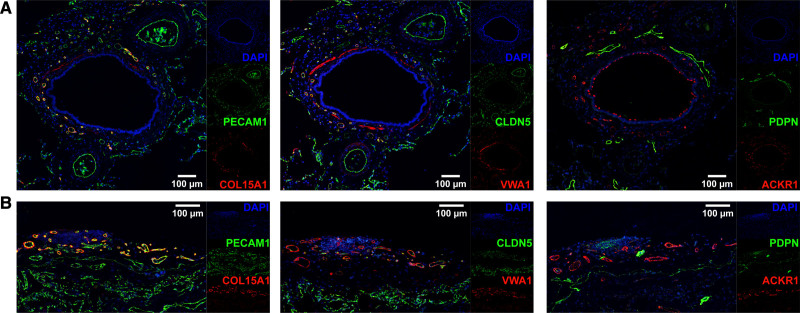
Methods: We reprocessed human control single-cell RNA sequencing (scRNAseq) data from 6 datasets. EC populations were characterized through iterative clustering with subsequent differential expression analysis. Marker genes were validated by fluorescent microscopy and in situ hybridization. scRNAseq of primary lung ECs cultured in vitro was performed. The signaling network between different lung cell types was studied. For cross-species analysis or disease relevance, we applied the same methods to scRNAseq data obtained from mouse lungs or from human lungs with pulmonary hypertension.

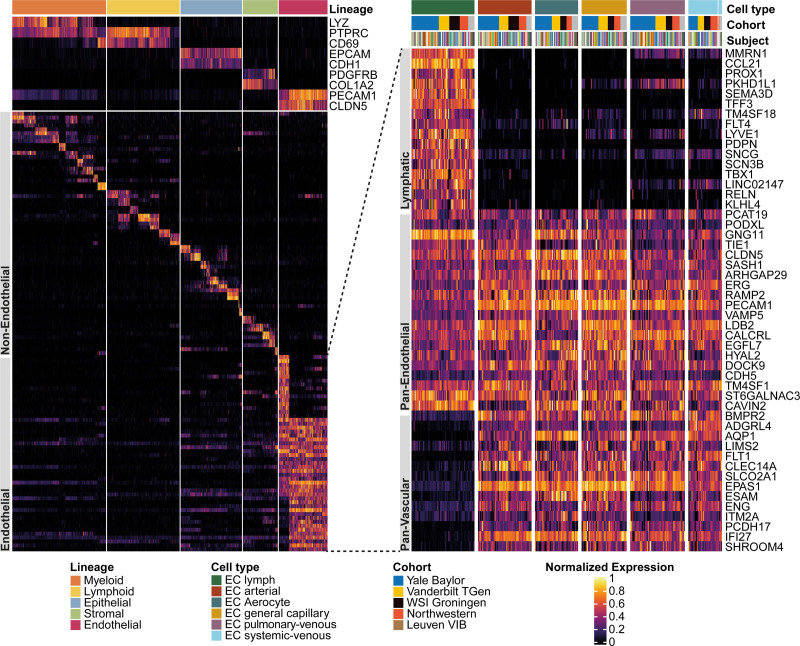
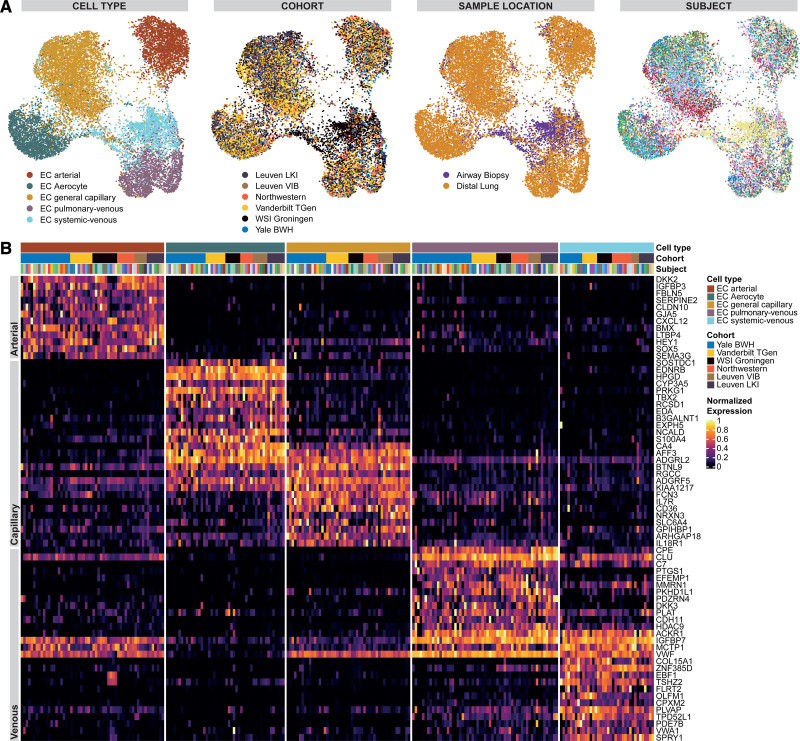
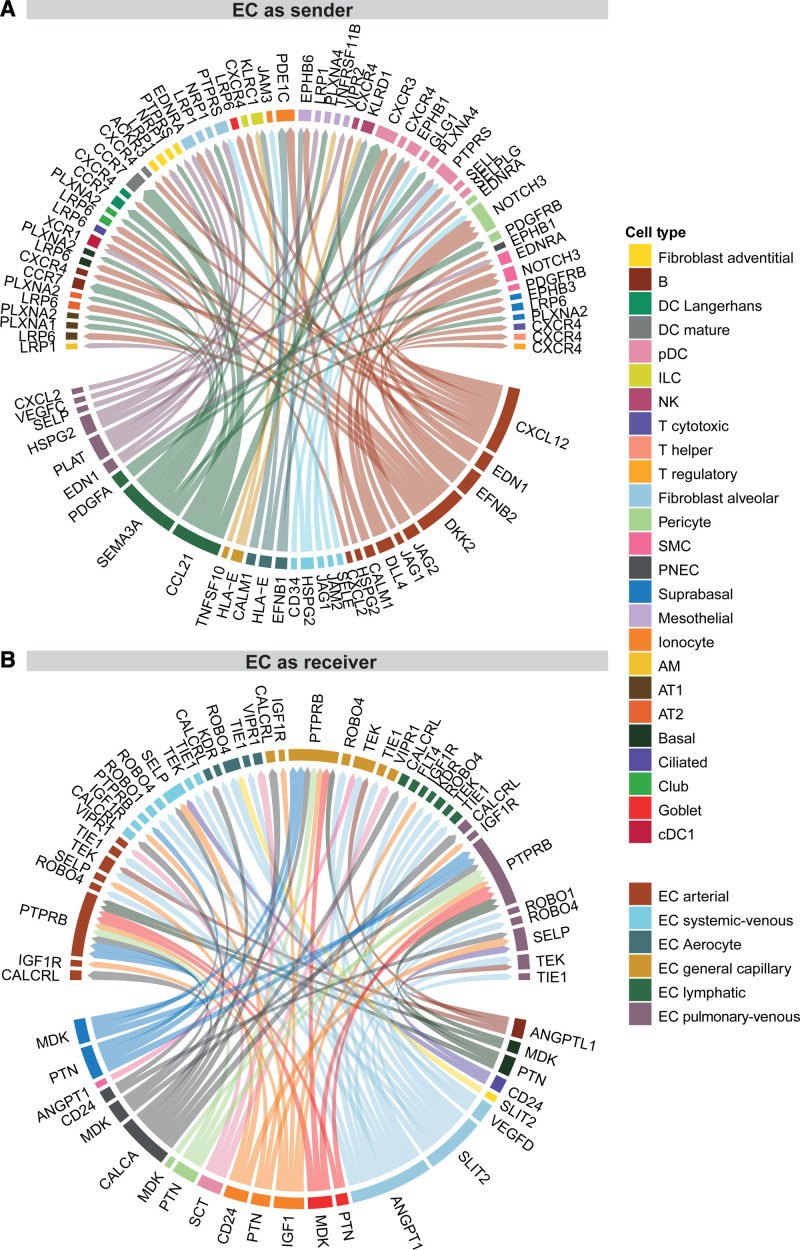
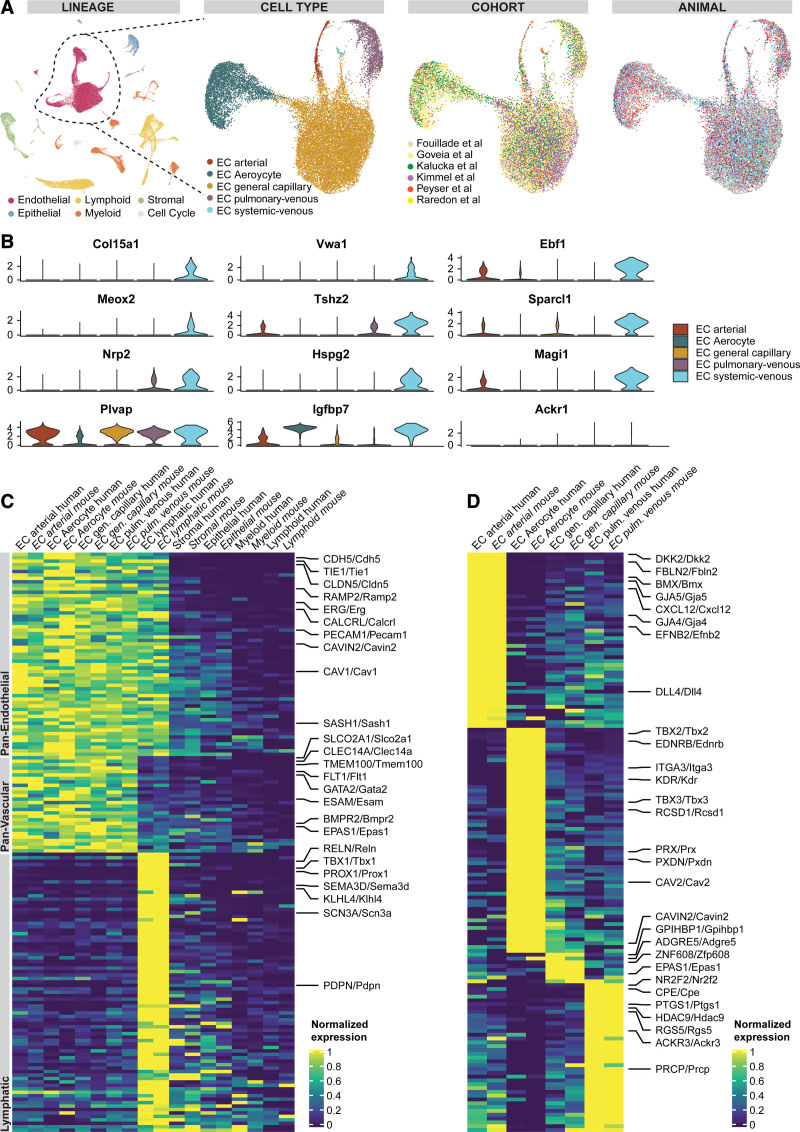
Results: Six lung scRNAseq datasets were reanalyzed and annotated to identify >15 000 vascular EC cells from 73 individuals. Differential expression analysis of EC revealed signatures corresponding to endothelial lineage, including panendothelial, panvascular, and subpopulation-specific marker gene sets. Beyond the broad cellular categories of lymphatic, capillary, arterial, and venous ECs, we found previously indistinguishable subpopulations; among venous EC, we identified 2 previously indistinguishable populations: pulmonary-venous ECs (COL15A1neg) localized to the lung parenchyma and systemic-venous ECs (COL15A1pos) localized to the airways and the visceral pleura; among capillary ECs, we confirmed their subclassification into recently discovered aerocytes characterized by EDNRB, SOSTDC1, and TBX2 and general capillary EC. We confirmed that all 6 endothelial cell types, including the systemic-venous ECs and aerocytes, are present in mice and identified endothelial marker genes conserved in humans and mice. Ligand-receptor connectome analysis revealed important homeostatic crosstalk of EC with other lung resident cell types. scRNAseq of commercially available primary lung ECs demonstrated a loss of their native lung phenotype in culture. scRNAseq revealed that endothelial diversity is maintained in pulmonary hypertension. Our article is accompanied by an online data mining tool (www.LungEndothelialCellAtlas.com).

Conclusions: Our integrated analysis provides a comprehensive and well-crafted reference atlas of ECs in the normal lung and confirms and describes in detail previously unrecognized endothelial populations across a large number of humans and mice.

Keywords: endothelial cells; microcirculation; pulmonary circulation; transcriptome.


Figures

Figure 1.
Figure 1.
Overview of the study design and the integrated dataset. A, Overview of study design. Single-cell RNA sequencing (scRNAseq) data from control samples of 5 cohorts (Vanderbilt/Translational Genomics Research Institute [TGen]: GSE135893, n=10; Northwestern: phs001750.v1.p1, n=8; Wellcome Sanger Institute [WSI]/Groningen: EGAD00001005064 and EGAD00001005065, n=10; Leuven Vlaams Instituut voor Biotechnologie [VIB]; E-MTAB-6149 and E-MTAB-6653, n=6; Yale/Baylor,: GSE136831 and GSE133747, n=34) were integrated to form the lung cell dataset. The Yale-Baylor cohort includes 4 previously unreported samples (now published under GSE164829). All vascular endothelial cells (ECs) from samples in which ECs had been profiled (n=66) were integrated with addition of ECs from control samples of a sixth cohort of sorted lung ECs (Leuvens Kankerinstituut [LKI]: E-MTAB-6308, n=7) to form the vascular EC dataset. Differential expression analysis of ECs revealed signatures corresponding to panendothelial, panvascular, and subpopulation-specific marker gene sets. EC subpopulations were localized by immunofluorescence and immunohistochemical microscopy and in situ hybridization. Potential homeostatic crosstalk of EC with other lung resident cell types was explored by ligand–receptor connectome analysis. scRNAseq data from 6 mouse cohorts were integrated to identify murine marker genes and conserved marker genes in humans and mice. B, Uniform manifold approximation and projection representation of the lung cell dataset of 278 648 cells from 68 control lungs; each dot represents a single cell, and cells are labeled as 1 of 37 discrete cell types. For uniform manifold approximation and projections colored by cohort and participant, refer to Figure IA in the Data Supplement. AM indicates alveolar macrophage; AT1/2, alveolar cell type 1/2; cDC1/2, classical dendritic cell type 1/2; cMono, classical monocyte; DC, dendritic cell; ILC, innate lymphoid cell; M, macrophage; ncMono, nonclassical monocyte; NK, natural killer; pDC, plasmacytoid dendritic cell; PNEC, pulmonary neuroendocrine cell; and SMC, smooth muscle cell.
Figure 2.
Figure 2.
Assessing coarse-granular endothelial heterogeneity of the human lung by single-cell RNA sequencing. Heat map of marker genes for all 29 non–endothelial cell (EC) cell types and of lymphatic cells as well as panendothelial (specifically expressed in all 6 EC populations) and panvascular (specifically expressed in all EC populations except lymphatic ECs) marker genes. Cell types were grouped into lineages and lineage marker genes are shown at the top of the heat map to the right. Then, 2 marker genes per non-EC cell type are shown, followed by a focus on ECs. The heat map to the left zooms in on the gene expression of ECs and depicts, from top to bottom, sets of lymphatic, panendothelial, and panvascular marker genes in the 6 endothelial populations. Each column represents the average expression value for 1 participant, grouped by cell type and cohort. All gene expression values are unity normalized from 0 to 1 across rows. For an enlarged heat map of non-EC cell types, see Figure I in the Data Supplement. TGen indicates Translational Genomics Research Institute; VIB, Leuven Vlaams Instituut voor Biotechnologie; and WSI, Wellcome Sanger Institute.
Figure 3.
Figure 3.
Assessing fine-granular endothelial heterogeneity of the human lung by single-cell RNA sequencing. A, Uniform manifold approximation and projections of 15 142 vascular endothelial cells (ECs) from 73 control lungs of 6 cohorts. Each dot represents a single cell, and cells are labeled, from left to right, by cell type, cohort, sample location, and participant. In the uniform manifold approximation and projection colored by participants, each color represents a distinct participant. B, Heat map of marker genes of all 5 vascular EC populations. Each column represents the average expression value for 1 participant, grouped by cell type and cohort. All gene expression values are unity normalized from 0 to 1 across rows. BWH indicates Brigham and Women’s Hospital; LKI, Leuvens Kankerinstituut; TGen, Translational Genomics Research Institute; VIB, Leuven Vlaams Instituut voor Biotechnologie; and WSI, Wellcome Sanger Institute.
Figure 4.
Figure 4.
Localization of aerocytes and general capillary endothelial cells (ECs). A, Representative serial immunofluorescent images of microvascular markers PRX and CA4 with positive red staining in capillaries (CA4 with off-target positive staining in macrophages) and negative staining of a larger central vessel. The general endothelial markers CLDN5 and PECAM1 in green stain the larger central vessels as well, in addition to the microvasculature. The third image shows an immunostain of the aerocyte-specific marker HPGD in green (white arrows), in addition to general microvascular marker PRX in red. Nuclei are counterstained throughout with DAPI (4′,6-diamidino-2-phenylindole). The white box highlights an aerocyte, which is shown at higher magnification in the first image of B. B, Representative immunostains of aerocytes with the specific marker HPGD in green (cytoplasmic and nuclear expression pattern), which colocalizes with the general microvascular marker PRX in red. Nuclei are counterstained throughout with DAPI. C, In situ RNA hybridization stains of markers specific to the capillary subpopulations with SOSTDC1 staining aerocyte ECs (arrows) and FCN3 staining general capillary ECs (arrows) with positive staining in red. The black box highlights an area shown to the right of it in high magnification. Conventional immunohistochemical images of shown markers can be found in Figure IV in the Data Supplement.
Figure 5.
Figure 5.
Systemic–venous endothelial cells (ECs) localize to the bronchial vascular plexus and visceral pleura. Representative, serial immunofluorescent images of systemic–venous EC markers COL15A1 and VWA1, panvenous marker ACKR1 (all in red), panendothelial markers PECAM1 and CLDN5, and lymphatic marker PDPN (all in green) in (A) a bronchus with accompanying arteries and (B) visceral pleura. In (A), COL15A1, VWA1, and ACKR1 stain the small vessels of the bronchial vascular plexus, but not the accompanying arteries; PECAM1 and CLDN5 stain all vessels. In (B), COL15A1, VWA1, and ACKR1 stain the pleural vessels, but not the alveolar microvasculature; PECAM1 and CLDN5 stain all vessels. PDPN identifies bronchial (A) and pleural (B) lymphatic vessels. VWA1 exhibits off-target staining in smooth muscle cells, and ACKR1 in ciliated cells. Nuclei are counterstained throughout with DAPI (4′,6-diamidino-2-phenylindole). Conventional immunohistochemical images of shown markers can be found in Figure IV in the Data Supplement.
Figure 6.
Figure 6.
Endothelial cell (EC)–focused intercellular communication. Visualization of a small subset of the connectomic analysis. Circos plots of top 75 edges by edge weight with EC subpopulations as (A) senders and (B) receivers. Edge thickness is proportional to edge weights. Edge color labels the source cell type. In both Circos plots, ligands occupy the lower semicircle and corresponding receptors the upper semicircle, and ligands and receptors are colored by the expressing cell type. The full results of the connectomic analysis can be found in Table VI. AM indicates alveolar macrophage; AT1/2, alveolar cell type 1/2; cDC1/2, classical dendritic cell type 1/2; cMono, classical monocyte; DC, dendritic cell; ILC, innate lymphoid cell; M, macrophage; ncMono, nonclassical monocyte; NK, natural killer; pDC, plasmacytoid dendritic cell; PNEC, pulmonary neuroendocrine cell; scRNAseq, single cell RNA sequencing; and SMC, smooth muscle cell.
Figure 7.
Figure 7.
Identification of conserved endothelial cell (EC) populations and conserved marker genes in humans and mice. A, Uniform manifold approximation and projection of all 57 974 mouse cells from 18 control mouse lungs colored by lineage membership and of the subset of 21 343 vascular ECs labeled by cell type, cohort, and animal. In the uniform manifold approximation and projection colored by participants, each color represents a distinct mouse. B, Violin plots of marker genes significantly expressed in systemic–venous ECs compared with all other vascular ECs (first to third row) and of homologues to human marker genes of systemic–venous ECs lacking specificity for murine systemic–venous ECs (fourth row). C, Heat map of conserved panendothelial, panvascular, and lymphatic EC marker genes. Each column represents the average expression value per cell type for ECs and per lineage for non-ECs. All gene expression values are unity normalized per species from 0 to 1 across rows. D, Heat map of conserved marker genes of 4 pulmonary EC populations. Each column represents the average expression value per cell type. All gene expression values are unity normalized per species from 0 to 1 across rows. Human genes are indicated by capital letters and mouse genes are indicated by small letters after the first letter, separated by a slash. Labels of mouse, but not human, cell types/lineages are given in italics.

References

    1. Katz AM. Knowledge of the circulation before William Harvey. Circulation. 1957; 15:726–734 - PubMed
    1. Vita JA. Endothelial function. Circulation. 2011; 124:e906–e912. doi: 10.1161/CIRCULATIONAHA.111.078824 - PubMed
    1. Deanfield JE, Halcox JP, Rabelink TJ. Endothelial function and dysfunction: testing and clinical relevance. Circulation. 2007; 115:1285–1295. doi: 10.1161/CIRCULATIONAHA.106.652859 - PubMed
    1. Flammer AJ, Anderson T, Celermajer DS, Creager MA, Deanfield J, Ganz P, Hamburg NM, Lüscher TF, Shechter M, Taddei S, et al. . The assessment of endothelial function: from research into clinical practice. Circulation. 2012; 126:753–767. doi: 10.1161/CIRCULATIONAHA.112.093245 - PMC - PubMed
    1. Eelen G, de Zeeuw P, Simons M, Carmeliet P. Endothelial cell metabolism in normal and diseased vasculature. Circ Res. 2015; 116:1231–1244. doi: 10.1161/CIRCRESAHA.116.302855 - PMC - PubMed

Publication types