. 2021 Dec;17(12):4363-4385.
doi: 10.1080/15548627.2021.1917129. Epub 2021 May 24.

Transcription- and phosphorylation-dependent control of a functional interplay between XBP1s and PINK1 governs mitophagy and potentially impacts Parkinson disease pathophysiology

Affiliations

Transcription- and phosphorylation-dependent control of a functional interplay between XBP1s and PINK1 governs mitophagy and potentially impacts Parkinson disease pathophysiology

Wejdane El Manaa et al. Autophagy. 2021 Dec.

Abstract

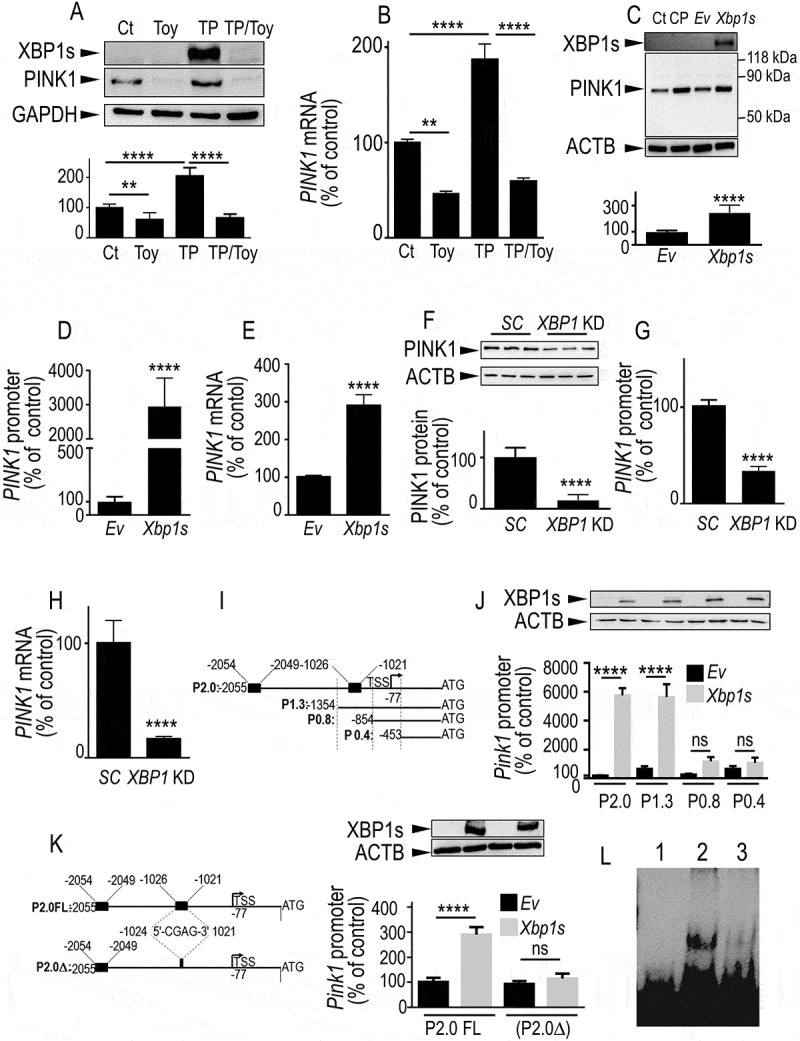
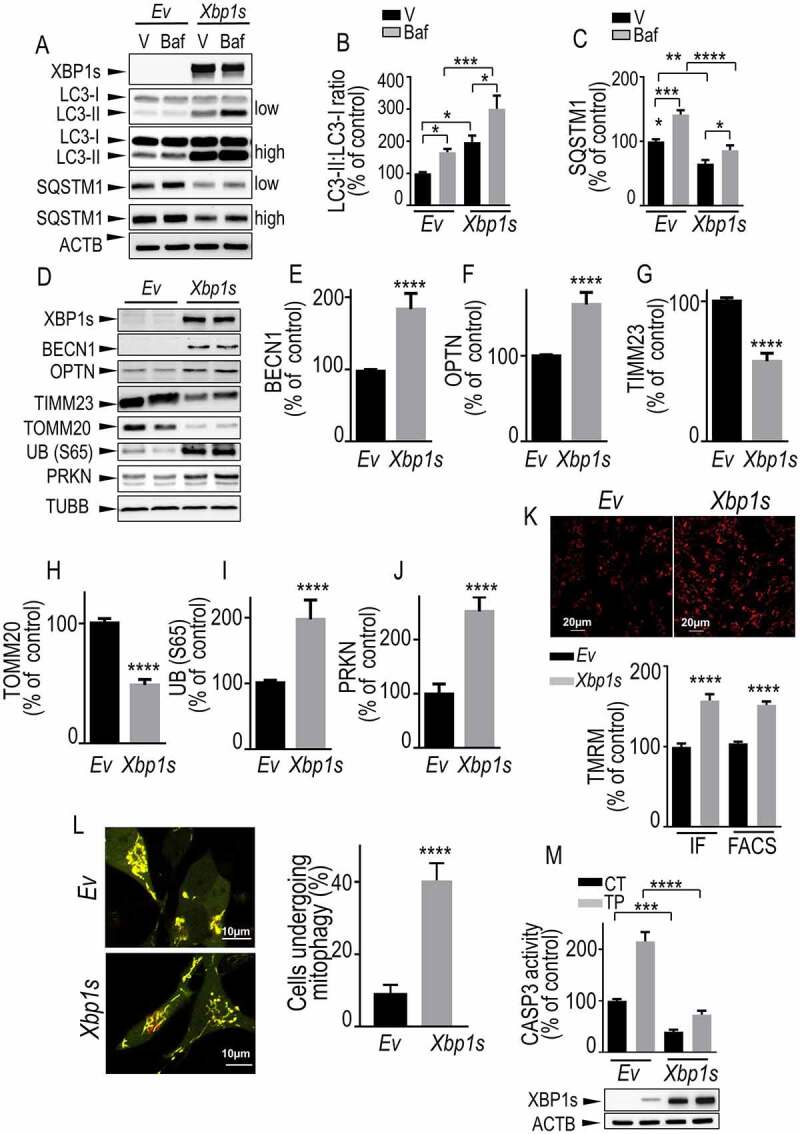
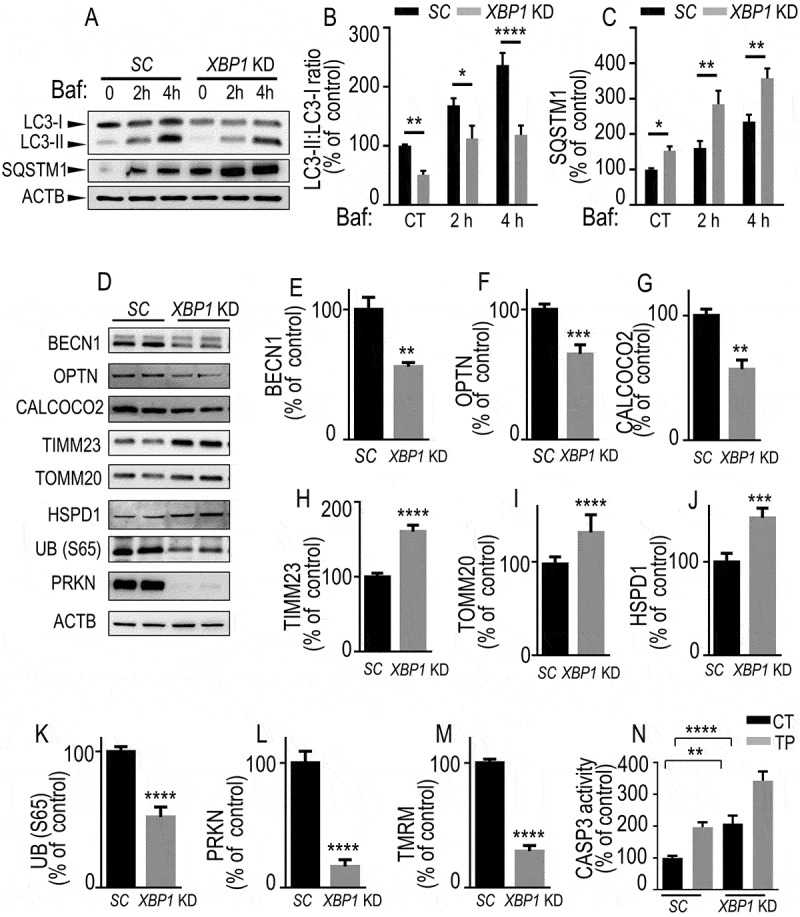
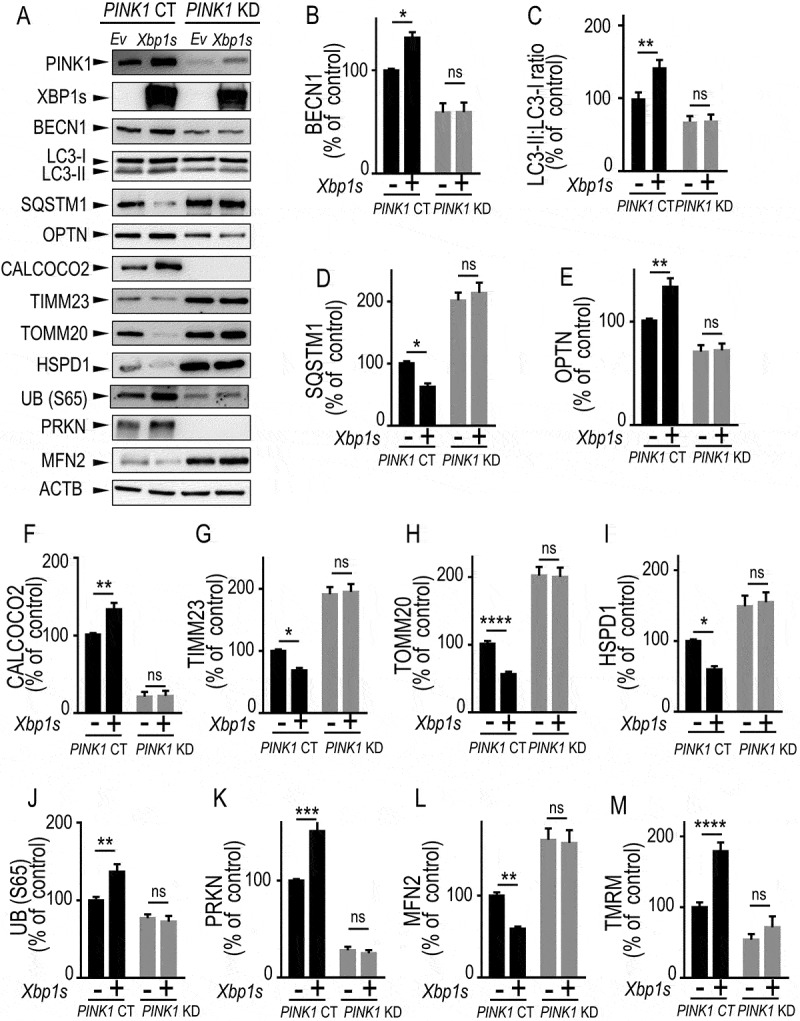
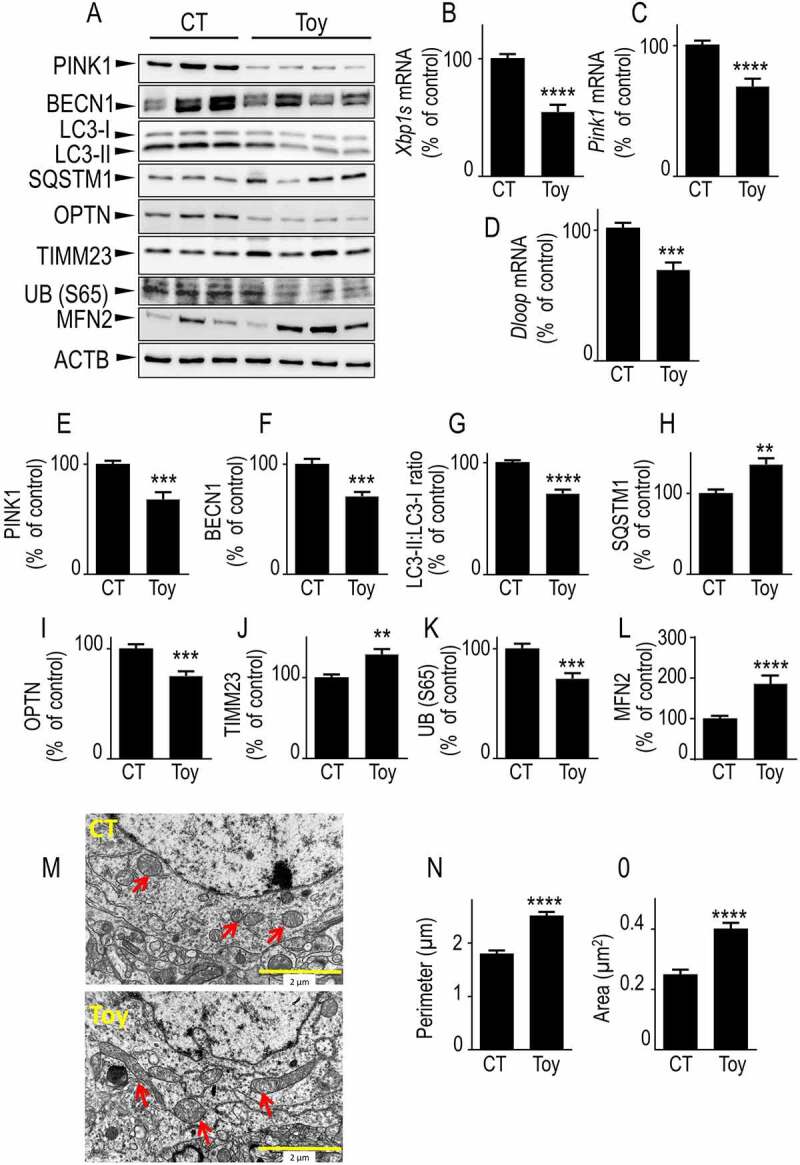
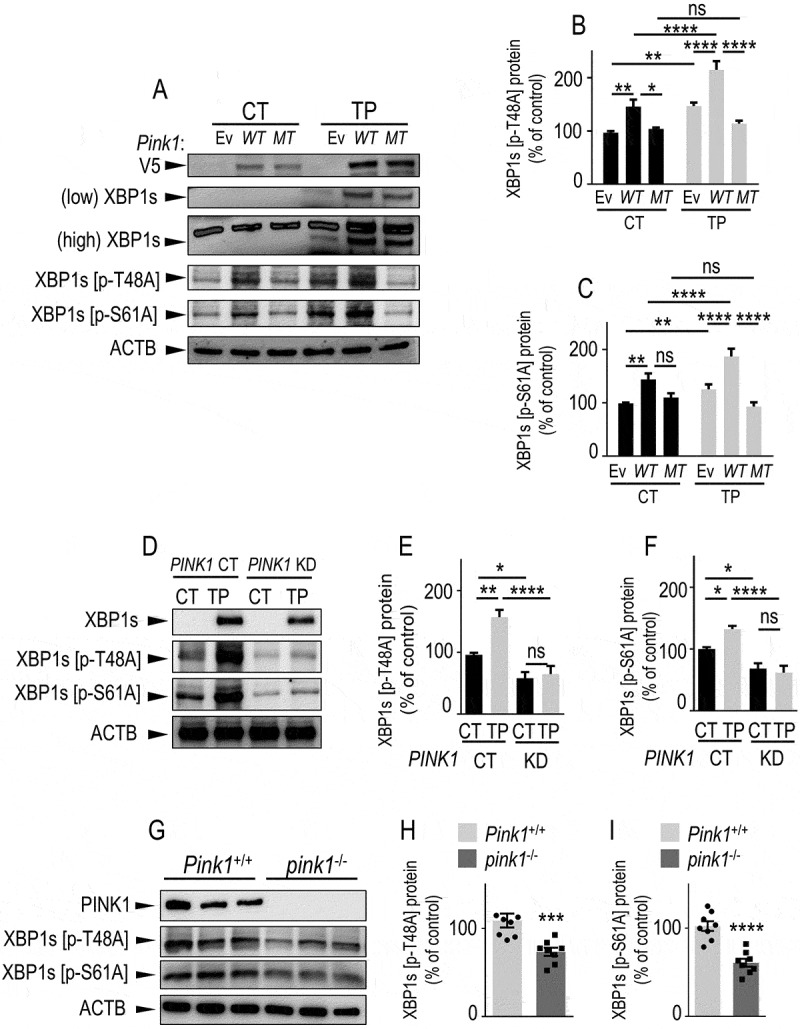
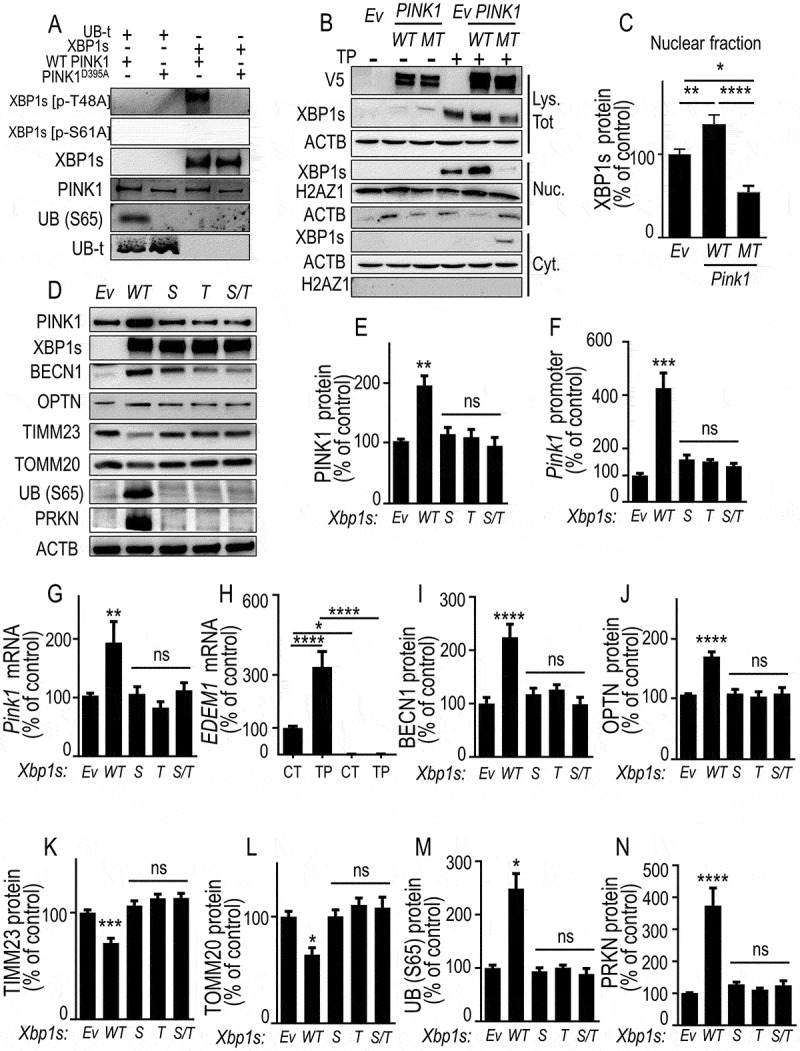
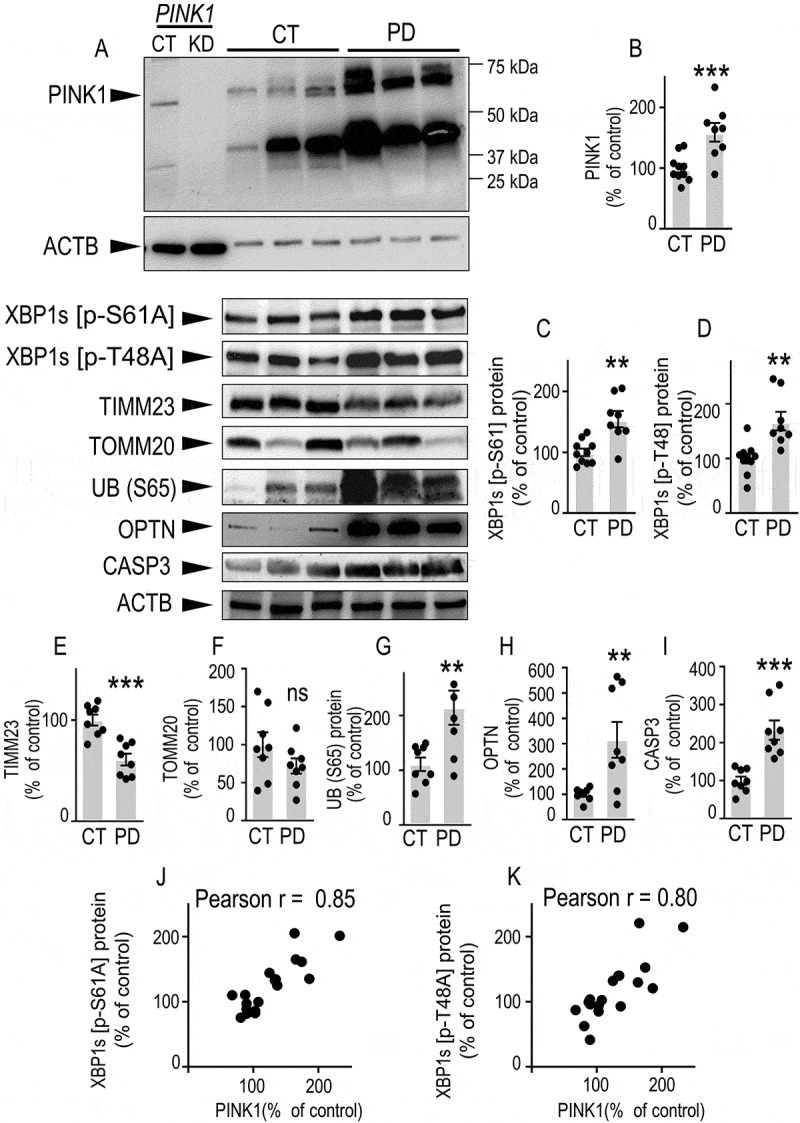
Parkinson disease (PD)-affected brains show consistent endoplasmic reticulum (ER) stress and mitophagic dysfunctions. The mechanisms underlying these perturbations and how they are directly linked remain a matter of questions. XBP1 is a transcription factor activated upon ER stress after unconventional splicing by the nuclease ERN1/IREα thereby yielding XBP1s, whereas PINK1 is a kinase considered as the sensor of mitochondrial physiology and a master gatekeeper of mitophagy process. We showed that XBP1s transactivates PINK1 in human cells, primary cultured neurons and mice brain, and triggered a pro-mitophagic phenotype that was fully dependent of endogenous PINK1. We also unraveled a PINK1-dependent phosphorylation of XBP1s that conditioned its nuclear localization and thereby, governed its transcriptional activity. PINK1-induced XBP1s phosphorylation occurred at residues reminiscent of, and correlated to, those phosphorylated in substantia nigra of sporadic PD-affected brains. Overall, our study delineated a functional loop between XBP1s and PINK1 governing mitophagy that was disrupted in PD condition.Abbreviations: 6OHDA: 6-hydroxydopamine; baf: bafilomycin A1; BECN1: beclin 1; CALCOCO2/NDP52: calcium binding and coiled-coil domain 2; CASP3: caspase 3; CCCP: carbonyl cyanide chlorophenylhydrazone; COX8A: cytochrome c oxidase subunit 8A; DDIT3/CHOP: DNA damage inducible transcript 3; EGFP: enhanced green fluorescent protein; ER: endoplasmic reticulum; ERN1/IRE1α: endoplasmic reticulum to nucleus signaling 1; FACS: fluorescence-activated cell sorting; HSPD1/HSP60: heat shock protein family D (Hsp60) member 1; MAP1LC3/LC3: microtubule associated protein 1 light chain 3; MFN2: mitofusin 2; OPTN: optineurin; PD: Parkinson disease; PINK1: PTEN-induced kinase 1; PCR: polymerase chain reaction:; PRKN: parkin RBR E3 ubiquitin protein ligase; XBP1s [p-S61A]: XBP1s phosphorylated at serine 61; XBP1s [p-T48A]: XBP1s phosphorylated at threonine 48; shRNA: short hairpin RNA, SQSTM1/p62: sequestosome 1; TIMM23: translocase of inner mitochondrial membrane 23; TM: tunicamycin; TMRM: tetramethyl rhodamine methylester; TOMM20: translocase of outer mitochondrial membrane 20; Toy: toyocamycin; TP: thapsigargin; UB: ubiquitin; UB (S65): ubiquitin phosphorylated at serine 65; UPR: unfolded protein response, XBP1: X-box binding protein 1; XBP1s: spliced X-box binding protein 1.

Keywords: Mitophagy; PINK1; Parkinson disease; XBP1; phosphorylation; transcription; unfolded protein response.


Conflict of interest statement

No potential conflict of interest was reported by the author(s).

Figures

Figure 1.
Figure 1.
ER stress modulators and XBP1s regulate PINK1 transcription. (A and B) SH-SY5Y cells were treated for 8 h with vehicle (Ct, DMSO), toyocamycin (Toy, 1 µM), thapsigargin (TP, 1 µM) or thapsigargin and toyocamycin (TP/Toy). In TP/Toy condition, cells were pretreated for 16 h with Toy then TP was added for 8 h. Then, PINK1 and XBP1s protein expressions (A, N = 12, One-way ANOVA, Tukey’s multiple comparisons test) and PINK1 mRNA levels (B, N = 9, One-way ANOVA, Tukey’s multiple comparisons test) were analyzed as described in Materials and Methods. Data are expressed as percent of control DMSO-treated cells (taken as 100%) and are the means ± SEM of 3–4 independent experiments performed in triplicates. GAPDH expression (A) is provided as a control of protein load. (C-E) SH-SY5Y cells were transiently transfected with an empty pcDNA3 vector (Ev) or wild-type Xbp1s cDNA. Twenty-four hours after transfection, PINK1 protein expression (C, N = 12, analyzed by Student’s t test), promoter transactivation (D, N = 15, Student’s t test) and mRNA levels (E, N = 12, Student’s t test) were analyzed as described in Materials and Methods. SH-SY5Y cells treated with CCCP (CP, 10 µM for 6 h) were included as migration controls for PINK1. Data are expressed as percent of control Ev-transfected cells (taken as 100%) and are the means ± SEM of 4–5 independent experiments performed in triplicates. ACTB and XBP1s expressions are provided in (C) as a control of protein load and Xbp1s transfection efficiency. (F-H) SH-SY5Y stably expressing scrambled (SC) or shRNA-targeting XBP1 (XBP1 KD) were assessed for PINK1 protein expression (F, N = 9, analyzed by Student’s t test), PINK1 promoter transactivation (G, N = 15, Student’s t test) and PINK1 mRNA levels (H, N = 18, Student’s t test) as described in Methods. Data are expressed as percent of control SC cells (taken as 100%) and are the means ± SEM of 3–6 independent experiments performed in triplicates. ACTB expression is provided in (F) as a control of protein load. (I) The scheme represents the full-length (FL, P2.0) mouse Pink1 promoter region and 5ʹ end deletion constructs (P1.3, P0.8 and P0.4) in frame with luciferase. Black boxes on P2.0 construct correspond to two putative Xbp1s responsive elements. (J) Promoter constructs were then co-transfected in SH-SY5Y cells with the GLB1 (galactosidase beta 1) reporter gene (in order to normalize transfection efficiencies) and either empty vector (Ev, black bars) or Xbp1s (gray bars) cDNAs. Twenty-four hours after transfection, luciferase activity was measured (N = 12, analyzed by One-way ANOVA, Tukey’s multiple comparisons test) then expressions of XBP1s and ACTB were analyzed as described in Methods. Data are expressed as percent of control Ev/GLB1-transfected cells (taken as 100%) and are the means ± SEM of 4 independent experiments performed in triplicates. (K) The scheme (left panel) represents the PINK1 promoter construct (P2.0∆) lacking the −1024/-1021 Xbp1s-responsive element. P2.0 and P2.0∆ promoter constructs were co-transfected with the GLB1 reporter gene and either empty vector (Ev, black bars) or Xbp1s (gray bars) cDNAs in SH-SY5Y cells. Twenty-four hours after transfection, luciferase activity was measured (N = 9, analyzed by One-way ANOVA, Tukey’s multiple comparisons test) then expression of XBP1s and ACTB were analyzed as described in Methods (right panel). Data are expressed as percent of control Ev/GLB1-transfected cells (taken as 100%) and are the means ± SEM of 3 independent experiments performed in triplicates. Statistical significances are: **, P < 0.01, ****, P < 0.0001 and ns for non-significant. (L) EMSA analysis of the physical interaction of purified recombinant XBP1s and Pink1 biotinylated probes encompassing the −1024/-1021 sequence of the mouse promoter (see panel K) in absence (lane 2) or in the presence (lane 3) of an excess of unlabeled probe. Lane 1 corresponds to biotinylated probe alone
Figure 2.
Figure 2.
Xbp1s overexpression leads to increased mitophagy in SH-SY5Y cells. (A-C) SH-SY5Y cells were transiently transfected with an empty vector (Ev) or Xbp1s cDNA treated or not with bafilomycin A1 (Baf, 100 nM) then analyzed by western blot for XBP1s (A, N = 15), LC3-II:LC3-I ratio (A and B, N = 12) and SQSTM1/p62 (A and C, N = 15) protein levels. Statistical significances were analyzed by ordinary one-way ANOVA followed by Sidak’s multiple comparison test, * P < 0.05, ** P < 0.01, *** P < 0.001, ****, P < 0.0001. (D-J) SH-SY5Y cells were transiently transfected with an empty vector (Ev) or Xbp1s cDNA then analyzed for BECN1 (D and E, N = 9), OPTN (D and F, N = 15), TIMM23 (D and G, N = 12), TOMM20 (D and H, N = 9), UB (S65) (D and I, N = 12), PRKN (D and J, N = 12) and TUBB protein levels as described in Methods. (K) SH-SY5Y cells were transiently transfected with an empty vector (Ev) or Xbp1s cDNA then mitochondrial membrane potential was measured by cell imaging (upper panel, N = 100 cells, two independent experiments, IF in histogram) or flow cytometry (, N = 15, 5 independent experiments, FACS in histogram) by means of TMRM probe as detailed in the Methods. Values are expressed as percent of control Ev-transfected cells (taken as 100%) and correspond to the means ± SEM of 2–5 independent experiments. Statistical significances were analyzed by Mann-Whitney test, ****, P < 0.0001. (L) SH-SY5Y cells were transiently transfected with COX8A-EGFP-mCherry cDNA together with an empty vector (Ev) or Xbp1s cDNAs. Fragmented mitochondria visualized by red fluorescence punctate (left panel) were counted as described in Methods. The degree of mitophagy (right panel) was calculated by the increase of number of cells harboring red punctae. (M,) CASP3 activity fluorimetric assay was performed as described in Methods. Values are expressed as percent of control Ev-transfected cells (taken as 100%) and correspond to the means ± SEM of 4 independent experiments performed in triplicates. Statistical significances were analyzed by ordinary one-way ANOVA followed by Sidak’s multiple comparison test, ***, P < 0.001, ****, P < 0.0001
Figure 3.
Figure 3.
Endogenous XBP1s lowers mitophagic response. (A-C) SH-SY5Y cells stably expressing either control (scrambled, SC, black bars) or Xbp1 shRNA (Xbp1KD, gray bars) were either treated or not with bafilomycin A1 (Baf 100 nM for the indicated times) then examined by western blot (see Methods) for LC3-II:LC3-I ratio (A and B, N = 9, one-way ANOVA, Tukey’s multiple comparison test), SQSTM1 (A and C, N = 6, Kruskal Wallis multiple comparison). (D-L) BECN1 (D and E, N = 6, Mann-Whitney test), OPTN (D and F, N = 9, Student’s t test), CALCOCO2 (D and G, N = 6, Mann-Whitney test), TIMM23 (D and H, N = 9, Student’s t test), TOMM20 (D and I, N = 12, Mann-Whitney test), HSPD1 (D and J, N = 9, Student’s t test), UB (S65) (D and K, N = 9, Student’s t test) and PRKN (D and L, N = 9, Student’s t test) protein expressions in SC or XBP1 KD cells. ACTB expressions are provided in (A and D) as controls of protein load. (M) Mitochondrial potentials of SC and XBP1 KD cells were analyzed by flow cytometry as described in Methods (N = 15, analyzed by Student’s t test). (N) CASP3 activity expression was measured in basal and TP-stimulated conditions as described in Methods (N = 12, analyzed by One-way ANOVA followed by Sidak’s multiple comparison test). (B-N) Data are expressed as percent of SC (CT) cells (taken as 100%) and are the means ± SEM of 2–5 experiments performed in triplicates. Statistical significances are * P < 0.05, ** P < 0.01, *** P < 0.001, ****, P < 0.0001
Figure 4.
Figure 4.
XBP1s-mediated control of mitophagy is fully PINK1-dependent. (A-L) Control (PINK1 CT) or PINK1 knocked-down (PINK1 KD) SH-SY5Y cells were transiently transfected with an empty vector (Ev) or with Xbp1s (Xbp1s) cDNA. Twenty-four hours after transfection, BECN1 (A and B, N = 8) LC3-II:LC3-I ratio (A and C, N = 8), SQSTM1 (A and D, N = 8), OPTN (A and E, N = 8), CALCOCO2 (A and F, N = 8), TIMM23 (A and G, N = 12), TOMM20 (A and H, N = 12), HSPD1 (A and I, N = 12), UB (S65) (A and J, N = 8), PRKN (A and K, N = 8) and MFN2 (A and L, N = 12) protein expressions were analyzed by western blot as described in Methods. ACTB expression is provided in (A) as a control of protein load. (M) PINK1 CT and PINK1 KD cells either empty vector (-) or Xbp1s (+) cDNA-transfected were analyzed by flow cytometry to measure mitochondrial membrane potential as described in Methods. (B-M) Data are expressed as percent of PINK1 CT non-transfected cells (taken as 100%) and are the means ± SEM. of 4–6 independent experiments performed in duplicates. Statistical analyses were performed by Kruskal Wallis multiple comparison test (B) and Sidak’s multiple comparisons test (C-M). Statistical significances: ns, not significant, * P < 0.05, ** P < 0.01, *** P < 0.001, **** P < 0.0001
Figure 5.
Figure 5.
Pharmacological blockade of XBP1s impacts mitophagy, mitochondrial morphology and mtDNA in mice brain. (A) Two-month-old mice were intraperitoneally injected with toyocamycin (Toy) or vehicle (CT) as described in Methods. Seventy-two hours after injection, Xbp1s (B), Pink1 (C) and Dloop (D) mRNA were analyzed by RT-PCR as described in Methods. PINK1 (A and E), BECN1 (A and F), LC3-II:LC3-I ratio (A and G), SQSTM1 (A and H), OPTN (A and I), TIMM23 (A and J), UB (S65) (A and K), MFN2 (A and L) protein expressions were analyzed by western blot as described in Methods. ACTB expression is provided in (A) as a control of protein load. (B-L) Data are expressed as percent of CT vehicle-injected mice brain (taken as 100%) and are the means ± SEM of 9–14 mice for each group. Statistical significances were analyzed by Student’s t test and Mann-Whitney test, ** P < 0.01, *** P < 0.001, **** P < 0.0001. (M) Electron microphotographs illustrating mitochondrial morphology in brains (cortical region) from CT (upper) and Toy (lower)-injected mice. Red arrows point to mitochondria in two representative images of neuronal cell body (N, nucleus). (N and O) Quantification of mitochondria perimeter and area on brain slices from CT and Toy-injected mice. Bars correspond to the average mitochondria perimeter (N, µm) and area (O, µm2) counted from 20–30 images of neuronal cell bodies (2 mice for each condition). Data are expressed as means ± SEM and statistical significances were analyzed by Mann-Whitney test, **** P < 0.0001
Figure 6.
Figure 6.
PINK1 phosphorylates XBP1s on threonine 48 and serine 61 residues in cells and in mice brain. (A-C) SH-SY5Y cells were transiently transfected with an empty vector (Ev), V5-tagged WT Pink1 (WT) or kinase-dead Pink1 mutant (Pink1K219M, MT) cDNAs. Twenty-four hours after transfection, cells were treated for 8 h with either vehicle (CT, black bars) or thapsigargin (TP, 1 µM, gray bars). (D-F) PINK1 CT and PINK1 KD cells were treated as in A-C with either vehicle (CT, black bars) or thapsigargin (TP, 1 µM, gray bars). V5-tagged PINK1 (A), total XBP1s (A and D) and phosphorylated XBP1s (A and D, pXBP1s [p-S61A], pXBP1s [p-T48A]) expressions were measured by western blot as described in Methods. (B,C,E,F) Data corresponding to indicated XBP1s phosphorylated species are expressed as percent of untreated Ev (B and C, N = 15) or PINK1 CT cells (E and F, N = 12 and 6 respectively) (taken as 100%) and are the means ± SEM of 2–5 independent experiments performed in triplicate. Statistical significances were performed by two-way ANOVA, Tukey’s multiple comparisons test, ns, non-significant, * P < 0.05, ** P < 0.01, **** P < 0.0001. (G-I) western blot analysis of pXBP1s [p-S61A] and pXBP1s [p-T48A] in Pink1+/+ and pink1−/- mice brain. Bars are the means ± SEM of 8 mice per group. Statistical significances were analyzed by Mann-Whitney’s test (H) and Student’s t test (I), ***, p < 0.001; ****, p < 0.0001
Figure 7.
Figure 7.
PINK1-mediated phosphorylation of XBP1s enhances its nuclear translocation, controls its own transcription and mitophagy, a phenotype abolished by non-phosphorylable XBP1s mutants. (A) XBP1s and UB (S65) (used as positive control substrate) phosphorylations by recombinant wild-type PINK1 (WT PINK1) or kinase-dead mutant PINK1 (PINK1D395A) were performed as described in Methods. XBP1s, XBP1s [p-T48A], XBP1s [p-S61A], total UBB (UB-t), UB (S65) and PINK1 protein levels were analyzed by western blot. (B) SH-SY5Y cells were transfected with empty vector (Ev), WT PINK1 or PINK1D395A (MT) cDNA. Twenty-four hours after transfection, cells were treated for 8 h without (-) or with (+) thapsigargin (TP, 1 µM). XBP1s, V5-tagged PINK1 and ACTB protein expressions were monitored in whole cell lysate (Lys. Tot.) while XBP1s, histone (H2AZ1) and ACTB protein expressions were monitored by western blot in either cytoplasmic (Cyt.) or nuclear (Nuc.) cellular fractions prepared as described in Methods. (C) Data corresponding to nuclear XBP1s are expressed as percent of Ev-untreated cells (taken as 100%) and are the means ± SEM of 2 independent experiments performed in triplicate. Statistical significances were analyzed by one-way ANOVA, Tukey’s multiple comparisons test * P < 0.05, ** P < 0.01, **** P < 0.0001. (D-G) SH-SY5Y were transiently transfected with an empty vector (Ev), wild-type Xbp1s (WT) or Xbp1s mutants (Xbp1s [p-S61A] (S), Xbp1s [p-T48A] [T] or Xbp1s [p-S61A]/Xbp1s [p-T48A] [S/T]) cDNAs. Twenty-four hours after transfection, PINK1 protein expressions (D and E, N = 12), promoter activity (F, N = 12), and mRNA levels (G) were analyzed as described in Methods. Data are expressed as percent of control Ev-transfected cells (taken as 100%) and are the means ± SEM of 4 independent experiments performed in triplicates. Statistical significances were analyzed by one-way ANOVA, Turkey’s multiple comparisons test, ns, non-significant, ** P < 0.01, *** P < 0.01. (H) EDEM1 mRNA was measured in basal (CT) or thapsigargin (TP)-stimulated conditions in wild-type (PINK1 CT, black bars) or PINK1 KD SH-SY5Y cells (note that EDEM1 mRNA are totally undetectable in PINK1 KD cells). Data are expressed as percent of control (CT)-untreated cells (taken as 100%) and are the mean ± SEM of 4 independent experiments performed in triplicates. Statistical analysis was performed by two-way ANOVA, Sidak’s multiple comparison test, * P < 0.05, **** P < 0.0001. (D, I-N) Expressions of BECN1 (D and I), OPTN (D and J), TIMM23 (D and K), TOMM20 (D and L) UB (S65) (D and M) and PRKN (D and N) were analyzed by western blotting after Ev-, WT Xbp1s or S, T and S/T Xbp1s-mutants cDNAs transfection as described in Methods. Data are expressed as percent of Ev cells (taken as 100%) and are the mean ± SEM of 3 independent experiments performed in triplicates. Statistical analysis were analyzed by one-way ANOVA followed by either Kruskal-Wallis multiple comparison test (E,L,M) or Tukey’s multiple comparison (F,G,I-K,N), * P < 0.05, ** P < 0.01, *** P < 0.001, **** P < 0.0001 and ns = non-significant
Figure 8.
Figure 8.
PINK1, XBP1s phosphorylation and mitophagic markers expressions are altered in sporadic Parkinson disease (PD)-affected brains. (A-J) PINK1 (A and B), XBP1s [p-S61A] (A and C), XBP1s [p-T48A] (A and D), TIMM23 (A and E), TOMM20 (A and F), UB (S65) (A and G), OPTN (A and H) and CASP3 (A and I) protein expressions in control (CT, N = 10) and PD, (N = 8) brains were analyzed by western blot as described in the Methods. Data are expressed as percent of CT brains (taken as 100%). Statistical significances were analyzed by Student’s t test: ns, non-significant, ** P < 0.01, *** P < 0.001. Correlations analyses of PINK1 and XBP1s [p-S61A] (J) and XBP1s [p-T48A] (K) protein expressions are illustrated in (J and K). PINK1 full gel illustrating the migration profile of full-length PINK1 in control (PINK1 CT) and shRNA-depleted PINK1 (PINK1 KD) samples is provided in (A). A representative ACTB gel is provided to illustrate equal protein load

References

    1. Zeng XS, Geng WS, Jia JJ, et al. Cellular and molecular basis of neurodegeneration in Parkinson disease. Front Aging Neurosci. 2018;10:109. - PMC - PubMed
    1. Cooper AA, Gitler AD, Cashikar A, et al. Alpha-synuclein blocks ER-Golgi traffic and Rab1 rescues neuron loss in Parkinson’s models. Science. 2006;313:324–328. - PMC - PubMed
    1. Sugeno N, Takeda A, Hasegawa T, et al. Serine 129 phosphorylation of alpha-synuclein induces unfolded protein response-mediated cell death. J Biol Chem. 2008;283:23179–23188. - PubMed
    1. Hetz C, Saxena S.. ER stress and the unfolded protein response in neurodegeneration. Nat Rev Neurol. 2017;13:477. - PubMed
    1. Alves da Costa C, Manaa WE, Duplan E, et al. The endoplasmic reticulum stress/unfolded protein response and their contributions to Parkinson’s disease physiopathology. Cells. 2020;9. - PMC - PubMed

Publication types