. 2021 May 24;27(1):50.
doi: 10.1186/s10020-021-00311-5.

Taxonomic variations in the gut microbiome of gout patients with and without tophi might have a functional impact on urate metabolism

Affiliations

Taxonomic variations in the gut microbiome of gout patients with and without tophi might have a functional impact on urate metabolism

Eder Orlando Méndez-Salazar et al. Mol Med. .

Abstract

Objective: To evaluate the taxonomic composition of the gut microbiome in gout patients with and without tophi formation, and predict bacterial functions that might have an impact on urate metabolism.

Methods: Hypervariable V3-V4 regions of the bacterial 16S rRNA gene from fecal samples of gout patients with and without tophi (n = 33 and n = 25, respectively) were sequenced and compared to fecal samples from 53 healthy controls. We explored predictive functional profiles using bioinformatics in order to identify differences in taxonomy and metabolic pathways.

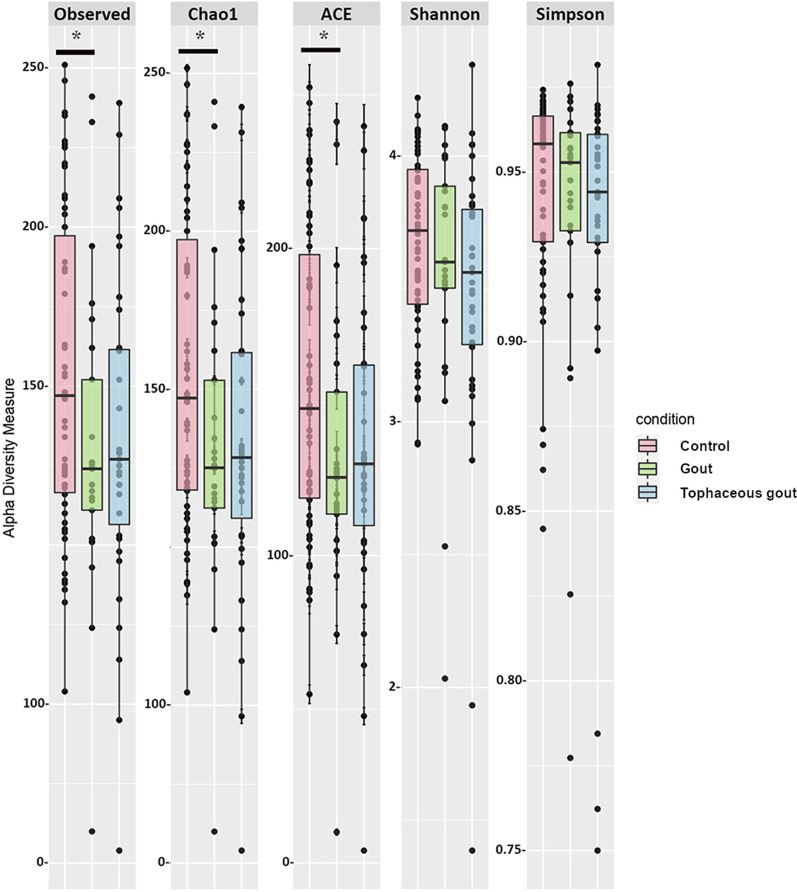
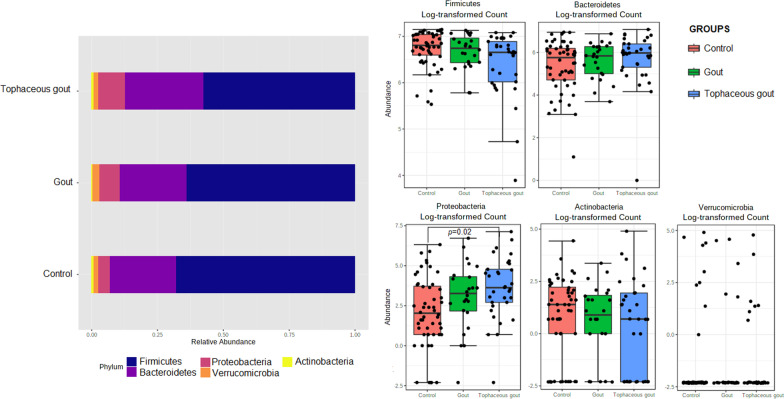
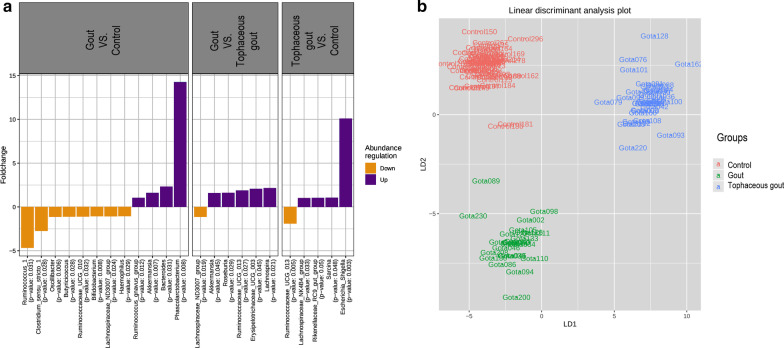
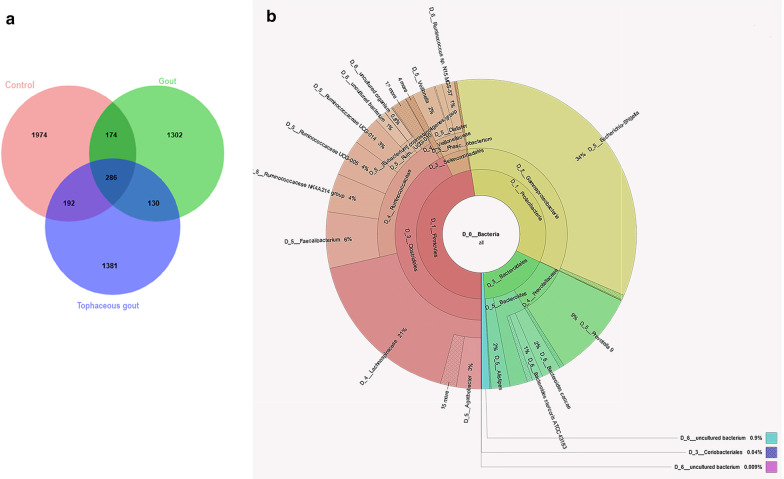
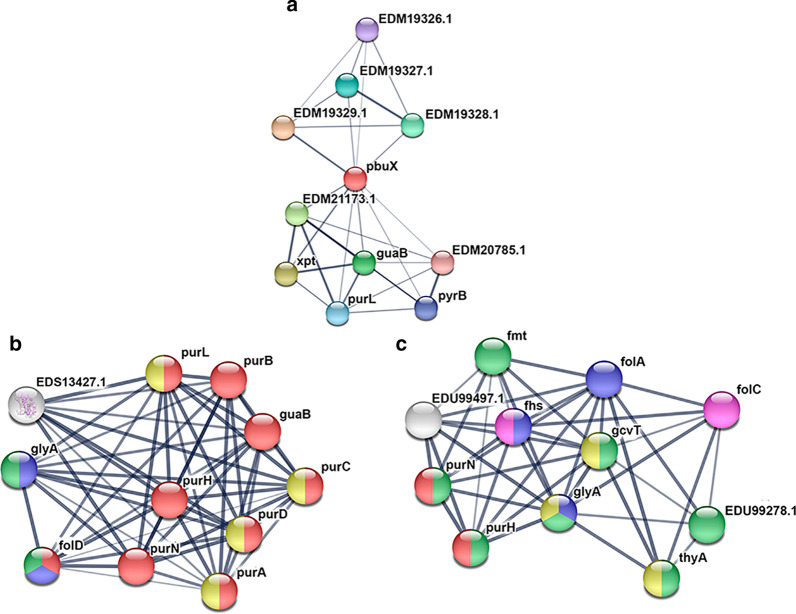
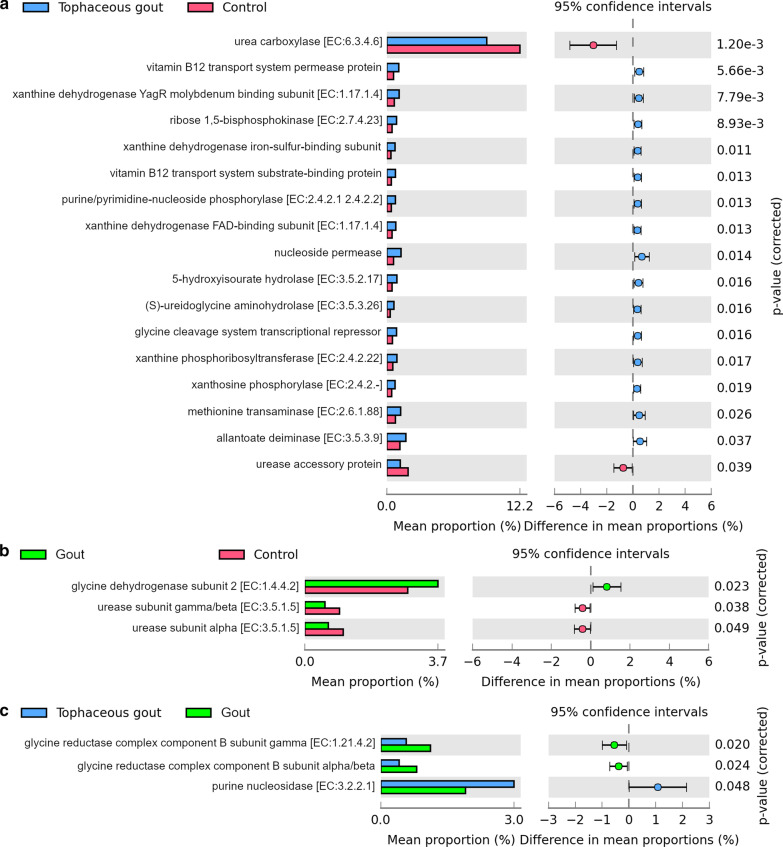
Results: We identified a microbiome characterized by the lowest richness and a higher abundance of Phascolarctobacterium, Bacteroides, Akkermansia, and Ruminococcus_gnavus_group genera in patients with gout without tophi when compared to controls. The Proteobacteria phylum and the Escherichia-Shigella genus were more abundant in patients with tophaceous gout than in controls. Fold change analysis detected nine genera enriched in healthy controls compared to gout groups (Bifidobacterium, Butyricicoccus, Oscillobacter, Ruminococcaceae_UCG_010, Lachnospiraceae_ND2007_group, Haemophilus, Ruminococcus_1, Clostridium_sensu_stricto_1, and Ruminococcaceae_UGC_013). We found that the core microbiota of both gout groups shared Bacteroides caccae, Bacteroides stercoris ATCC 43183, and Bacteroides coprocola DSM 17136. These bacteria might perform functions linked to one-carbon metabolism, nucleotide binding, amino acid biosynthesis, and purine biosynthesis. Finally, we observed differences in key bacterial enzymes involved in urate synthesis, degradation, and elimination.

Conclusion: Our findings revealed that taxonomic variations in the gut microbiome of gout patients with and without tophi might have a functional impact on urate metabolism.

Keywords: Gout; Gut microbiota; Uric acid metabolism.


Conflict of interest statement

The authors declare not to have any conflicts of interest.

Figures

Fig. 1
Fig. 1
Alpha-diversity plots of bacterial communities in the microbiome of study groups. Variations for richness (Observed, Chao1, ACE) and diversity (Shannon and Simpson) indexes between both gout groups and healthy controls. *Significant difference after multiple comparison adjustment
Fig. 2
Fig. 2
Relative abundance of ASVs at the phylum level. Stacked bar plots represent the relative abundance at the phylum level using SILVA 132 database. Boxplots showing comparative distribution of Firmicutes, Bacteroidetes, Proteobacteria, Actinobacteria and Verrucomicrobia in controls (red bars), in gout group (green bars) and in the tophaceous gout group (blue bars). Boxes denote the interquartile range (IQR) between the first and third quartiles, and the line inside represents the median (2nd quartile). Whiskers show the lowest and the highest values
Fig. 3
Fig. 3
a Fold change of the relative abundances of bacterial genera showing significant differences between both gout groups and healthy controls. Purple color (positive fold change) and orange color (negative fold change) indicate an increase or a decrease of the bacterial genera within each group, respectively. b Linear discriminant analysis (LDA) plot of genera abundances data derived from non-parametrical statistical analysis shows the significance of genera combinations in differentiating the three study groups
Fig. 4
Fig. 4
a Venn diagram showing the number of shared and unique core ASVs among the three study groups. The core microbiota in the gout groups is exhibited in the overlap of the green and blue circles. b Krona chart representing the taxonomic composition and relative abundance of the most abundant ASVs found in the gout groups
Fig. 5
Fig. 5
Protein–protein interaction analysis predicted by STRING. Nodes are colored based on their specific role: purine biosynthesis (red), one-carbon metabolism (blue), nucleotide-binding (yellow), ligases (pink), and amino acid biosynthesis (green). Proteins involved in multiple functions are filled with various colors. Thicker lines define the most robust associations. a Bacteroides caccae showed significant enrichment of proteins strongly involved in purine metabolism. b Bacteroides stercoris ATCC 43183, displayed functional categories included purine biosynthesis, one-carbon metabolism, nucleotide-binding, and amino-acid biosynthesis. c For Bacteroides coproccola DSM 17136 and Bacteroides stercoris ATCC 43183 we identified protein–protein interaction in enzymes involved in one-carbon metabolism, purine biosynthesis, as well as methyltransferases, transferases, and ligases
Fig. 6
Fig. 6
Stacked column bar graph representing the predicted metabolic characteristics that differentiate between a tophaceous gout patients vs. healthy controls, b gout patients vs. healthy controls, and c tophaceous gout patients vs. gout patients. Differences were considered significant at p-value < 0.05 using Welch’s t-test

Similar articles

Cited by

References

    1. Alvarez-Lario B, Macarron-Vicente J. Uric acid and evolution. Rheumatology. 2010;49(11):2010–2015. doi: 10.1093/rheumatology/keq204. - DOI - PubMed
    1. Amir A, McDonald D, Navas-Molina JA, Debelius J, Morton JT, Hyde E, et al. Correcting for microbial blooms in fecal samples during room-temperature shipping. mSystems. 2017;2:2. - PMC - PubMed
    1. Andersen KS, Kirkegaard RH, Karst SM, Albertsen M. ampvis2: an R package to analyse and visualise 16S rRNA amplicon data. bioRxiv; 2018. https://madsalbertsen.github.io/ampvis2/index.html
    1. Astudillo-García C, Bell JJ, Webster NS, Glasl B, Jompa J, Montoya JM, et al. Evaluating the core microbiota in complex communities: a systematic investigation. Environ Microbiol. 2017;19(4):1450–1462. doi: 10.1111/1462-2920.13647. - DOI - PubMed
    1. Bobulescu IA, Moe OW. Renal transport of uric acid: evolving concepts and uncertainties. Adv Chronic Kidney Dis. 2012;19(6):358–371. doi: 10.1053/j.ackd.2012.07.009. - DOI - PMC - PubMed

Publication types