. 2021 May 24;12(6):532.
doi: 10.1038/s41419-021-03814-5.

Epigenetic regulation of intestinal peptide transporter PEPT1 as a potential strategy for colorectal cancer sensitization

Affiliations

Epigenetic regulation of intestinal peptide transporter PEPT1 as a potential strategy for colorectal cancer sensitization

Yanhong Wang et al. Cell Death Dis. .

Abstract

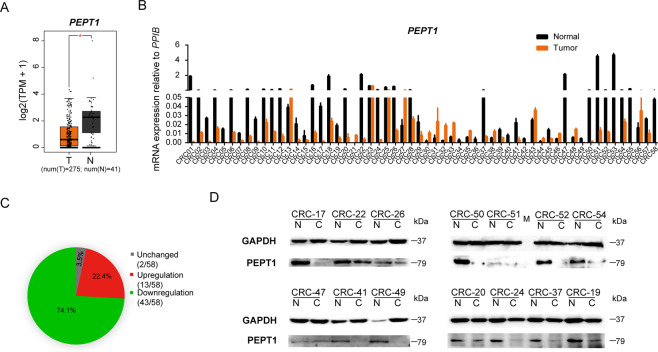
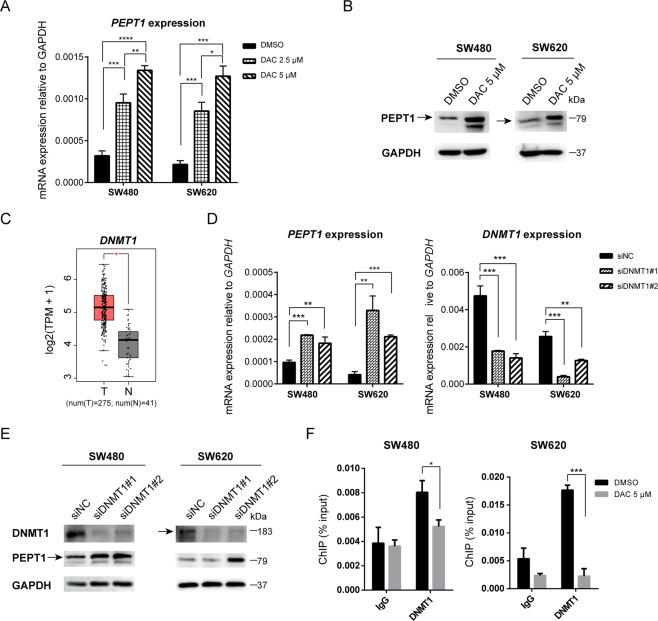
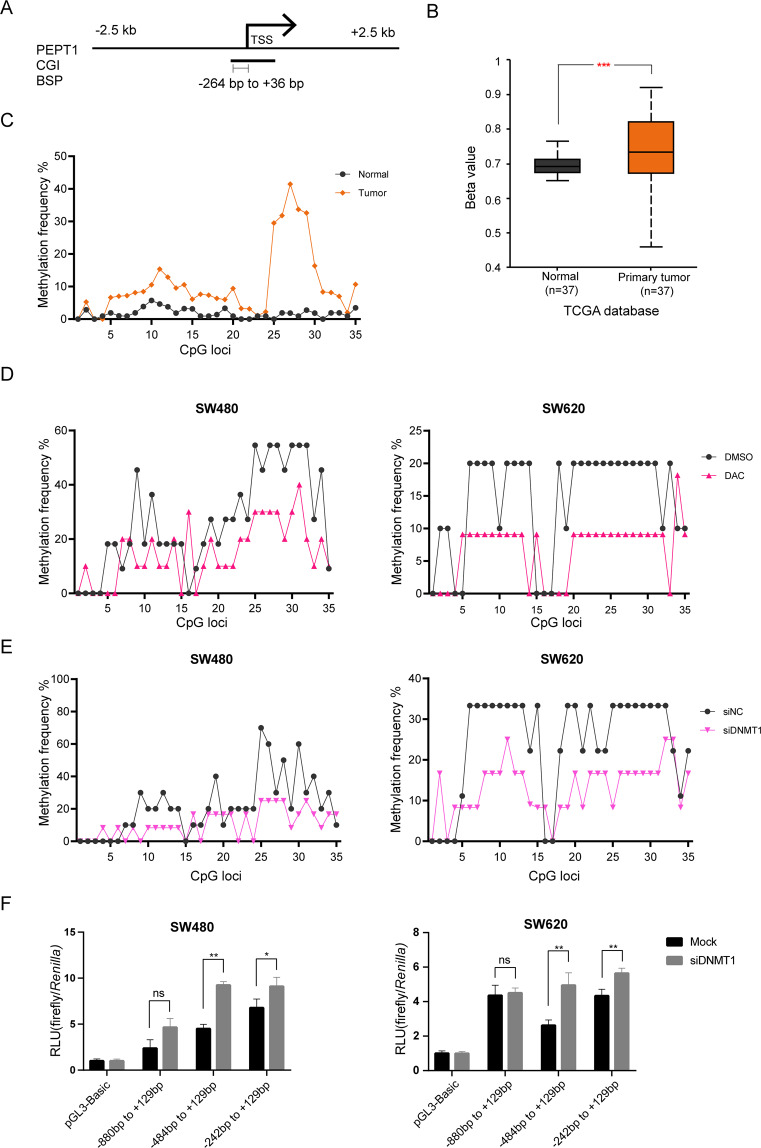
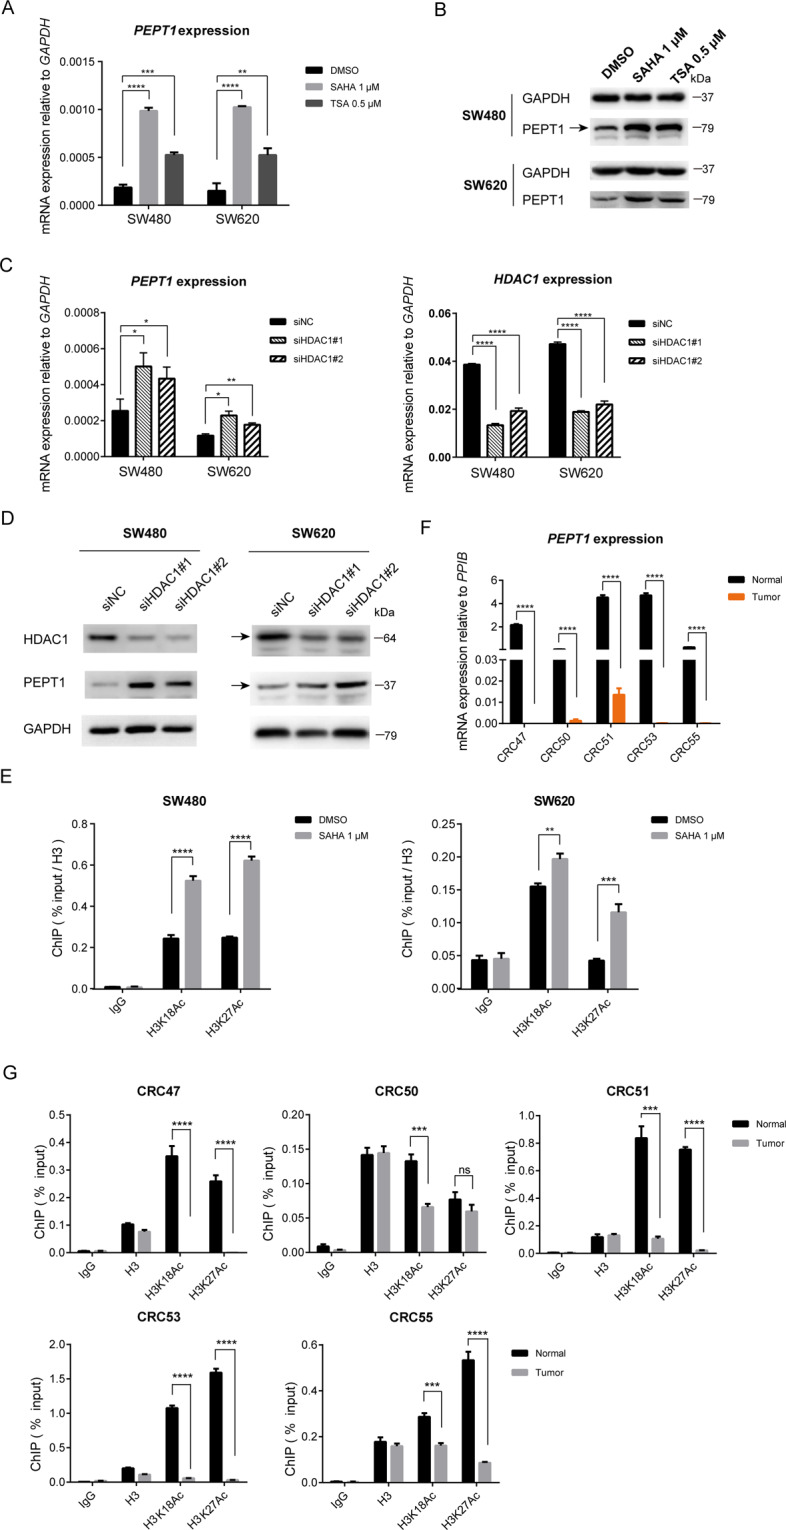
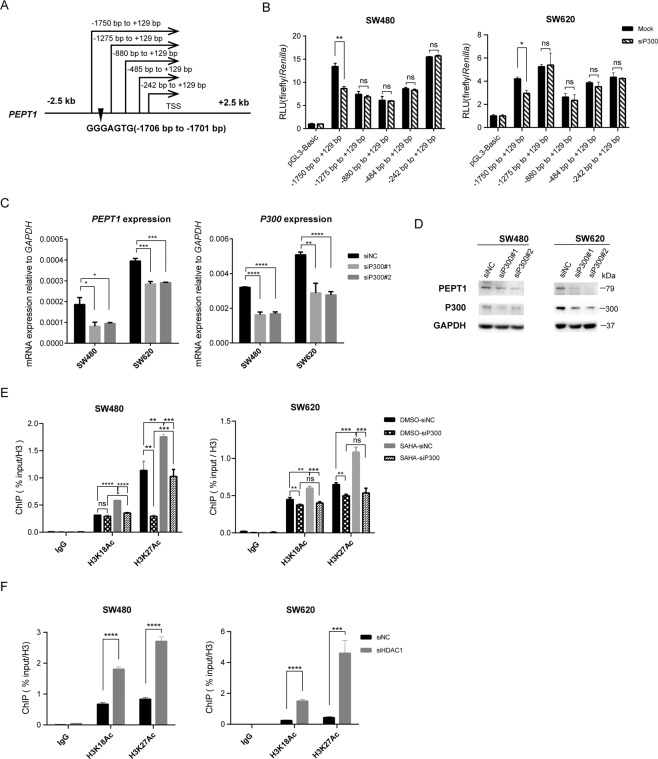
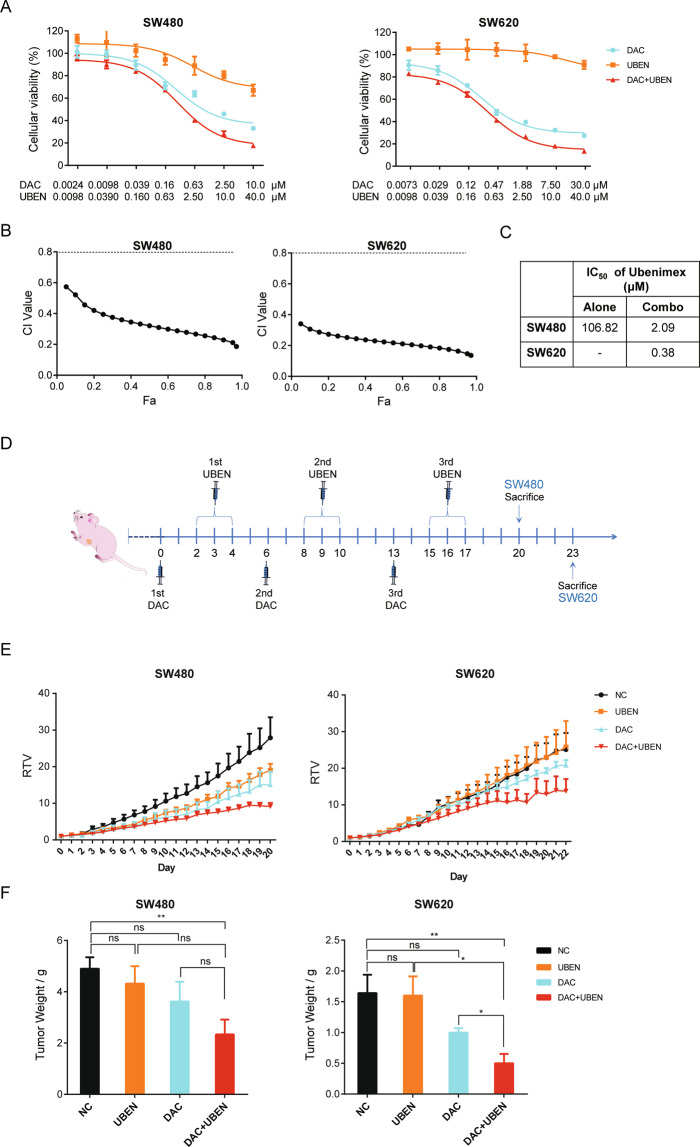
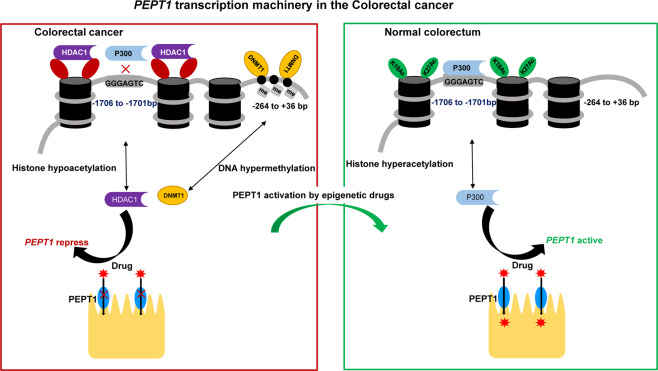
Human intestinal peptide transporter PEPT1 is commonly repressed in human colorectal cancer (CRC), yet its relationship with sensitivity to the common CRC treatment ubenimex has not previously been elucidated. In this study, we confirmed PEPT1 suppression in CRC using real-time quantitative polymerase chain reaction and western blotting and then investigated the underlying epigenetic pathways involved using bisulfite sequencing, chromatin immunoprecipitation, siRNA knockdown, and reporter gene assays. We found that PEPT1 transcriptional repression was due to both DNMT1-mediated DNA methylation of the proximal promoter region and HDAC1-mediated histone deacetylation, which blocked P300-mediated H3K18/27Ac at the PEPT1 distal promoter. Finally, the effects of the epigenetic activation of PEPT1 on the CRC response to ubenimex were evaluated using sequential combination therapy of decitabine and ubenimex both in vitro and in xenografts. In conclusion, epigenetic silencing of PEPT1 due to increased DNMT1 and HDAC1 expression plays a vital role in the poor response of CRC to ubenimex.


Conflict of interest statement

The authors declare no competing interests.

Figures

Fig. 1
Fig. 1. The mRNA and protein expression levels of PEPT1 are frequently downregulated in CRC.
A PEPT1 expression data were provided by TCGA in GEPIA. Box plots showed PEPT1 mRNA expression in CRC tumor tissues (T) and normal tissues (N). *P < 0.05, one-tailed unpaired t-test. B The mRNA expression of PEPT1 was detected in 58 pairs of CRC and corresponding adjacent non-tumorous tissues by RT-qPCR. Data are shown as means ± SD, n = 58. C The fold change log2(T/N) of PEPT1 expression between 58 pairs of CRC and adjacent normal tissues were summarized. <−1 is downregulation, −1 to 1 is unchanged and >1 is upregulation. D Representative images of western blotting analysis for the expression of PEPT1 in 14 paired samples of CRC. GAPDH was used as a loading control.
Fig. 2
Fig. 2. The inhibition of DNMT1 increases PEPT1 in CRC.
A The mRNA expression of PEPT1 in SW480 and SW620 cells. Cells were treated with DMSO, 2.5 μM DAC, or 5 μM DAC for 72 h. Data are shown as means ± SD, n = 3, two-tailed unpaired t-test, *P < 0.05, **P < 0.01, ***P < 0.001, ****P < 0.0001, significantly different from DMSO. B Immunoblotting confirmed DAC treatment in SW480 and SW620 cells. C DNMT1 mRNA levels in CRC tumors (T) and normal tissues (N) from the TCGA in GEPIA. *P < 0.05, one-tailed unpaired t-test. D Knockdown of DNMT1 activated PEPT1 mRNA expression in SW480 and SW620 cells, respectively. SiNC, cells transfected with negative control siRNA, siDNMT1#1, siDNMT1#2, two siRNAs for DNMT1. Data are shown as means ± SD, n = 3, two-tailed unpaired t-test, **P < 0.01, ***P < 0.001. E PEPT1 and DNMT1 protein expression after DNMT1 knockdown in SW480 and SW620 cells. F ChIP-qPCR analyses of DNMT1 enrichment at the proximal promoter of PEPT1 in SW480 and SW620 cells after DAC (5 μM for 72 h) treatment. Data are shown as means ± SD, two-tailed unpaired t-test, *P < 0.05, ***P < 0.001.
Fig. 3
Fig. 3. Repression of PEPT1 expression via DNMT1 mediated DNA hypermethylation.
A PEPT1 promoter region (±2.5 kb) around 5’ regions adjacent to the TSS. CGI, CpG islands. BSP, bisulfite-sequencing PCR. B DNA methylation data of PEPT1 promoter in cancerous and adjacent non-tumorous tissues from the TCGA database (***P < 0.001). C BSP analysis of PEPT1 CGI in cancerous and adjacent non-tumorous tissues (n = 11). Methylation percentages of the 35 CpG loci in the sequenced region were calculated. 11 pairs of CRC tissues belong to tissues in Fig. 1B (CRC17, 19, 22, 26, 41, 47, 49, 50, 51, 52, 54). The y axis indicates the average methylation percentage of each CpG site calculated from patient tissues with PEPT1 repression. DE Calculation of methylation percentages of PEPT1 promoter after DAC and siDNMT1 treatment in CRC cells. F Luciferase assay in DNMT1 knockdown CRC cells. Mock, cells transfected with negative control siRNA and PEPT1 promoter constructs. Si-DNMT1, cells transfected with siDNMT1#2 and PEPT1 promoter constructs. Data are shown as means ± SD, two-tailed unpaired t-test, *P < 0.05, **P < 0.01.
Fig. 4
Fig. 4. Histone hypoacetylation around PEPT1 promoter in CRC.
A The mRNA expression of PEPT1 in SW480 and SW620 cells after HDAC inhibitors treatment. Cells were treated with DMSO, 1 μM SAHA for 48 h or 0.5 μM TSA for 24 h. Data are shown as means ± SD, n = 3, two-tailed unpaired t-test, ns, no significance, **P < 0.01, ***P < 0.001, ****P < 0.0001. B Immunoblotting confirmed HDAC inhibitors treatment in SW480 and SW620 cells. CD Knockdown of HDAC1 activated PEPT1 mRNA and protein expression in SW480 and SW620 cells, respectively. SiNC, cells transfected with negative control siRNA, siHDAC1#1, siHDAC1#2, two siRNAs for HDAC1. Data are shown as means ± SD, n = 3, two-tailed unpaired t-test, *P < 0.05, **P < 0.01, ****P < 0.0001. E ChIP-qPCR analyses of H3K18/H3K27Ac occupancy at PEPT1 promoter in SW480 and SW620 cells after SAHA (1 μM for 48 h) treatment. Data are shown as means ± SD, two-tailed unpaired t-test, **P < 0.01, ***P < 0.001, ****P < 0.0001. F PEPT1 mRNA expression in CRC47, 50, 51, 53, 55. Data are shown as means ± SD, two-tailed paired t-test, **P < 0.01, ***P < 0.001. G ChIP-qPCR analyses of H3K18/K27Ac occupancy at the PEPT1 promoter in five paired CRC tissues. Data are shown as means ± SD, two-tailed unpaired t-test, ***P < 0.001, ****P < 0.0001.
Fig. 5
Fig. 5. PEPT1 repression via HDAC1-CBP/P300 axis.
A Promoter constructs of PEPT1 in the luciferase assay. GGGAGTG, a consensus DNA binding sequence for p300. B Luciferase assay in P300 knockdown CRC cells. Mock cells transfected with negative control siRNA and promoter constructs. Si-P300, cells transfected with siP300#2 and promoter constructs. Data are shown as means ± SD, n = 3, two-tailed unpaired t-test, ns, no significance, *P < 0.05, **P < 0.01. CD Inhibition of P300 downregulated PEPT1. SiNC, cells transfected with negative control siRNA, siP300#1, siP300#2, two siRNAs for P300. Data are shown as means ± SD, n = 3, two-tailed unpaired t-test, *P < 0.05, **P < 0.01, ***P < 0.001, ****P < 0.0001. E ChIP-qPCR analysis showed the effect of P300 expression on H3K18/K27Ac occupancy at the PEPT1 promoter. Cells were treated with DMSO or 1 μM SAHA for 48 h. SiNC, cells transfected with negative control siRNA, siP300, cells transfected with siP300#2. Data are shown as means ± SD, two-tailed unpaired t-test, ns, no significance, **P < 0.01, ***P < 0.001, ****P < 0.0001. F ChIP-qPCR analysis showed the effect of HDAC1 expression on H3K18/K27Ac occupancy at the PEPT1 promoter. SiNC, cells transfected with negative control siRNA, siHDAC1, cells transfected with siHDAC1#2. Data are shown as means±SD, two-tailed unpaired t-test, ***P < 0.001, ****P < 0.0001.
Fig. 6
Fig. 6. Activation of PEPT1 promotes the antitumor effects of UBEN in CRC.
A Dose-effect curves of DAC, UBEN, and combination (DAC + UBEN) treatment in SW480 and SW620 cells. Cells were treated as indicated in Supplemental Table S2 and were subsequently analyzed using CCK8 assay. Data are shown as means ± SD, n = 6, nonlinear regression (curve fit) analysis. B Combination index (CI)–fraction affected (Fa) plots of DAC and UBEN combination were calculated by CompuSyn software in CRC cells. CI value is defined as follows: <0.8 is synergistic effect, from 0.8 to 1.2 is additive effect and >1.2 is antagonistic effect. C IC50 values of UBEN in CRC cells receiving combination treatment compared with UBEN alone. D Drug administration timeline and dosing schedule for xenograft models of CRC cells. E Relative tumor volume (RTV) curves in SW480 and SW620 xenograft models. Data represent the mean ± SD (n = 5). NC, UBEN, DAC, and DAC + UNEN indicate mice treated with sterile saline, ubenimex alone, decitabine alone, and decitabine-ubenimex combination, respectively. F Tumor weight of mice bearing SW480 and SW620 xenografts. Data represent means ± SD (n = 5), two-tailed unpaired t-test, ns, no significance, *P < 0.05, **P < 0.01.
Fig. 7
Fig. 7. PEPT1 transcription machinery in Colorectal cancer.
A hypomethylated CpG island at the proximal promoter and occupancy of H3K18/27Ac at distal promoters leads to transcriptional activation of PEPT1 in the normal colorectum. P300, but not CBP, is mainly responsible for H3K18/27ac around PEPT1 promoter and the element GGGAGTG (−1706 to 1701 bp) at PEPT1 promoter contributed to the basic transcription of PEPT1. Furthermore, the repressive PEPT1 promoter in CRC is characterized by a hypermethylated CpG island at the proximal promoter mediated by DNMT1 and the absence of H3K18/27Ac around the distal promoter due to HDAC1. The red star represents the dipeptide anti-cancer drug.

Similar articles

Cited by

References

    1. Sung, H. et al. Global cancer statistics 2020: GLOBOCAN estimates of incidence and mortality worldwide for 36 cancers in 185 countries. Cancer J. Clin. caac.21660 10.3322/caac.21660 (2021). - PubMed
    1. Dekker E, Tanis PJ, Vleugels JLA, Kasi PM, Wallace MB. Colorectal cancer. Lancet. 2019;394:1467–1480. doi: 10.1016/S0140-6736(19)32319-0. - DOI - PubMed
    1. Li W, et al. Overcoming ABC transporter-mediated multidrug resistance: molecular mechanisms and novel therapeutic drug strategies. Drug Resist. Updat. 2016;27:14–29. doi: 10.1016/j.drup.2016.05.001. - DOI - PubMed
    1. Liu Y, et al. Epigenetic activation of the drug transporter OCT2 sensitizes renal cell carcinoma to oxaliplatin. Sci. Transl. Med. 2016;8:348ra97–348ra97. doi: 10.1126/scitranslmed.aaf3124. - DOI - PubMed
    1. Ye C, et al. Inhibition of histone deacetylase 7 reverses concentrative nucleoside transporter 2 repression in colorectal cancer by up-regulating histone acetylation state: CNT2 repression in colorectal cancer. Br. J. Pharmacol. 2018;175:4209–4217. doi: 10.1111/bph.14467. - DOI - PMC - PubMed

Publication types

MeSH terms