

Multimodal prognosis of negative symptom severity in individuals at increased risk of developing psychosis
- PMID: 34031362
- PMCID: PMC8144430
- DOI: 10.1038/s41398-021-01409-4
Multimodal prognosis of negative symptom severity in individuals at increased risk of developing psychosis
Abstract
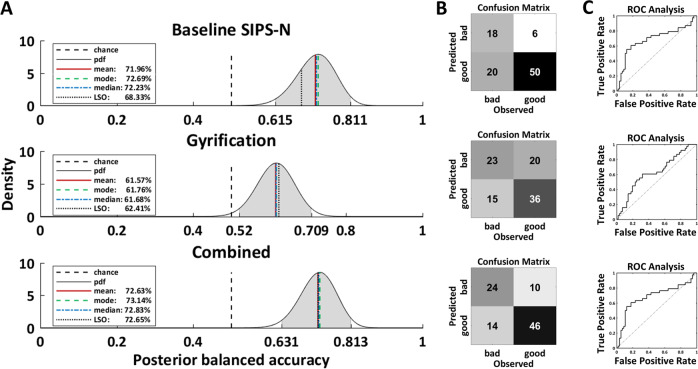
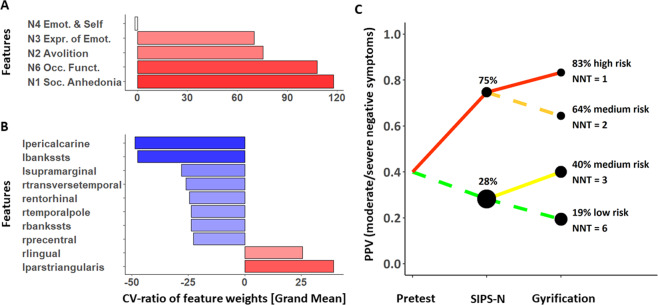
Negative symptoms occur frequently in individuals at clinical high risk (CHR) for psychosis and contribute to functional impairments. The aim of this study was to predict negative symptom severity in CHR after 9 months. Predictive models either included baseline negative symptoms measured with the Structured Interview for Psychosis-Risk Syndromes (SIPS-N), whole-brain gyrification, or both to forecast negative symptoms of at least moderate severity in 94 CHR. We also conducted sequential risk stratification to stratify CHR into different risk groups based on the SIPS-N and gyrification model. Additionally, we assessed the models' ability to predict functional outcomes in CHR and their transdiagnostic generalizability to predict negative symptoms in 96 patients with recent-onset psychosis (ROP) and 97 patients with recent-onset depression (ROD). Baseline SIPS-N and gyrification predicted moderate/severe negative symptoms with significant balanced accuracies of 68 and 62%, while the combined model achieved 73% accuracy. Sequential risk stratification stratified CHR into a high (83%), medium (40-64%), and low (19%) risk group regarding their risk of having moderate/severe negative symptoms at 9 months follow-up. The baseline SIPS-N model was also able to predict social (61%), but not role functioning (59%) at above-chance accuracies, whereas the gyrification model achieved significant accuracies in predicting both social (76%) and role (74%) functioning in CHR. Finally, only the baseline SIPS-N model showed transdiagnostic generalization to ROP (63%). This study delivers a multimodal prognostic model to identify those CHR with a clinically relevant negative symptom severity and functional impairments, potentially requiring further therapeutic consideration.
Conflict of interest statement
This work was funded by the European Union under the 7th Framework Programme (grant number 602152). D.J.H.’s work was supported by the Swiss National Science Foundation (Ambizione grant; grant number 167952). J.R.’s work was supported by Miguel Servet Research Contract (CPII19/00009) and Research Projects PI19/00394 from the Plan Nacional de I + D + i, the Instituto de Salud Carlos III-Subdirección General de Evaluación y Fomento de la Investigación and the European Regional Development Fund (FEDER, ‘Investing in your future’). R.S. received honoraria for one lecture from Lundbeck outside the submitted work and funding from BMBF and the Max Planck Society. C.P. has received honoraria for talks at educational meetings and has served on an advisory board for Lundbeck, Australia Pty Ltd, and was supported by a National Health and Medical Research Council (NHMRC) Senior Principal Research Fellowship (1105825), an NHMRC L3 Investigator Grant (1196508), and NHMRC-EU Grant (ID: 1075379). The remaining authors declare no competing interests.
Figures
References
-
- Meyer EC, et al. The relationship of neurocognition and negative symptoms to social and role functioning over time in individuals at clinical high risk in the first phase of the North American Prodrome Longitudinal Study. Schizophr. Bull. 2014;40:1452–1461. doi: 10.1093/schbul/sbt235. - DOI - PMC - PubMed
Publication types
MeSH terms
LinkOut - more resources
Full Text Sources
Other Literature Sources
Medical
