. 2021 May 25;9(1):27.
doi: 10.1038/s41413-021-00145-1.

The KDM4B-CCAR1-MED1 axis is a critical regulator of osteoclast differentiation and bone homeostasis

Affiliations

The KDM4B-CCAR1-MED1 axis is a critical regulator of osteoclast differentiation and bone homeostasis

Sun-Ju Yi et al. Bone Res. .

Abstract

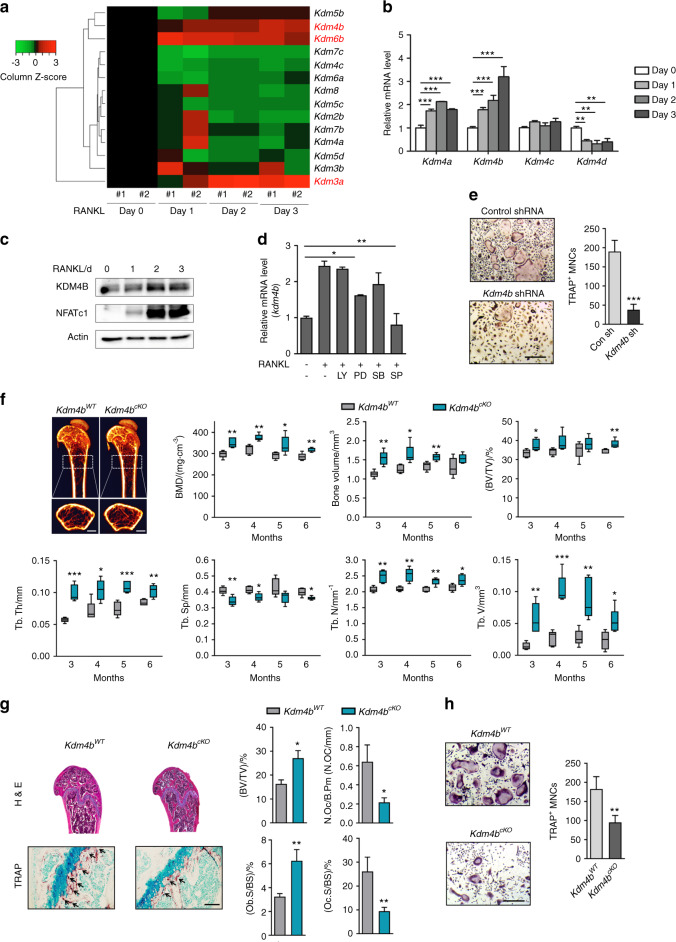
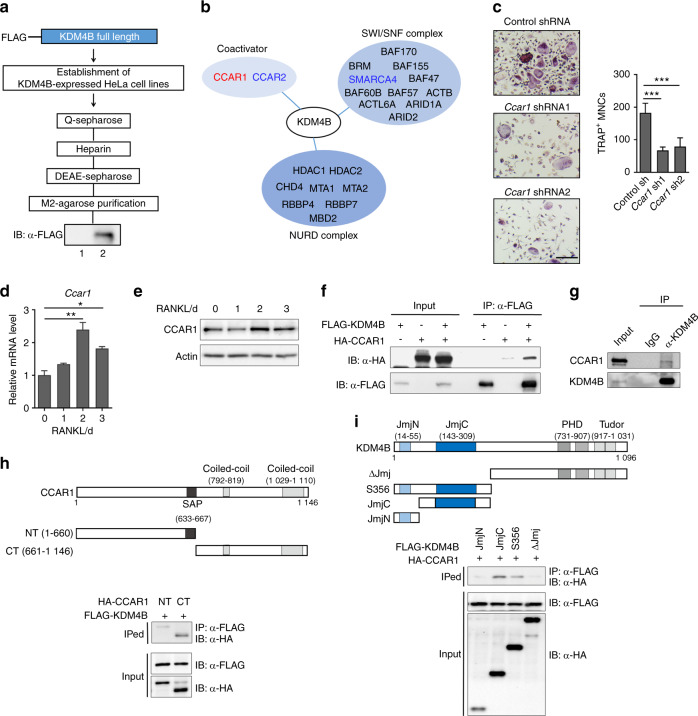
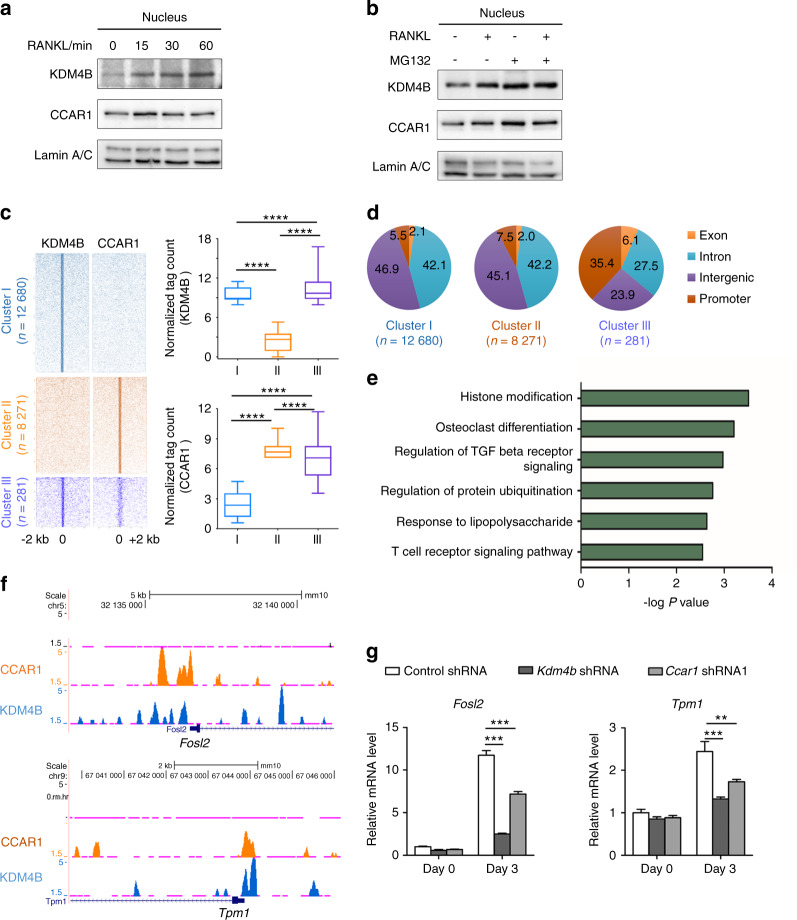
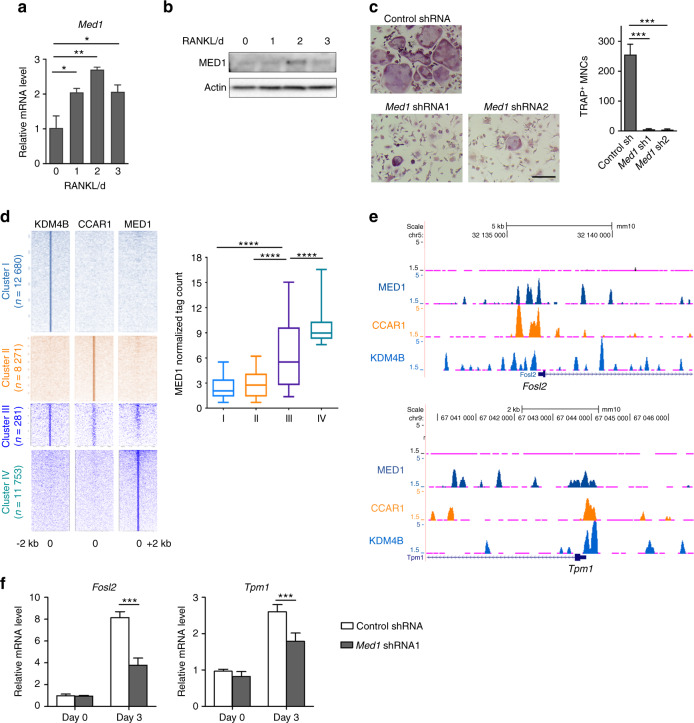
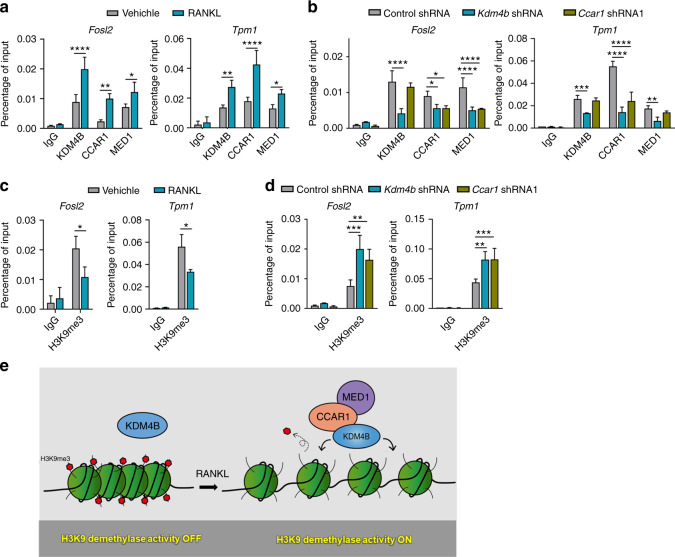
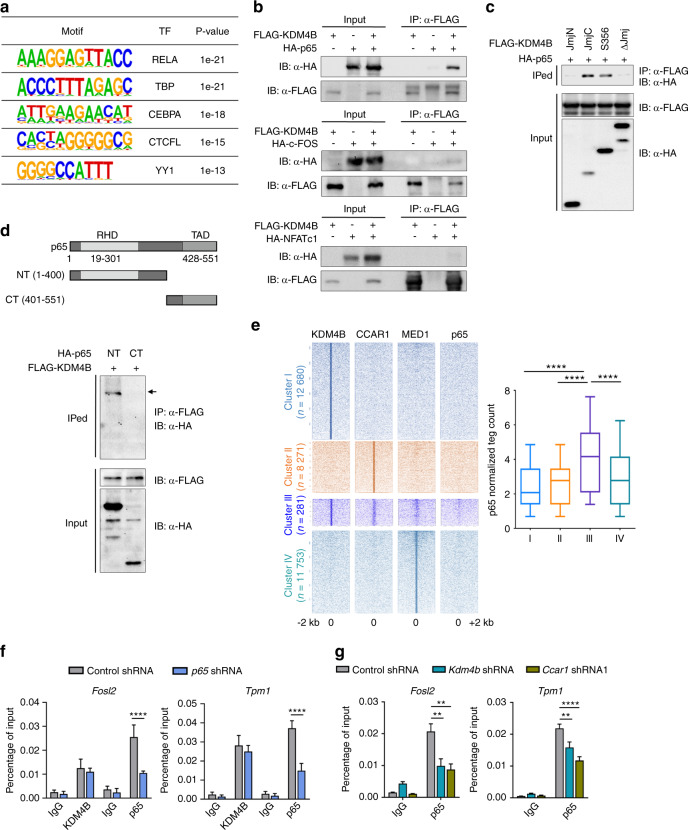
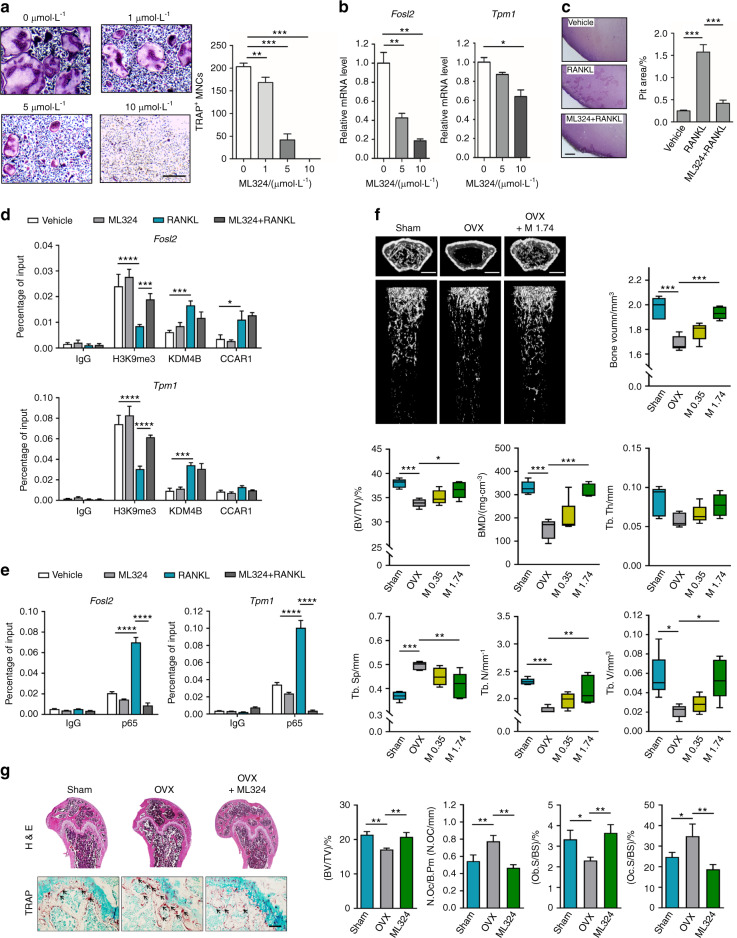
Bone undergoes a constant and continuous remodeling process that is tightly regulated by the coordinated and sequential actions of bone-resorbing osteoclasts and bone-forming osteoblasts. Recent studies have shown that histone demethylases are implicated in osteoblastogenesis; however, little is known about the role of histone demethylases in osteoclast formation. Here, we identified KDM4B as an epigenetic regulator of osteoclast differentiation. Knockdown of KDM4B significantly blocked the formation of tartrate-resistant acid phosphatase-positive multinucleated cells. Mice with myeloid-specific conditional knockout of KDM4B showed an osteopetrotic phenotype due to osteoclast deficiency. Biochemical analysis revealed that KDM4B physically and functionally associates with CCAR1 and MED1 in a complex. Using genome-wide chromatin immunoprecipitation (ChIP)-sequencing, we revealed that the KDM4B-CCAR1-MED1 complex is localized to the promoters of several osteoclast-related genes upon receptor activator of NF-κB ligand stimulation. We demonstrated that the KDM4B-CCAR1-MED1 signaling axis induces changes in chromatin structure (euchromatinization) near the promoters of osteoclast-related genes through H3K9 demethylation, leading to NF-κB p65 recruitment via a direct interaction between KDM4B and p65. Finally, small molecule inhibition of KDM4B activity impeded bone loss in an ovariectomized mouse model. Taken together, our findings establish KDM4B as a critical regulator of osteoclastogenesis, providing a potential therapeutic target for osteoporosis.


Conflict of interest statement

The authors declare no competing interests.

Figures

Fig. 1
Fig. 1
Myeloid-specific loss of KDM4B increases bone mass and reduces osteoclast activity in vivo. a Heatmap showing mRNA expression profiles of histone demethylases during osteoclastogenesis. b Relative mRNA levels of Kdm4aKdm4d during osteoclast differentiation. The mRNA levels of each reaction were normalized to the mRNA level of the β–actin control. c Immunoblot analysis of KDM4B expression levels during osteoclastogenesis. d Effects of protein kinase inhibitors on the mRNA expression of Kdm4b (LY, LY294002; PD, PD98059; SB, SB203580; SP, SP600125). e TRAP staining of BMMs expressing either control shRNA or Kdm4b shRNA. Scale bar, 75 μm. f Micro-CT analysis of the femurs of 3-month-old male Kdm4bWT and Kdm4bcKO mice (n = 5). Representative micro-CT image of the proximal femur (top, longitudinal view; bottom, axial view). The boxes enclose the 25th to 75th percentile values. The whiskers extend to the maximum and minimum values. The central horizontal bar indicates the median. Scale bars, 1 mm. g Histological analysis of femur sections from 3-month-old male Kdm4bWT and Kdm4bcKO mice (n = 3). The sections were stained for H&E and TRAP. The arrows indicate osteoclasts. Scale bar, 100 μm. h TRAP staining of BMMs from Kdm4bWT and Kdm4bcKO mice. Scale bar, 75 μm. The data are presented as the mean ± SD values of three independent experiments [two-way ANOVA in (b), one-way ANOVA in (d), two-tailed t-test in (e, h)]. In (f, g), the data are presented as the mean ± SEM values. *P < 0.05; **P < 0.01; ***P < 0.001. See also Supplementary Fig. 1
Fig. 2
Fig. 2
KDM4B associates with CCAR1. a Schematic diagram of the method used to purify the KDM4B-interacting complex from FLAG-KDM4B-expressing cells. Lane 1, control preparation from the nuclear extract of normal HeLa cells; lane 2, KDM4B-interacting complex from the nuclear extract of KDM4B-expressing HeLa cells. b KDM4B-interacting complexes. c TRAP staining of BMMs expressing either control shRNA or Ccar11 shRNA1. Scale bar, 75 μm. d, e CCAR1 expression during osteoclast differentiation. qRT-PCR (d) and immunoblot (e) results. f Coimmunoprecipitation of FLAG-KDM4B and HA-CCAR1. g Endogenous interaction of KDM4B and CCAR1 in BMMs. h, i Mapping the binding domain of KDM4B and CCAR1. JmjN N-terminal jumonji domain, JmjC jumonji C-terminal domain, PHD plant homeodomain finger domain, Tudor Tudor domain. SAP, SAF-A/B, Acinus, and PIAS DNA/RNA binding motif. The data are presented as the mean ± SD values of three independent experiments [one-way ANOVA in (c, d)]. *P < 0.05; **P < 0.01; ***P < 0.001. See also Supplementary Fig. 2
Fig. 3
Fig. 3
KDM4B and CCAR1 are colocalized near TSSs and enhance the gene expression of a set of osteoclast-related genes. a Immunoblots of nuclear fractions of BMMs after RANKL treatment. b KDM4B stabilization by RANKL or MG132. c Heatmap of normalized tag densities on KDM4B and CCAR1 peaks (left panels). Quantifications of tag counts are shown in the box plots (right panels). The boxes enclose the 25th to 75th percentile values. The whiskers extend to the 10th and 90th percentiles. The central horizontal bar indicates the median. ****P < 0.000 1 (Kolmogorov–Smirnov test). d Genomic locations of binding sites within each cluster are expressed as percentages of the total binding sites. e Gene Ontology (GO) enrichment analysis of Cluster III. f Representative UCSC Genome Browser tracks showing co-occupancy of KDM4B and CCAR1 at Fosl2 and Tpm1. g mRNA expression levels of Fosl2 and Tpm1 in cells expressing control shRNA, Kdm4b shRNA, or Ccar1 shRNA1. The data are presented as the mean ± SD of three independent experiments (two-way ANOVA). **P < 0.01; ***P < 0.001. See also Supplementary Fig. 3
Fig. 4
Fig. 4
The KDM4B–CCAR1–MED1 axis is required for osteoclastogenesis. a, b MED1 expression during osteoclast differentiation. qRT-PCR (a) and immunoblot (b) results. c TRAP staining of BMMs expressing either control shRNA or Med1 shRNA. Scale bar, 75 μm. d Heatmap of normalized tag densities on KDM4B, CCAR1, and MED1 peaks (2 kb up/downstream of the peak centers) (left panels). Quantifications of MED1 tag counts are shown in the box plots (right panel). The boxes enclose the 25th to 75th percentile values. The whiskers extend to the 10th and 90th percentiles. The central horizontal bar indicates the median. ****P < 0.000 1 (Kolmogorov–Smirnov test). e Representative UCSC Genome Browser tracks showing co-occupancy of KDM4B, CCAR1, and MED1 at Fosl2 and Tpm1. f mRNA expression levels of Fosl2 and Tpm1 in cells expressing control shRNA or Med1 shRNA. The data are presented as the mean ± SD values of three independent experiments [one-way ANOVA in (a, c)]. *P < 0.05; **P < 0.01; ***P < 0.001. See also Supplementary Fig. 4
Fig. 5
Fig. 5
KDM4B-dependent recruitment of CCAR1 and MED1. a ChIP-qPCR of KDM4B, CCAR1, and MED1 enrichment upon RANKL treatment (100 ng·mL−1, 30 min) at the Fosl2 (−1.1 kb) and Tpm1 (−0.6 kb) promoters. b ChIP assays of KDM4B, CCAR1, and MED1 localization at target genes in cells depleted of KDM4B or CCAR1 upon RANKL signaling (100 ng·mL−1, 30 min). c ChIP-qPCR of H3K9me3 in the Fosl2 and Tpm1 promoters in the cells evaluated in (a). d ChIP assays of H3K9me3 status in the cells evaluated in (b) upon RANKL signaling. e Schematic representation of the cooperative function of KDM4B, CCAR1, and MED1 in regulating H3K9 demethylation. The data are presented as the mean ± SD values of three independent experiments [two-way ANOVA in (ad)]. **P < 0.01; ***P < 0.001. See also Supplementary Fig. 5
Fig. 6
Fig. 6
Association of p65 and KDM4B is critical for osteoclastogenesis. a The most significantly enriched transcription factor (TF) motifs at KDM4B binding regions, as identified by de novo motif analysis using HOMER. b KDM4B interaction with p65. c, d Mapping the binding domain of KDM4B and p65. RHD Rel homology domain, TAD transactivation domain. e Heatmap of normalized tag densities on KDM4B, CCAR1, MED1, and p65 peaks (left panels). Quantifications of p65 tag counts are shown in the box plots (right panel). The boxes enclose the 25th to 75th percentile values. The whiskers extend to the 10th and 90th percentiles. The central horizontal bar indicates the median. ****P < 0.000 1 (Kolmogorov–Smirnov test). f ChIP assay of KDM4B occupancy at the Fosl2 or Tpm1 promoter in p65-depleted cells. g ChIP assay of p65 occupancy at the Fosl2 or Tpm1 promoter in KDM4B- or CCAR1-depleted cells. The data are presented as the mean ± SD values of three independent experiments [two-way ANOVA in (f, g)]. **P < 0.01; ***P < 0.001. See also Supplementary Fig. 6
Fig. 7
Fig. 7
Administration of KDM4B inhibitors ameliorates bone loss in the ovariectomized (OVX) mouse model. a TRAP staining of BMMs treated with ML324. Scale bar, 75 μm. b mRNA expression levels of Fosl2 and Tpm1 in the cells evaluated in (a). c BMMs were treated with vehicle or 10 μmol·L−1 ML324 in the presence or absence of RANKL (100 ng·mL−1) for 10 days. The dentin slices were stained with Mayer’s hematoxylin, the resorption pit area was analyzed. Scale bar, 200 μm. d, e ChIP assay of H3K9me3, KDM4B, CCAR1, and p65 occupancy at the Fosl2 promoter or Tpm1 promoter in BMMs treated with ML324 (10 μmol·L−1) and/or RANKL for 30 min. f Micro-CT analysis of the femurs of 4-month-old sham-operated, saline-treated (Sham), saline-treated OVX (OVX), and ML324-treated OVX (OVX + M 1.74) mice (n = 5). Left panel, representative micro-CT image of a proximal femur (top, axial view; bottom, longitudinal view). Right panel, bone parameters. M 0.35, 0.35 mg·kg−1 body weight; M 1.74, 1.74 mg·kg−1 body weight. Scale bars, 1 mm. g Histological analysis of femur sections from the mice evaluated in (f) (n = 3). ML324, 1.74 mg·kg−1 body weight. The sections were stained for H&E and TRAP. The arrows indicate osteoclasts. Scale bars, 100 μm. The data are presented as the mean ± SD values of three independent experiments [one-way ANOVA in (ac) and two-way ANOVA in (d, e)]. The data in (f, g) are presented as the mean ± SEM values (one-way ANOVA). *P < 0.05; **P < 0.01; ***P < 0.001. See also Supplementary Figs. 7 and 8

Similar articles

Cited by

References

    1. Florencio-Silva R, Sasso GR, Sasso-Cerri E, Simoes MJ, Cerri PS. Biology of bone tissue: structure, function, and factors that influence bone cells. BioMed Res. Int. 2015;2015:421746. doi: 10.1155/2015/421746. - DOI - PMC - PubMed
    1. Sobacchi C, Schulz A, Coxon FP, Villa A, Helfrich MH. Osteopetrosis: genetics, treatment and new insights into osteoclast function. Nat. Rev. Endocrinol. 2013;9:522–536. doi: 10.1038/nrendo.2013.137. - DOI - PubMed
    1. Han Y, You X, Xing W, Zhang Z, Zou W. Paracrine and endocrine actions of bone-the functions of secretory proteins from osteoblasts, osteocytes, and osteoclasts. Bone Res. 2018;6:16. doi: 10.1038/s41413-018-0019-6. - DOI - PMC - PubMed
    1. Boyce BF, et al. Roles for NF-kappa B and c-Fos in osteoclasts. J. Bone Min. Metab. 2005;23:11–15. doi: 10.1007/BF03026317. - DOI - PubMed
    1. Kim JH, Kim N. Regulation of NFATc1 in osteoclast differentiation. J. Bone Metab. 2014;21:233–241. doi: 10.11005/jbm.2014.21.4.233. - DOI - PMC - PubMed