. 2021 May 24;12(1):3074.
doi: 10.1038/s41467-021-23245-2.

Clump sequencing exposes the spatial expression programs of intestinal secretory cells

Affiliations

Clump sequencing exposes the spatial expression programs of intestinal secretory cells

Rita Manco et al. Nat Commun. .

Abstract

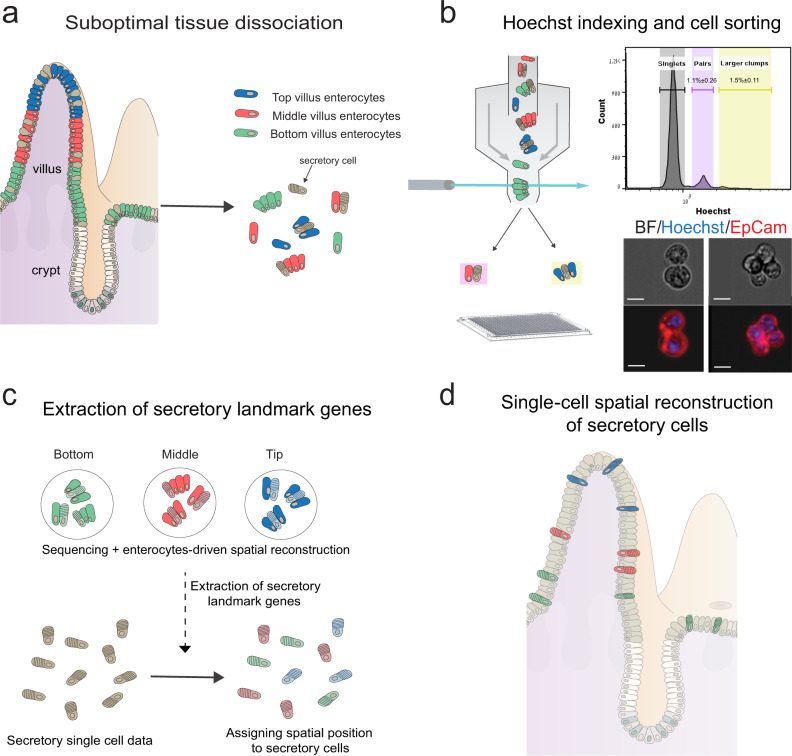
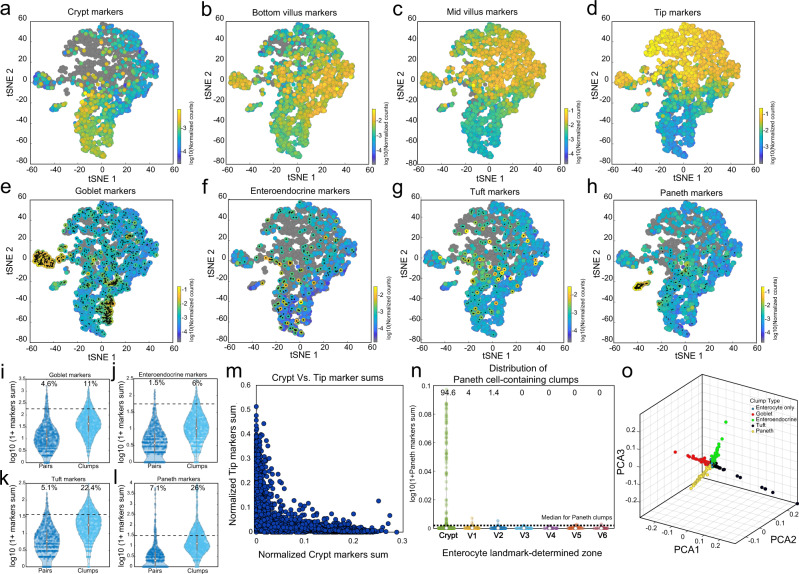
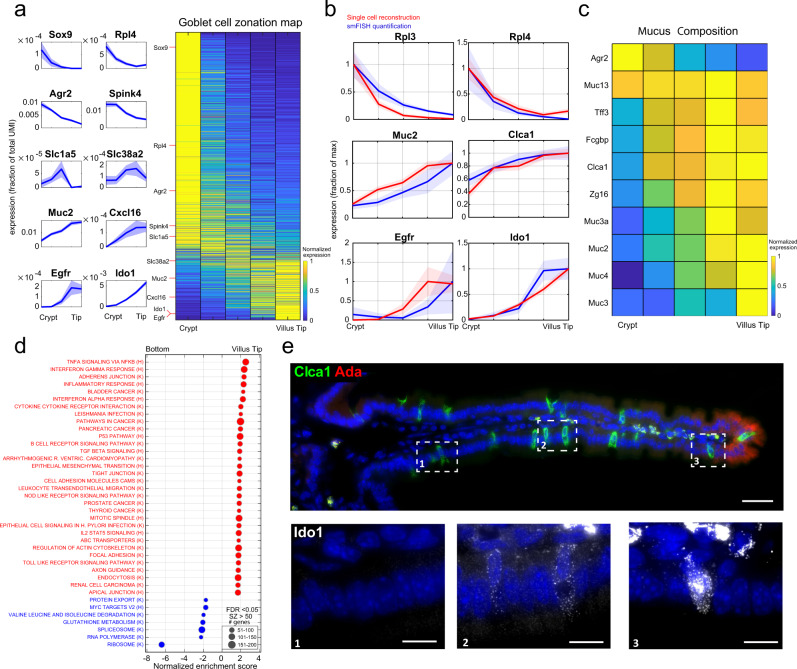
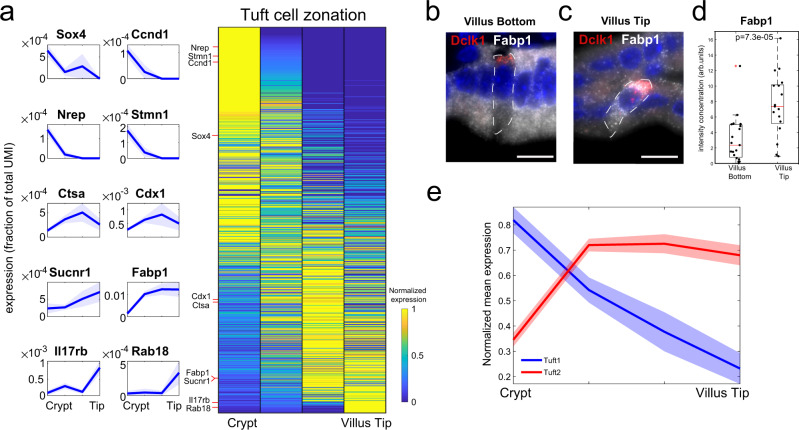
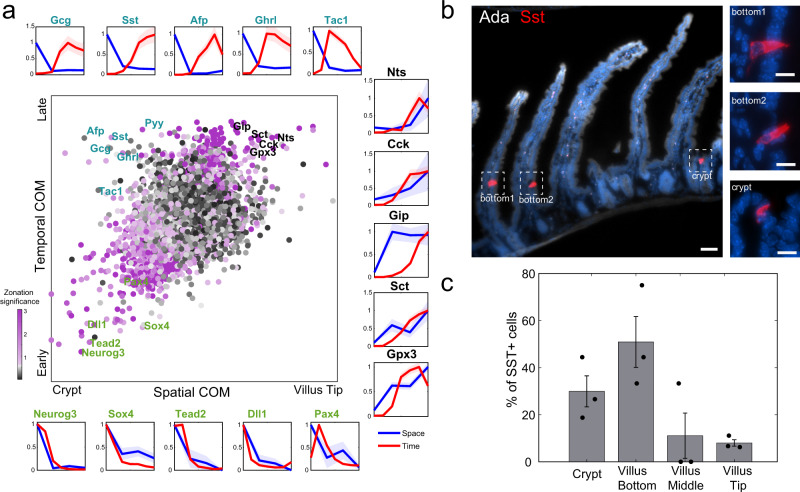
Single-cell RNA sequencing combined with spatial information on landmark genes enables reconstruction of spatially-resolved tissue cell atlases. However, such approaches are challenging for rare cell types, since their mRNA contents are diluted in the spatial transcriptomics bulk measurements used for landmark gene detection. In the small intestine, enterocytes, the most common cell type, exhibit zonated expression programs along the crypt-villus axis, but zonation patterns of rare cell types such as goblet and tuft cells remain uncharacterized. Here, we present ClumpSeq, an approach for sequencing small clumps of attached cells. By inferring the crypt-villus location of each clump from enterocyte landmark genes, we establish spatial atlases for all epithelial cell types in the small intestine. We identify elevated expression of immune-modulatory genes in villus tip goblet and tuft cells and heterogeneous migration patterns of enteroendocrine cells. ClumpSeq can be applied for reconstructing spatial atlases of rare cell types in other tissues and tumors.


Conflict of interest statement

The authors declare no competing interests.

Figures

Fig. 1
Fig. 1. Schematic representation of the experimental design.
a The intestinal tissue is suboptimally dissociated to generate clumps. b Clumps are enriched with FACS, based on Hoechst DNA staining; the histogram shows ImageStream quantification of the clumps’ nuclear DNA content (n = 3 mice). Source data are provided as a Source data file; bottom shows an example of a pair (left) and a 4-cell clump (right). Scale bar, 10 μm. c The position of clumps is computationally inferred by the enterocyte transcriptome, and spatial landmark genes for specific secretory cells are retrieved. d These are used to infer the location of single sequenced secretory cells, enabling zonation reconstruction.
Fig. 2
Fig. 2. ClumpSeq yields tissue fragments consisting of secretory and non-secretory cells.
ad tSNE plots of sequenced clumps, colored by log10 of summed expression of zonated enterocyte markers: a the crypt genes Mki67, Ccnb1, Ccnd1, Mcm2, Pcna, and Olfm4; b the bottom villus genes Nlrp6, Lypd8, Il18, Reg1 and Reg3a; c the mid-villus genes Slc5a1, Slc2a5, Slc2a2, Slc7a7, Slc7a8, Slc7a9; d the villus tip genes Ada,Nt5e and Slc28a2, Creb3l3, Apoa1, and Apob. eh tSNE plots highlighting clumps containing secretory cells, marked by black dots. Plots colored by log10 of summed cell type marker genes (Supplementary Data 7, “Methods”) for e Goblet, f Enteroendocrine, g Tuft and h Paneth cells. il Large clumps increase the capture rate of secretory cells. Shown are violin plots of summed secretory derived transcripts (expressed in over 50% of single secretory cells with a mean over 5 fold higher than in enterocytes) in pairs compared to larger clumps (Supplementary Data 6) for i Goblet, j Enteroendocrine, k Tuft and l Paneth specific genes. Only crypt pairs and clumps were used to minimize effects from zonated genes. White circles are medians, gray boxes mark the 25–75 percentiles. Dashed horizontal lines indicate the median value in the respective single secretory cell type (Supplementary Fig. 7). Numbers show the percent of clumps above this threshold, which most probably contain the respective secretory cell type. n pairs = 2926, n clumps = 1862, examined over five independent experiments. m Crypt and villus-tip enterocyte marker genes are not found in the same clumps, indicating the clumps did not form after tissue dissociation. n Violin plot of log10 of 1+summed paneth markers (Supplementary Data 7) in all large (more than two cells) clumps, stratified by inferred zone. White circles are medians. Dashed horizontal line indicates the median value in paneth containing large clumps. o Geometric classification of clumps. Representation of clumps in PCA space based on the type-specific markers summed expression. Enterocyte-only clumps are at the origin, each ray contains a different secretory cell type (“Methods”, Supplementary Fig. 3e, f, Supplementary Data 7).
Fig. 3
Fig. 3. Spatial reconstruction of goblet cells.
a Reconstructed zonation profiles based on single goblet cells. Profiles are normalized to their maximum across zones. Plots on the left show zonation profiles of representative crypt (Sox9, Rpl4, Agr2, Spink4), mid-villus (Slc1a5, Slc38a2) and villus tip (Muc2, Cxcl16, Egfr, Ido1) genes. Light areas denote the SEM. b Validation of the reconstructed zonation profiles using smFISH. Blue line shows smFISH mean expression level, red line the reconstructed profile based on the single cell analysis. Light patches denote the SEM. Source data are provided as a Source data file. c Heatmap of zonation profiles of genes related to mucus composition. Profiles are normalized to their maximum across zones. d Gene set enrichment analysis for hallmark (H) and KEGG (K) pathways (FDR < 0.05), tip enriched sets are in red, bottom enriched sets are in blue. e smFISH image of zonated genes Clca1 (green) and Ido1. Ada (red) marks the villus tip, blue the DAPI-stained nuclei. Bottom insets show Ido1 mRNAs (gray dots) increasing from the bottom (1) to middle (2) and tip (3) villus zones. Images representative of n = 10 villi (5/mouse). Scale bar, 50 μm in the stitched image and 15 μm in the insets.
Fig. 4
Fig. 4. Spatial reconstruction of tuft cells.
a Reconstructed zonation profiles based on single tuft cells. Profiles are normalized to their maximum across zones. Plots on the left show zonation profiles of representative crypt (Sox4, Ccnd1, Nrep, Stmn1), mid-villus (Ctsa, Cdx1) and tip (Sucnr1, Fabp1, Il17rb, Rab18) genes. Light areas denote the SEM. b, c Representative smFISH images of the tuft zonated gene Fabp1 (gray) in a villus bottom (b) and a villus tip (c) tuft cell. Tuft cells were identified using Dclk1 (red). Scale bar 15 μm. d Quantification of Fabp1 smFISH experiment. P value was calculated by Mann–Whitney U test two-sided. n = 20 cells were examined over 2 mice. Red lines are medians, black boxes are 25–75 percentiles. Whiskers extend to the most extreme data point within 1.5× the interquartile range (IQR) from the box. Source data are provided as a Source data file. e Mean max-normalized zonation profiles for tuft1 and tuft2 genes. Light areas denote the SEM.
Fig. 5
Fig. 5. Migration pattern of eneteroendocrine lineages.
a Spatio-temporal analysis of enteroendocrine cells. Central plot: Scatter plot of the center of mass (COM) in our spatial zonation reconstruction vs. temporal COM based on single cell time stamps form Gehardt et al. (“Methods”). Dots colored by ‒log10(spatial zonation q-value). Peripheral plots show reconstructed temporal (red) and spatial (blue) profiles for early crypt-confined genes (green fonts, bottom row), intermediate-late crypt/villus bottom-confined genes, expressed in cells that might be migrating more slowly (cyan fonts, top row) and late villus-localized genes, expressed in cells that might be migrating more rapidly (black fonts, right column). Light areas in plots denote the SEM. b Representative smFISH images of the enteroendocrine crypt-zonated gene Sst (red). Insets are blow-ups of the Sst+ cells at the crypt and bottom villus. Ada in gray marks the villi tips. Scale bars, 50 μm in the large image and 10 μm in the insets. c Quantification of Sst+ enteroendocrine D-cells in crypt and villus bottom, middle and tip over 3 mice. Fisher exact test (two-sided) for the frequencies of D-cells between the two lower zones and two upper zones p = 3.8 × 10−5. Data are presented as mean values ± SD. Source data are provided as a Source data file.

References

    1. Moor AE, Itzkovitz S. Spatial transcriptomics: paving the way for tissue-level systems biology. Curr. Opin. Biotechnol. 2017;46:126–133. doi: 10.1016/j.copbio.2017.02.004. - DOI - PubMed
    1. Achim K, et al. High-throughput spatial mapping of single-cell RNA-seq data to tissue of origin. Nat. Biotechnol. 2015;33:503–509. doi: 10.1038/nbt.3209. - DOI - PubMed
    1. Halpern KB, et al. Single-cell spatial reconstruction reveals global division of labour in the mammalian liver. Nature. 2017;542:352–356. doi: 10.1038/nature21065. - DOI - PMC - PubMed
    1. Satija R, Farrell JA, Gennert D, Schier AF, Regev A. Spatial reconstruction of single-cell gene expression data. Nat. Biotechnol. 2015;33:495–502. doi: 10.1038/nbt.3192. - DOI - PMC - PubMed
    1. Scialdone A, et al. Resolving early mesoderm diversification through single-cell expression profiling. Nature. 2016;535:289–293. doi: 10.1038/nature18633. - DOI - PMC - PubMed

Publication types