. 2021 May 24;12(1):3054.
doi: 10.1038/s41467-021-22930-6.

Immunotranscriptomic profiling the acute and clearance phases of a human challenge dengue virus serotype 2 infection model

Affiliations

Immunotranscriptomic profiling the acute and clearance phases of a human challenge dengue virus serotype 2 infection model

John P Hanley et al. Nat Commun. .

Abstract

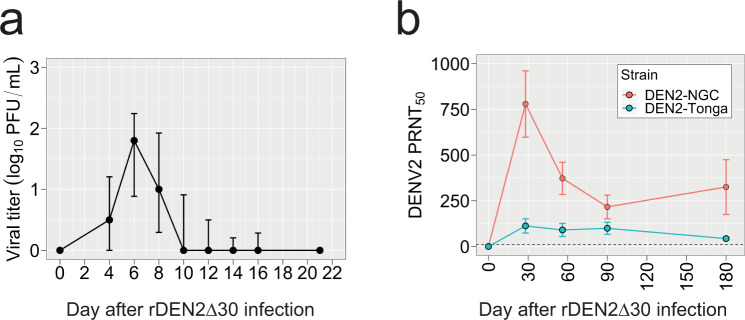
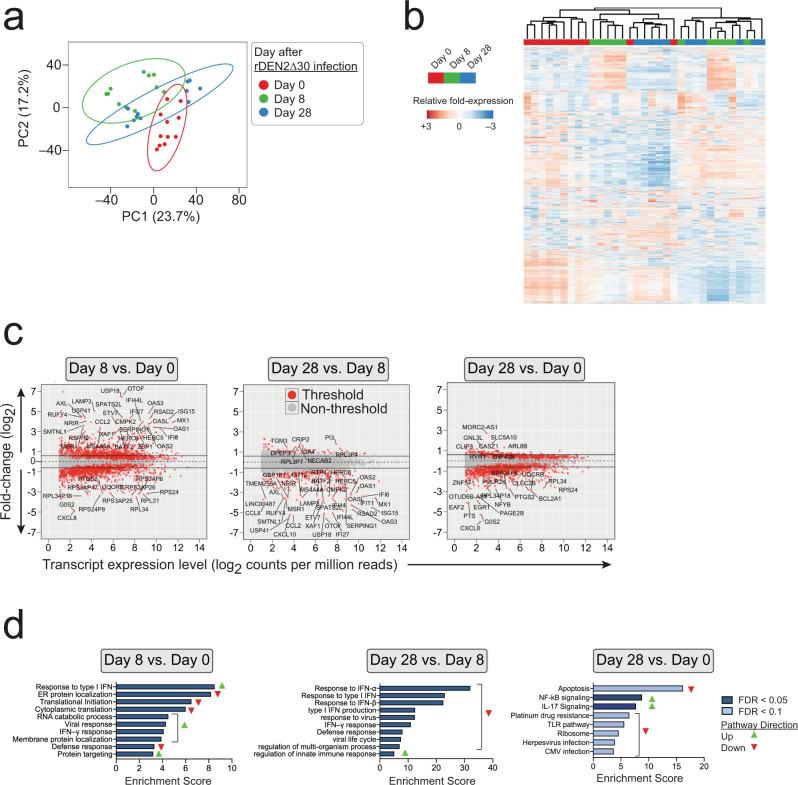
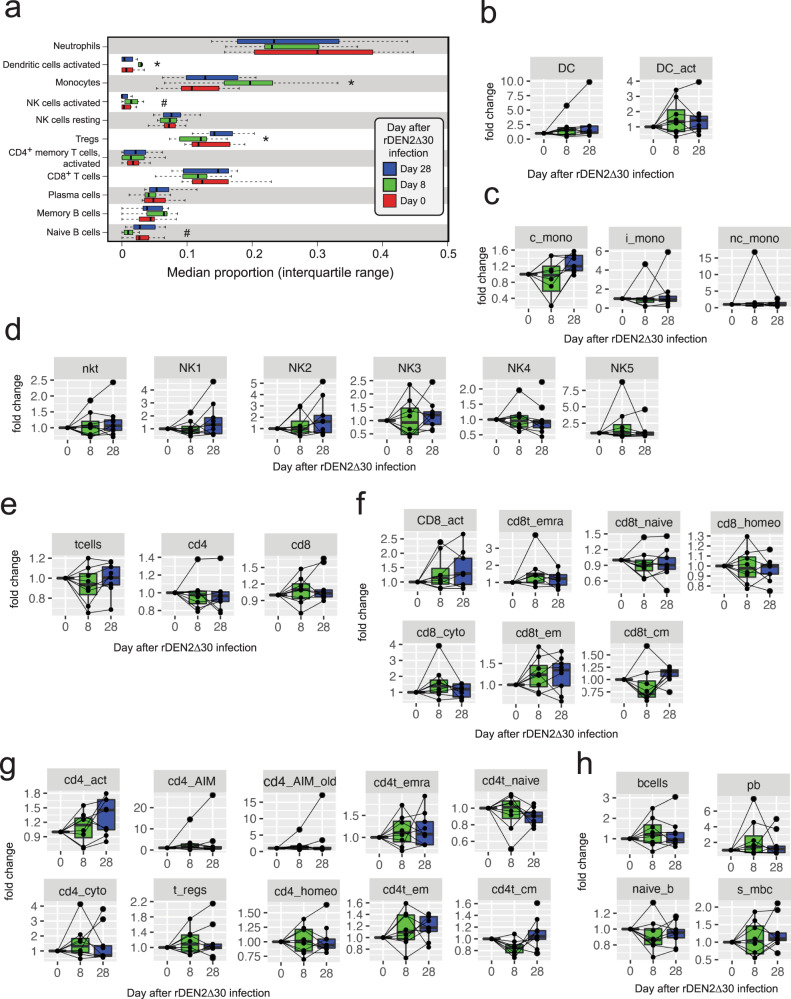
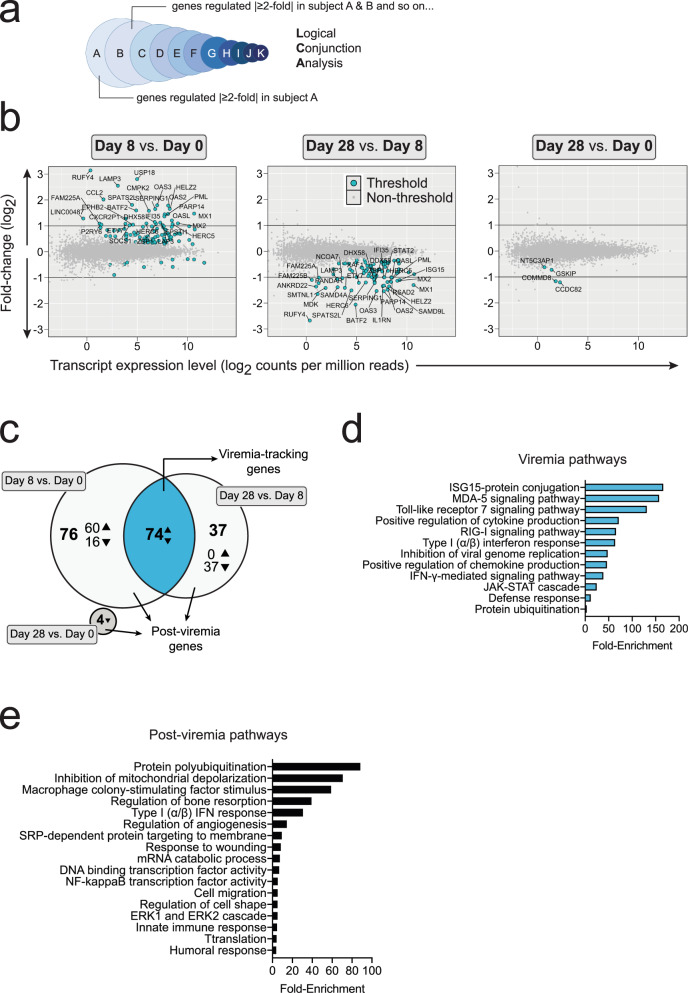
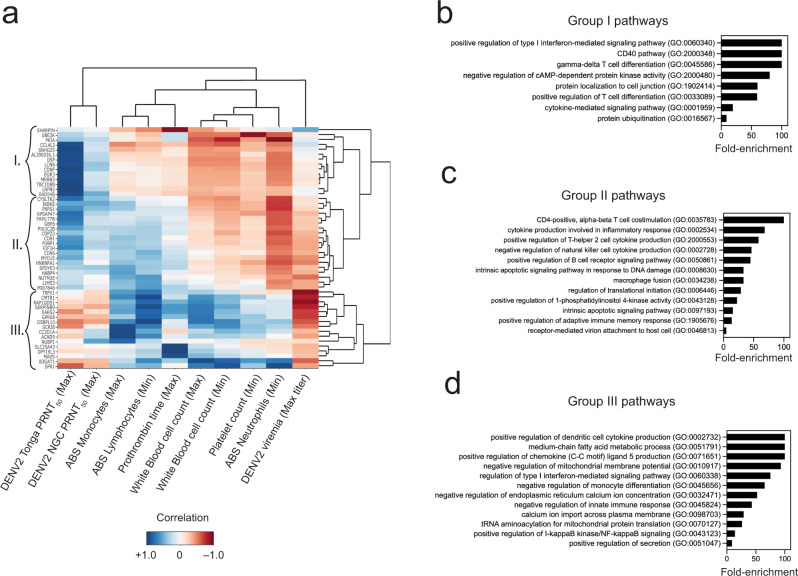
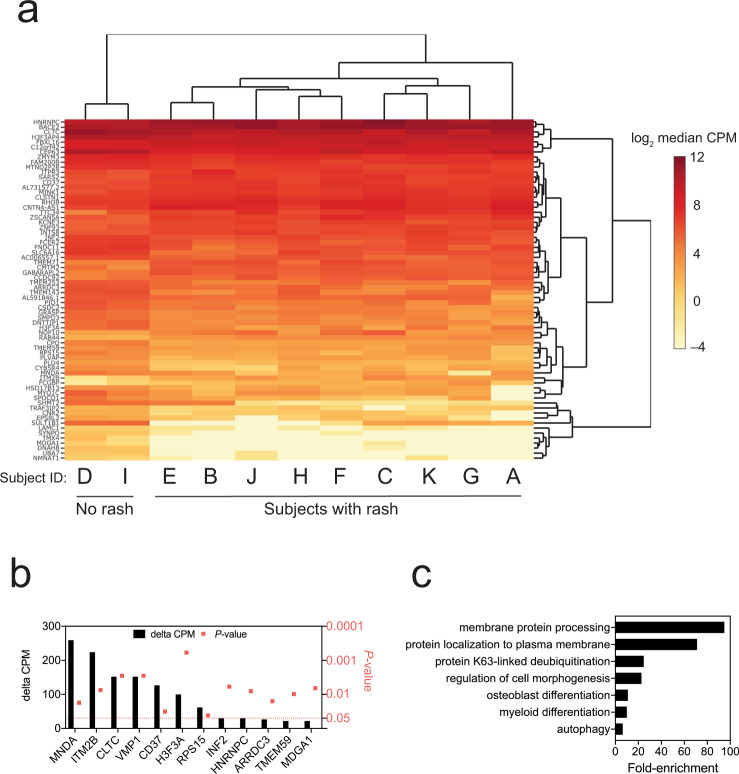
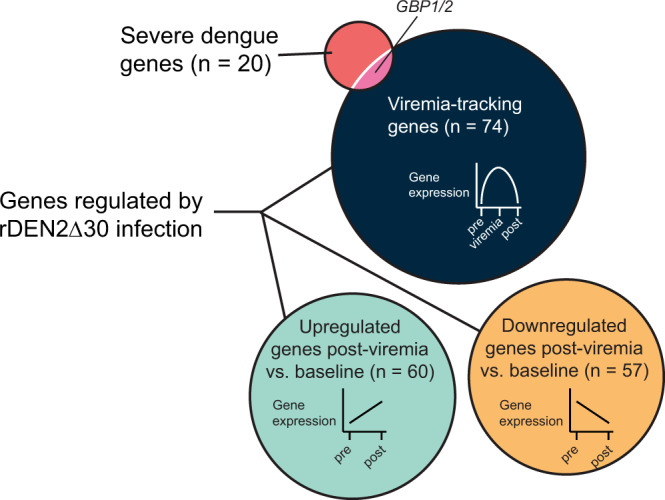
About 20-25% of dengue virus (DENV) infections become symptomatic ranging from self-limiting fever to shock. Immune gene expression changes during progression to severe dengue have been documented in hospitalized patients; however, baseline or kinetic information is difficult to standardize in natural infection. Here we profile the host immunotranscriptome response in humans before, during, and after infection with a partially attenuated rDEN2Δ30 challenge virus (ClinicalTrials.gov NCT02021968). Inflammatory genes including type I interferon and viral restriction pathways are induced during DENV2 viremia and return to baseline after viral clearance, while others including myeloid, migratory, humoral, and growth factor immune regulation factors pathways are found at non-baseline levels post-viremia. Furthermore, pre-infection baseline gene expression is useful to predict rDEN2Δ30-induced immune responses and the development of rash. Our results suggest a distinct immunological profile for mild rDEN2Δ30 infection and offer new potential biomarkers for characterizing primary DENV infection.


Conflict of interest statement

The authors declare no competing interests.

Figures

Fig. 1
Fig. 1. Viremia and antibody levels in response to experimental infection of humans with rDEN2Δ30 (Tonga 74 strain).
a DENV2 viremia in a cohort of flavivirus-naïve subjects, n = 11. Viremia was measured by culture of serum on Vero81 cells and mean viral titer plaque-forming units per mL of serum (PFU/mL) ± standard deviation (approx. 67th percentile) above zero are shown. b Serum neutralizing antibodies (PRNT50, mean ± standard deviation) to DENV2-NGC and DENV2-Tonga after infection with rDEN2Δ30.
Fig. 2
Fig. 2. Clinical laboratory assessment of rDEN2Δ30 infection.
a Leukocyte populations expressed as absolute counts, (×1000 cells/cm2, left) and as a percent of white blood cells (right) are shown for study visits occurring every other day over two ~2-week periods: 6 months preinfection and after infection of flavivirus-naive healthy volunteers (n = 11) with rDEN2Δ30, including day of infection. b Hematology labs, including red blood cell counts, serum hemoglobin, hematocrit, mean corpuscular hemoglobin (MCH), MCH concentration (MCHC), and mean corpuscular volume (MCV) are shown for pre- and post-infection as in (a). c Coagulation labs, platelet counts, mean platelet volume (MPV), Prothrombin time, international normalized ratio (INR), and partial thromboplastin time (PTT) are shown for pre- and post-infection as in (a). d Metabolic labs including alanine aminotransferase (ALT), Creatinine, and glomerular filtration rate (GFR) are shown for pre- and post-infection as in (a). Data shown for all subjects are shown as non-parametric LOESS (LOcal regrESSion) smoothing. All data also plotted by individual subject in Source Data. ULN upper limit of normal (solid lines), LLN lower limit of normal (dashed lines). For all panels, LOESS-smoothed lines and 95% confidence intervals are shown. Source data are provided as a Source Data file.
Fig. 3
Fig. 3. Group analysis of temporal gene expression analysis after rDEN2Δ30 primary infection.
a Principal component analysis by timepoint. One symbol per subject. b The top 2400 variable genes clustered on heatmap with column annotations for timepoints post infection. TMM values ln(x + 1)-transformed. Rows are centered; unit variance scaling is applied to rows. Both rows and columns are clustered using correlation distance and average linkage. c F × E plots (log2 fold-change × expression, indicated by log2 counts per million (CPM) reads) of pairwise timepoint comparisons. Differential gene expression threshold is significance level of P < 0.05, FDR < 0.1, and transcript level ≥ 4 CPM. Examples of highly regulated genes are labeled (d) Pathway analysis of differentially expressed genes in pairwise comparisons by timepoint after infection. Predicted pathway directionality (green up-pointing triangle, upregulated; red down-pointing triangle, downregulated) was determined by the behavior of the genes exhibiting |≥1.5-fold change|. Source data are provided as a Source Data file.
Fig. 4
Fig. 4. Immune-cell dynamics before, during, and after rDEN2Δ30 infection.
a Deconvolution of gene expression using a leukocyte gene signatures matrix to obtain median proportions of select adaptive and innate white blood cells at each timepoint. Center lines show the medians; box limits indicate the 25th and 75th percentiles; whiskers represent 95% confidence interval. Kruskal–Wallis one-way ANOVA was used to determine P values. *P < 0.05; #P < 0.1. bg Flow cytometric analysis of peripheral blood mononuclear cells from rDEN2Δ30-infected subjects. Data are expressed as fold change in cell frequency at days 8, and 28 after infection relative to day 0 baseline. Center lines show the medians; box limits indicate the 25th and 75th percentiles and all data points are shown. Kruskal–Wallis one-way ANOVA was used to determine P values indicated as *P < 0.05 and #P < 0.1. b Lineage-negative (CD3CD19CD56CD14CD16) HLA-DR+ dendritic cells (DC), HLA-DRhi activated DC (DC_act); c monocytes: classical (c_mono), intermediate (i_mono), and non-classical (nc_mono); d natural killer T cells (nkt), NK1-5 populations (defined by CD56 and CD16 staining as outlined in Supplementary Fig. 4); e CD3+ T cells (t cells), CD4+ T cells (cd4), and CD8+ T cells (cd8); f CD8+ T-cell populations: activated CD279+ (cd8_act), cytotoxic CD57+ (cd8_cyto), CCR7CD45RA+ T-effector re-expressing CD45RA (cd8t_emra), CCR7+CD45RA+ naive (cd8t_naive), CCR7CD45RA effector memory (cd8t_em), CCR7+CD45RA central memory (cd8t_cm), and homeostatic CD127+ (cd8_homeo); g CD4+ T-cell populations: activated CD279+ (cd4_act), cytotoxic CD57+ (cd4_cyto), activation-induced marker (AIM)-positive CD154+CD134+(cd4_AIM), CD25+CD134+ (cd4_AIM_old), regulatory T cells CD127CD25+ (t_regs), homeostatic CD127+ (cd4_homeo), CCR7CD45RA+ T effector re-expressing CD45RA (cd4t_emra), CCR7+CD45RA+ naive (cd4t_naive), CCR7CD45RA effector memory (cd4t_em), CCR7+CD45RA central memory (cd4t_cm); h CD19+ B cells (bcells), plasmablasts CD19+ CD38hiCD27hi (pb), IgM+CD27 naïve B cells (naive_b), and IgMCD27+ switched memory B cells (s_mbc). See Fig. S4 for gating. Source data are provided as a Source Data file.
Fig. 5
Fig. 5. Temporal gene expression analysis after rDEN2Δ30 infection by logical conjunction analysis (LCA).
a Schematic overview of LCA. Genes have undergone regulation if for all 11 subjects the regulation occurred in the same direction (e.g., up) and had a P value < 0.05 and FDR < 0.1. No minimum fold-change criteria was applied for Threshold. b F × E plots (log2 fold-change × expression, in counts per million reads (CPM)) of pairwise timepoint comparisons for genes meeting threshold of P < 0.05 and FDR < 0.1 and ≥4 counts per million reads (CPM). Examples of genes regulated |≥1.5-fold| are labeled (c) Venn diagram of gene expression changes by timepoint. Triangles indicate directionality of gene regulation in timepoint comparison. d DAVID Pathway analysis of Viremia-Tracking genes (e) DAVID pathway analysis of post-viremia genes. Directionality is not shown because the pathway definition incorporates three timepoints. Source data are provided as a Source Data file.
Fig. 6
Fig. 6. Association of preinfection baseline gene expression with clinical features of rDEN2Δ30 infection.
a Genome-wide absolute baseline gene expression level counts (rows) were queried against ten clinical laboratory parameters (columns) associated with rDEN2Δ30 infection including peak viremia, neutralizing antibodies and changes in blood cell counts across the 11 subjects. Only genes (rows) that had an absolute correlation >0.9 for at least one of the columns are pictured. Darker colors represent a stronger correlation; while blue and red represent positive and negative correlation, respectively. Unsupervised clustering identified 49 genes and three major groups (I–III) distinguishing amongst the parameters. bd Pathway analysis and GO terms associated with Group 1 (b), Group II (c), and Group III (d) gene associations and unadjusted P values with FDR < 0.1 are shown. Source data are provided as a Source Data file.
Fig. 7
Fig. 7. Association of preinfection gene expression with rash following rDEN2Δ30 infection.
a Hierarchical clustering of transcript levels (expressed) counts per million (cpm) for genes that have a day 0 cpm that is linearly separable for subjects that have rash and those that do not have rash. Darker shades of red indicate a higher median expression (log2cpm) on day 0. b Genes that distinguish rash versus non-rash based on linear separability greater than 20 (i.e., the median Δ cpm for rash versus non-rash is |≥20|) with corresponding P values (square symbols). c DAVID pathway analysis for all significant rash-distinguishing linear separable genes (n = 56). Source data are provided as a Source Data file.
Fig. 8
Fig. 8. Distinct gene regulation in different phases of rDEN2Δ30 infection and in severe dengue.
Venn diagram of genes associated with severe dengue from Robinson et al. (ref. ) in relation to viremia-tracking genes (n = 74) and to those that were upregulated (n = 60) or downregulated (n = 57) post-viremia compared to baseline following rDEN2Δ30 infection. Source data are provided as a Source Data file.

References

    1. Bhatt S, et al. The global distribution and burden of dengue. Nature. 2013;496:504–507. doi: 10.1038/nature12060. - DOI - PMC - PubMed
    1. WHO. Dengue guidelines for diagnosis, treatment, prevention and control: new edition.) World Health Organization (2009). - PubMed
    1. Wilder-Smith A, Ooi EE, Horstick O, Wills B. Dengue. Lancet. 2019;393:350–363. doi: 10.1016/S0140-6736(18)32560-1. - DOI - PubMed
    1. Guzman MG, Gubler DJ, Izquierdo A, Martinez E, Halstead SB. Dengue infection. Nat. Rev. Dis. Prim. 2016;2:16055. doi: 10.1038/nrdp.2016.55. - DOI - PubMed
    1. Brathwaite Dick, O. et al. The history of dengue outbreaks in the Americas. Am. J. Trop. Med. Hyg.87, 584–593 (2012). - PMC - PubMed

Publication types

Associated data