. 2021 May 24;12(1):3060.
doi: 10.1038/s41467-021-23135-7.

Nutrient content and stoichiometry of pelagic Sargassum reflects increasing nitrogen availability in the Atlantic Basin

Affiliations

Nutrient content and stoichiometry of pelagic Sargassum reflects increasing nitrogen availability in the Atlantic Basin

B E Lapointe et al. Nat Commun. .

Abstract

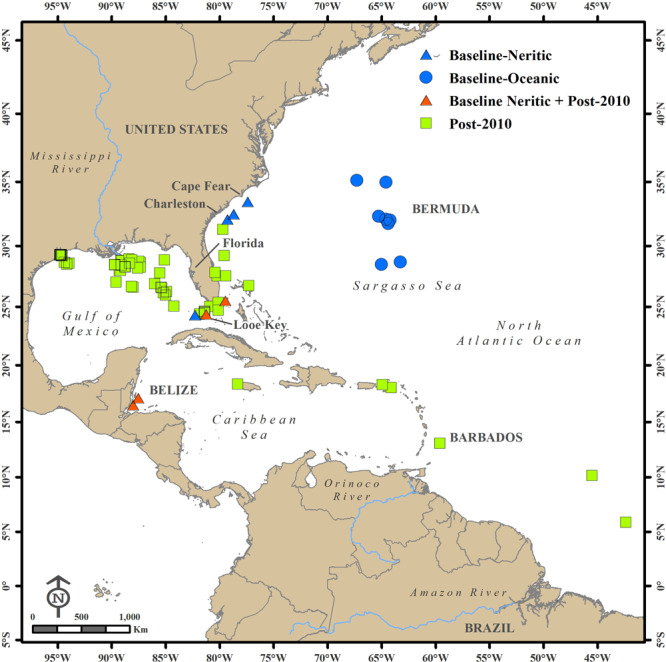
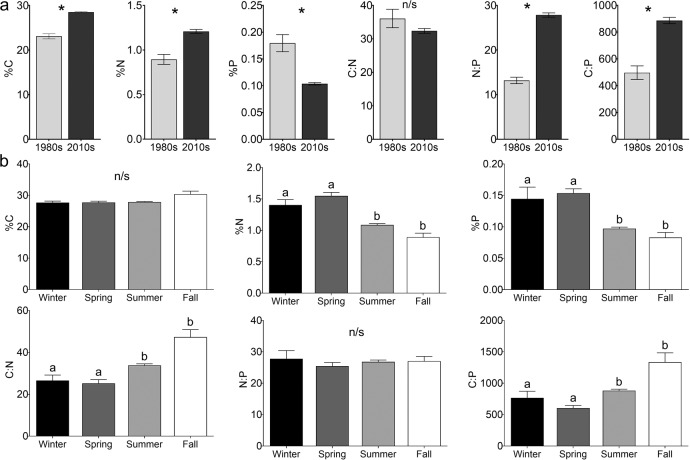
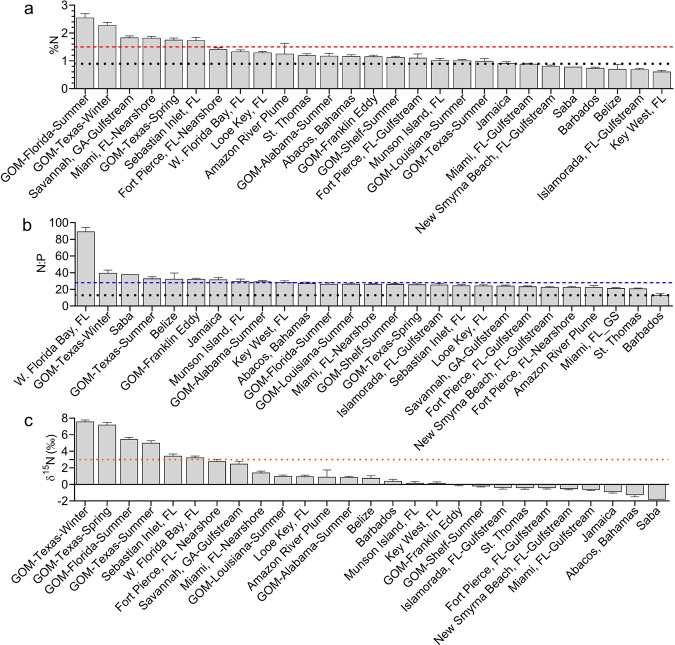
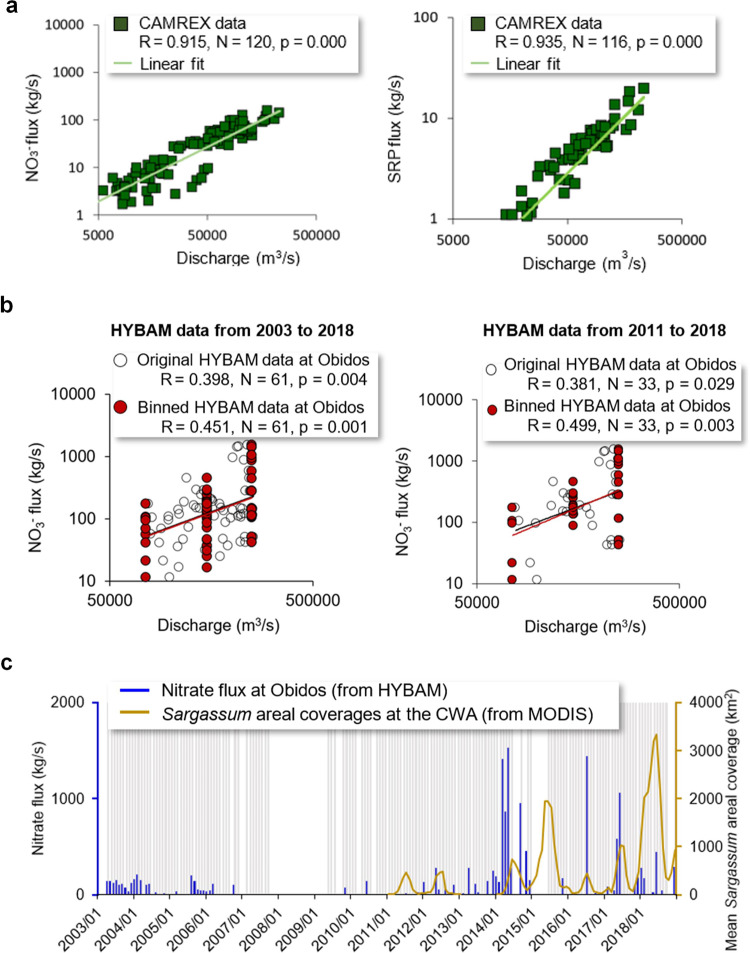
The pelagic brown macroalgae Sargassum spp. have grown for centuries in oligotrophic waters of the North Atlantic Ocean supported by natural nutrient sources, such as excretions from associated fishes and invertebrates, upwelling, and N2 fixation. Using a unique historical baseline, we show that since the 1980s the tissue %N of Sargassum spp. has increased by 35%, while %P has decreased by 44%, resulting in a 111% increase in the N:P ratio (13:1 to 28:1) and increased P limitation. The highest %N and δ15N values occurred in coastal waters influenced by N-rich terrestrial runoff, while lower C:N and C:P ratios occurred in winter and spring during peak river discharges. These findings suggest that increased N availability is supporting blooms of Sargassum and turning a critical nursery habitat into harmful algal blooms with catastrophic impacts on coastal ecosystems, economies, and human health.


Conflict of interest statement

The authors declare no competing interests.

Figures

Fig. 1
Fig. 1. Sargassum collection locations.
Locations in the North Atlantic Ocean where Sargassum samples were collected during the 1980s baseline study (blue), post-2010 collections (green), and during both time frames (orange).
Fig. 2
Fig. 2. Sargassum tissue nutrient contents.
Tissue elemental composition and C:N:P stoichiometry (mean ± SE) of Sargassum natans and S. fluitans collected throughout the NA in the 1980s and post-2010. a by decade with asterisks representing significant differences and b by Northern Hemisphere meteorological season with different lowercase letters representing significant differences identified with Tukey HSD test; “n/s” denotes a non-significant (P > 0.05) ANOVA result.
Fig. 3
Fig. 3. Post-2010 Sargassum tissue nutrient contents by location.
Post-2010 Sargassum tissue nutrient contents by location (mean ± SE), as well as Northern Hemisphere meteorological season for Gulf of Mexico (GOM) samples, indicating where %N and N:P ratios were greater than the 1980s baseline mean for the entire dataset (black dotted lines). a For %N, values have significantly increased from the 1980s (decadal mean = 0.89%) to post-2010 (decadal mean = 1.21%); %N values >1.5 (red dashed line) are considered non-limiting to macroalgal growth. b N:P ratios have significantly (111%; ANOVA, F = 1 93.4, P < 0.001) increased from the 1980s (decadal mean = 13.2) to post-2010 (decadal mean = 27.8, blue dashed line). c Enriched δ15N values (>+3‰, orange dotted line) are indicative of urbanized wastewater discharges, while more depleted values are indicative of N2 fixation, atmospheric deposition, and upwelling.
Fig. 4
Fig. 4. Spatial distribution of Sargassum in relation to salinity and aerosol trajectories.
a Sargassum distribution (red empty squares) overlaid on salinity derived from the Soil Moisture Ocean Salinity (SMOS) satellite mission, both for July 2018. The blue line marks the longitude of 38˚W that the Amazon River plume hardly reaches. b Distribution of Sargassum as a function of salinity (purple) for 2011 to 2019, where statistics are calculated from 108 monthly mean maps over the cumulative Sargassum footprint. Here, the raw data (purple) shows Sargassum areal coverage in each salinity increment, relative to the total coverage (i.e., all purple bars sum to 1.0). The Sargassum coverage in each salinity increment is divided by the water area in the same salinity increment, resulting in the “salinity normalized” distribution (blue). The Sargassum distribution data were obtained on National Centers for Environmental Information (NCEI) Accession 0190272. c Hybrid Single-Particle Lagrangian Integrated Trajectory model (HYSPLIT) air mass back trajectories (10-day) from 3°N, 34.6°W at 500 m (red), 1000 m (blue), and 1500 m (green), shown with the active fires in Africa and South America observed during Apr 2020 to Mar 2021 (from firms.modaps.eosdis.nasa.gov/download).
Fig. 5
Fig. 5. Nutrient flux from the Amazon River and long-term Sargassum trend.
a Nitrate (NO3) and soluble reactive phosphorus (SRP) flux from all stations of the 13 CAMREX cruises (1982 to 1991) are highly correlated with river discharge. These stations are within a 2000 km reach of the Brazilian Amazon River mainstream. Solid lines mark the power law regression lines. b NO3 flux at Obidos from the HYBAM database is also correlated with discharge, and the correlation is higher if data are binned to different discharge groups. c NO3 flux at Obidos from the same HYBAM dataset shows apparent increases in recent years. The recent mean monthly Sargassum areal coverages obtained from Wang et al. (2019) in the Central West Atlantic (CWA, 0oN to 22oN, 63oW to 38oW) are also shown as reference. All months before 2011 show Sargassum coverages. The shaded gray bars indicate when quality controlled HYBAM nutrient flux measurements are available, but data in some months are too low (<0.1 mg/L) to be visible due to the scale.

Similar articles

Cited by

References

    1. Ryther JH. The Sargasso Sea. Sci. Am. 1956;194:98–108. doi: 10.1038/scientificamerican0156-98. - DOI
    1. Littler, D. S. & Littler, M. M. Caribbean Reef Plants (Offshore Graphics, 2000).
    1. Winge, O. The Sargasso Sea, Its Boundaries and Vegetation In Report of the Danish Oceanographic Expedition, Vol. III, 1908–1910, (Copenhagen: Andr. Fred. Hòst and Sòn) 34 pp. Miscellaneous Paper Number 2. (1923).
    1. Parr AE. Quantitative observations on the pelagic Sargassum vegetation of the western North Atlantic. Bull. Bingham Oceanogr. Collect. 1939;6:1–94.
    1. Lapointe BE. A comparison of nutrient-limited productivity in Sargassum natans from neritic vs. oceanic waters of the western North Atlantic Ocean. Limnol. Oceanogr. 1995;40:625–633. doi: 10.4319/lo.1995.40.3.0625. - DOI

Publication types

LinkOut - more resources