. 2021 May 24;12(1):3073.
doi: 10.1038/s41467-021-23220-x.

The metabolic hormone leptin promotes the function of TFH cells and supports vaccine responses

Affiliations

The metabolic hormone leptin promotes the function of TFH cells and supports vaccine responses

Jun Deng et al. Nat Commun. .

Abstract

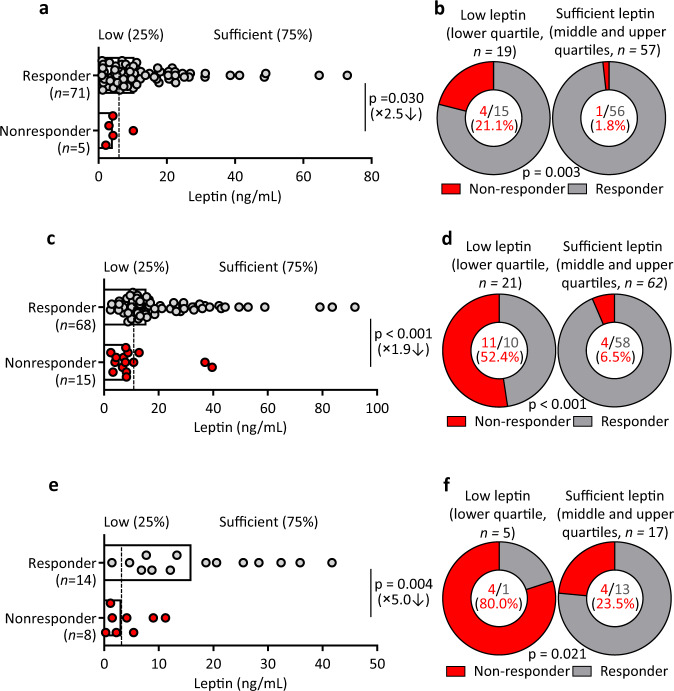
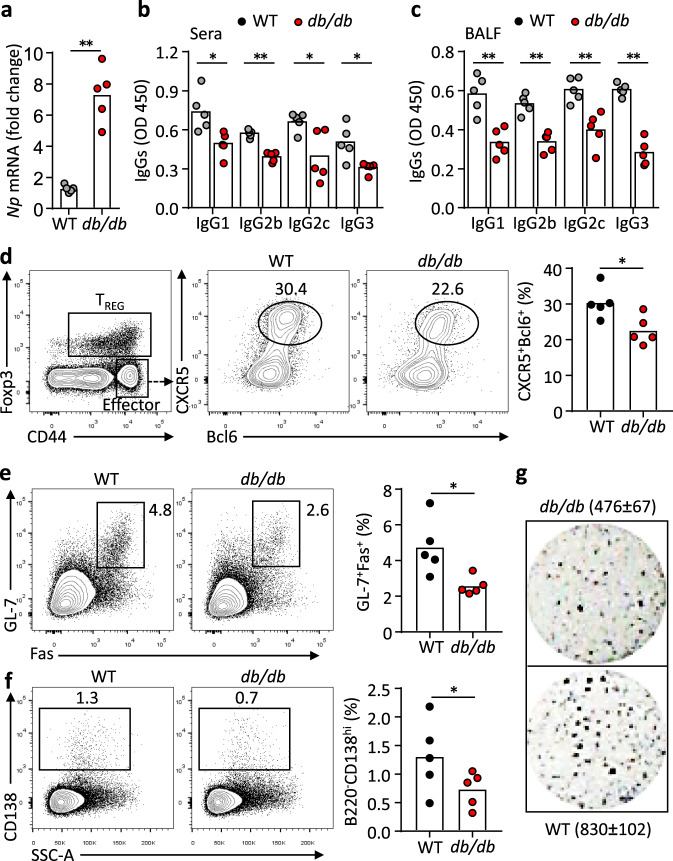
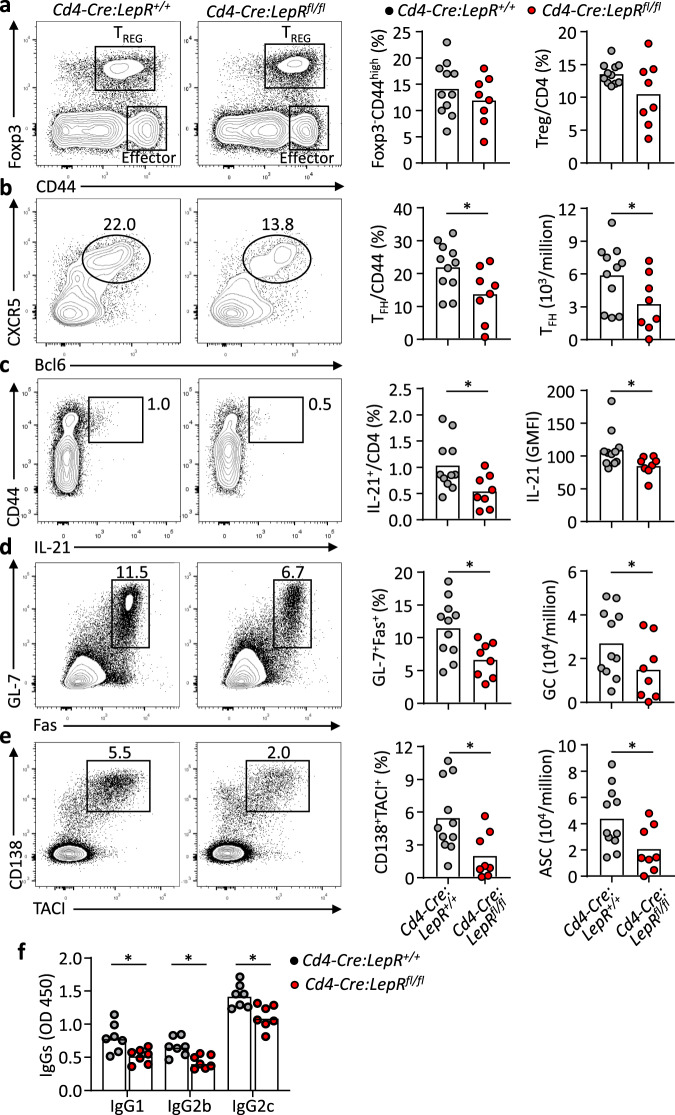
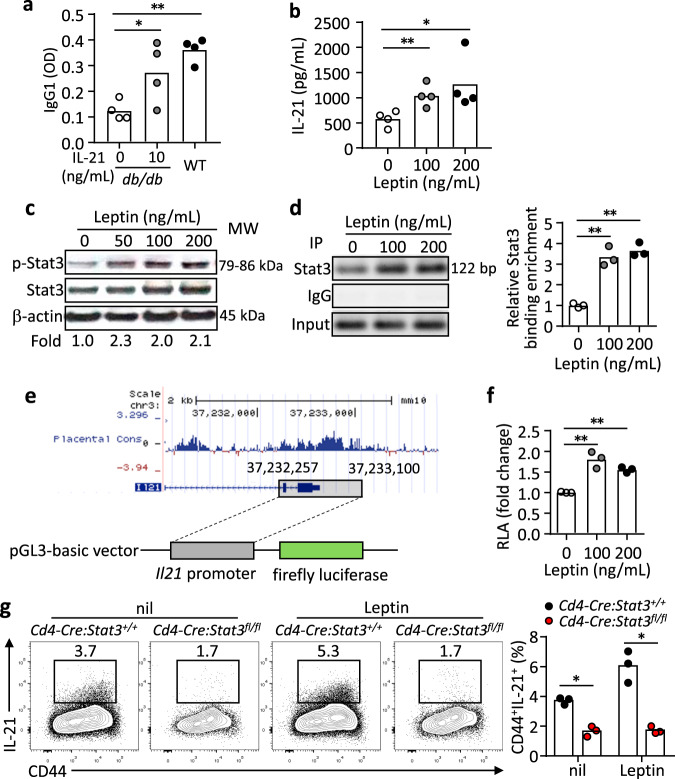
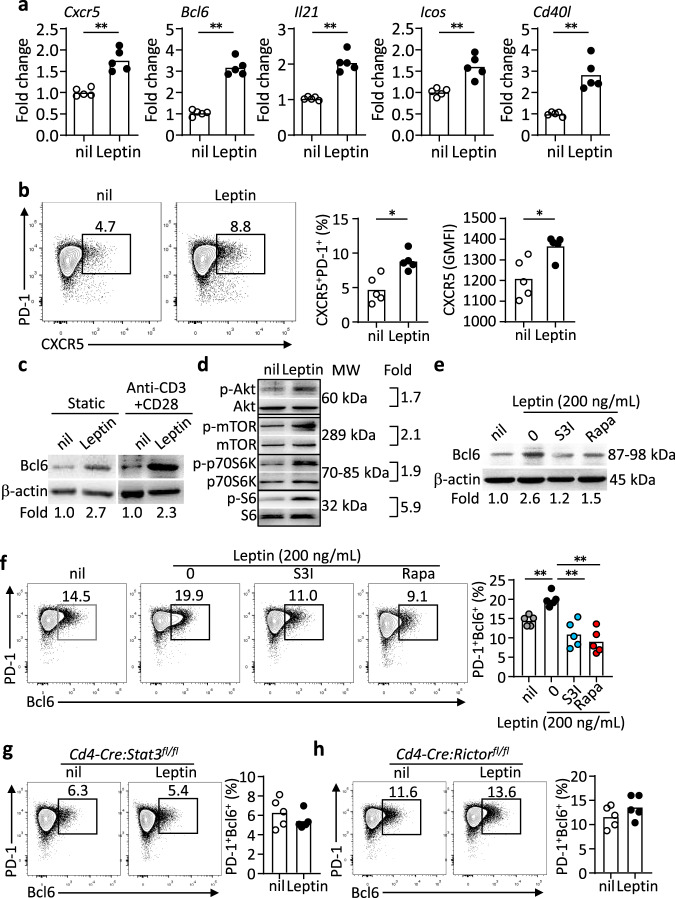
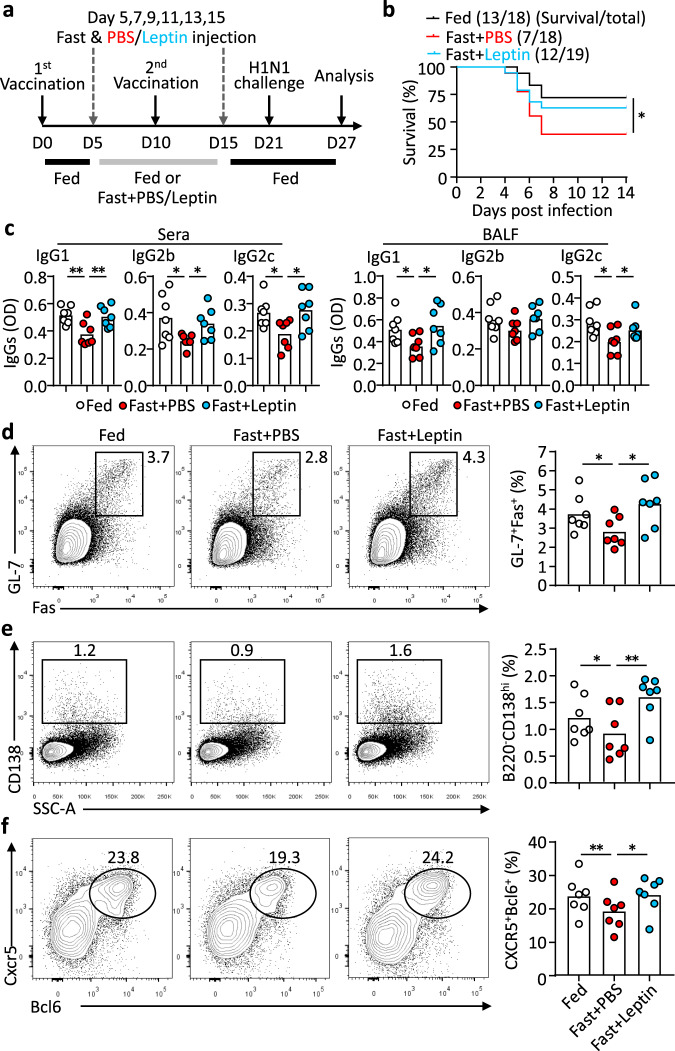
Follicular helper T (TFH) cells control antibody responses by supporting antibody affinity maturation and memory formation. Inadequate TFH function has been found in individuals with ineffective responses to vaccines, but the mechanism underlying TFH regulation in vaccination is not understood. Here, we report that lower serum levels of the metabolic hormone leptin associate with reduced vaccine responses to influenza or hepatitis B virus vaccines in healthy populations. Leptin promotes mouse and human TFH differentiation and IL-21 production via STAT3 and mTOR pathways. Leptin receptor deficiency impairs TFH generation and antibody responses in immunisation and infection. Similarly, leptin deficiency induced by fasting reduces influenza vaccination-mediated protection for the subsequent infection challenge, which is mostly rescued by leptin replacement. Our results identify leptin as a regulator of TFH cell differentiation and function and indicate low levels of leptin as a risk factor for vaccine failure.


Conflict of interest statement

The authors declare no competing interests.

Figures

Fig. 1
Fig. 1. Low leptin levels are associated with lower antibody responses after vaccination in the general population.
a Comparison of serum leptin levels between responders (n = 71, grey) and non-responders (n = 5, red) in healthy adults (18–60 years, n = 76) immunized with the influenza vaccine. Dotted line indicates healthy individuals with low leptin levels (lower 25%, <4.8 ng/mL) and sufficient leptin levels (higher 75%, ≥4.8 ng/mL). b Comparison of response rates between low leptin (n = 19) and sufficient leptin (n = 57) groups. c Comparison of serum leptin levels between responders (n = 68, grey) and non-responders (n = 15, red) in healthy elderly adults (>65 years, n = 83) immunized with the influenza vaccine. Dotted line indicates healthy individuals with low leptin levels (lower 25%, <8.8 ng/mL) and sufficient leptin levels (higher 75%, ≥8.8 ng/mL). d Comparison of response rates between low leptin (n = 21) and sufficient leptin (n = 62) groups. e Comparison of serum leptin levels between responders (n = 14, grey) and non-responders (n = 8, red) in healthy young adults (18–25 years, n = 22) immunized with the HBV vaccine. Dotted line indicates healthy individuals with low leptin levels (lower 25%, <3.2 ng/mL) and sufficient leptin levels (higher 75%, ≥3.2 ng/mL). f, Comparison of response rates between low leptin (n = 8) and sufficient leptin (n = 14) groups. Data from individuals (dots) and the median values (bars) are shown for a, c and e; Mann–Whitney test was used for analysis (a, c, e). Percentages and numbers are shown for b, d and f; Chi-Square tests were used for analysis (b, d, f). Detailed demographics of each cohort are shown in Supplementary Tables 1-3. For correlation of leptin levels and antibody responses see Supplementary Fig. 1.
Fig. 2
Fig. 2. Leptin potentiates the differentiation and function of human TFH cells.
a Comparison of serum leptin levels between healthy individuals with TFH increase (fold changes of TFH cells, the ratio of day 7/day 0 > 1) (n = 61, grey) and healthy individuals without TFH increase (fold changes of TFH cells, the ratio of day 7/day 0 ≤ 1) (n = 15, red) in healthy adults (18–60 years, n = 76) immunized with the influenza vaccine (Supplementary Table 4). Dotted line indicates healthy individuals with low leptin levels (lower 25%) and sufficient leptin levels (higher 75%). b Comparison of TFH changes and vaccine response in low leptin group (n = 19) and sufficient leptin group (n = 57). c Real-time PCR analysis of TFH-related genes in naïve CD4+ T cells from PBMC of healthy controls with anti-CD3/CD28 activation for 3 days, and further treated with leptin for 12 h (CXCR5: *P = 0.0176, Bcl6: **P = 0.0046, IL21: **P = 0.0085, PDCD1: **P = 0.0050, ICOS: **P = 0.0344) (n = 7). d, e Representative FACS plots and statistics showing the differentiation of CXCR5+PD-1+ TFH cells (d) (100 ng/mL: *P = 0.0257, 200 ng/mL: **P = 0.0012, 400 ng/mL: **P = 0.0005, 800 ng/mL: **P < 0.0001), and the secretion of IL-21 (e) (100 ng/mL: **P = 0.0004, 200 ng/mL: **P < 0.0001, 400 ng/mL: **P < 0.0001, 800 ng/mL: **P < 0.0001) from purified human naïve CD4+ T cells stimulated with anti-CD3/CD28 and indicated concentrations of leptin for 4 days (dots, n = 5; bars, mean ± SEM). f, g Statistics showing the percentages of CXCR5+PD-1+ TFH cells (f) (IL-12: *P = 0.0105, *P = 0.0107; IL-23: **P = 0.0063, **P = 0.0087; TGF-β: *P = 0.0187,*P = 0.0161; IL-12+TGF-β: **P = 0.0063,**P = 0.0052; IL-23+TGF-β: *P = 0.0452,*P = 0.0211; IL-12+IL-23+TGF-β: *P = 0.0206,**P = 0.0023) and IL-21+ cells (g) (IL-12: **P = 0.0068, **P = 0.0071; IL-23: **P < 0.0001, **P = 0.0012; TGF-β: *P = 0.0287,**P = 0.0096; IL-12+TGF-β: **P = 0.0023,*P = 0.0129; IL-23+TGF-β: *P = 0.0145,**P = 0.0044; IL-12+IL-23+TGF-β: **P = 0.0084,**P = 0.0082) differentiated from naïve CD4+ T cells with anti-CD3/CD28 stimulation and indicated cytokine combinations for 4 days (dots, n = 5; bars, mean ± SEM). Data from individuals (dots) and the median values (bars) are shown for (a); Mann–Whitney test was used for analysis (a). Percentages and numbers are shown for (b); Chi-Square test was used for analysis (b). Real-time PCR and FACS statistics are shown for individuals (dots, n = 3) and mean ± SEM (bars) values, and analysed by Mann–Whitney U-test (a, c), one-way ANOVA Dunnett’s multiple comparisons test (dg). *P < 0.05, **P < 0.01. Results are representative of three independent experiments.
Fig. 3
Fig. 3. LepR deficiency leads to impaired antibody responses after influenza virus infection.
a Real-time PCR analysis of nucleoprotein (Np) in lung tissues of WT (grey) and db/db (red) mice 9 days post H1N1 influenza viral infection (**P = 0.0007). b, c ELISA measurement of H1N1-specific IgG1, IgG2b, IgG2c and IgG3 in sera (b) (IgG1: *P = 0.0190, IgG2b: **P < 0.0001, IgG2c: *P = 0.0299, IgG3: *P = 0.0209) and BALF (c) (IgG1: **P = 0.0080, IgG2b: **P = 0.0036, IgG2c: **P = 0.0079, IgG3: **P = 0.0007). df Representative FACS plots and statistics showing CXCR5+Bcl6+ TFH cells (d) (*P = 0.0407), GL-7+Fas+ germinal centre (GC) B (e) (*P = 0.0240) and CD138high antibody-secreting cells (ASCs) (f) (*P = 0.0411) in mediastinal lymph nodes. g ELISPOT assay showing virus-specific ASCs in spleens. Data are shown for individuals (dots, n = 5 per genotype) and mean (bars) values, and analysed by Mann–Whitney U-test (af). *P < 0.05, **P < 0.01. Results are representative of three independent experiments.
Fig. 4
Fig. 4. Defective TFH cells responses in Cd4-Cre:LepRfl/fl mice after influenza virus infection.
ae Cd4-Cre:LepR+/+ mice (grey, n = 11) and Cd4-Cre:LepRfl/fl mice (red, n = 8) were infected with influenza virus A/X-31 (H3N2). Mediastinal lymph nodes were analysed at day 9 post-infection. Representative FACS plots and statistics showing the CD4+Foxp3-CD44high effector cells, CD4+Foxp3+ TREG cells (a), CD44+CXCR5+Bcl6+ TFH (b), (*P = 0.0499, *P = 0.0347), IL-21 production (c), (*P = 0.0313, *P = 0.0142), B220+GL-7+Fas+ GC B cells (d) (*P = 0.0151, *P = 0.0249) and B220-CD138+TACI+ ASCs (e) (*P = 0.0250, *P = 0.0409) 9 days post influenza viral infection. f Cd4-Cre:LepR+/+ and Cd4-Cre:LepRfl/fl mice were intranasally challenged with H1N1 influenza virus and virus-specific IgG1, IgG2b and IgG2c in sera were measured by ELISA 9 days post-infection (n = 7 per genotype) (IgG1: *P = 0.0183, IgG2b: *P < 0.0181, IgG2c: *P = 0.0168). Data are shown for individuals (dots) and mean (bars) values, and analysed by Mann–Whitney U-test (af). *P < 0.05, **P < 0.01. Results are representative of two independent experiments.
Fig. 5
Fig. 5. Leptin promotes IL-21 production in a STAT3-dependent manner.
a B220-CD4+CD25-CD44+CD62L-CXCR5+PD-1+ TFH cells (1 × 105) and B220+Fas+GL-7+ GC B cells (1 × 105) from 4-Hydroxy-3-nitrophenylacetyl hapten conjugated to ovalbumin (NP-OVA) immunized WT and db/db mice (9 dpi) were co-cultured with 5 µg/mL NP-OVA for 9 days. In the db/db TFH:WT B-cell culture, IL-21 (10 ng/mL) was added. Anti-NP IgG1 titers in the supernatant were measured by ELISA (IL-21_10 ng/mL: *P = 0.0403, WT: **P = 0.0033). b ELISA measurement of IL-21 in cultured naive CD4+ T cells from WT mice with anti-CD3/CD28 and leptin (0-200 ng/mL) stimulation for 3 days (100 ng/mL: **P = 0.0100, 200 ng/mL: **P = 0.0441). c Western blot showing Stat3 phosphorylation (p-Stat3) in WT naive CD4+ T cells stimulated with 200 ng/mL leptin for 2 h. Values showing the fold changes relative to the non-treated control. d Binding of Stat3 to the Il21 promoter. Stat3-ChIP assays were performed on WT naive CD4+ T cells treated with 200 ng/mL leptin for 3 h. Results showing PCR products (left) and values for the fold changes in ChIP enrichment relative to non-treated control (right) (100 ng/mL: **P = 0.0096, 200 ng/mL: **P = 0.0043). e Schematic of Il21 promoter construction and luciferase assay. f The transcriptional activity of the Il21 promoter. Dual-Luciferase reporter assay for the Il21 promoter in 293 T cells with 200 ng/mL leptin treatment for 12 h (100 ng/mL: **P = 0.0082, 200 ng/mL: **P = 0.0016). g Cd4-Cre:Stat3+/+ or Cd4-Cre:Stat3fl/fl naive CD4+ T cells were stimulated under IL-21-inducing conditions with 200 ng/mL leptin for 3 days. Results for IL-21 secretion showing representative FACS plots (left) and statistics (right) (nil: *P = 0.0111, Leptin: *P = 0.0144). Data are shown for individuals (dots) and mean (bars) values, and analysed by two-way ANOVA (a) one-way ANOVA (b, d, f) or Mann–Whitney U-test (g). *P < 0.05, **P < 0.01. Results are representative of three independent experiments.
Fig. 6
Fig. 6. Stat3 and mTOR are dispensable for leptin-induced TFH differentiation and Bcl6 expression.
a Real-time PCR analysis of mouse TFH-related genes in naïve CD4+ T cells from WT mice stimulated with anti-CD3/CD28 for 2 days, further treated with leptin for 12 h (Cxcr5: **P = 0.0029, Bcl6: **P = 0.0004, Il21: **P = 0.0007, Icos: **P = 0.0028, Cd40l: **P = 0.0023) (n = 5). b Representative FACS plots and statistics of CXCR5+PD-1+ TFH cells in cultured naïve CD4+ T cells from WT mice with anti-CD3/CD28 stimulation for 48 h, followed with or without leptin treatment for 12 h (Ratio: *P = 0.0200, GMFI: *P = 0.0243). ce Western blot assay of Bcl6 with or without anti-CD3/CD28 activation (c), the phosphorylation of Akt, mTOR, p70S6K and S6 (d) and Bcl6 expressions in WT naïve CD4+ T cells with Stat3 inhibition (S3I-201, 100 μM), mTOR inhibition (Rapamycin, 200 nM) plus leptin (200 ng/mL) treatment for 12 h (e). Values showing the fold changes relative to the non-treated control. f Representative FACS plots and statistics of PD-1+Bcl6+ TFH cells in cultured naïve CD4+ T cells from WT mice with anti-CD3/CD28 activation for 2 days, followed with Stat3 inhibition (S3I-201, 100 μM), mTOR inhibition (Rapamycin, 200 nM) plus leptin (200 ng/mL) treatment for 12 h (0 vs nil: **P = 0.0004, S3I vs 0: **P = 0.0023, Rapa vs 0: **P = 0.0026) (n = 5). g, h Representative FACS plots of PD-1+Bcl6+ TFH cells in cultured naïve CD4+ T cells from Cd4-Cre:Stat3fl/fl mice (g) and Cd4-Cre:Rictorfl/fl mice (h) with anti-CD3/CD28 activation for 2 days, followed with or without leptin (200 ng/mL) treatment for 12 h (n = 5). Data are shown for individuals (dots) and mean (bars) values, and analysed by Mann–Whitney U-test (a, b), or two-way ANOVA (f). *P < 0.05, **P < 0.01. Results are representative of three independent experiments.
Fig. 7
Fig. 7. Fasting impairs vaccination-mediated protection, which can be compensated by leptin replacement.
a WT female mice were immunized (s.c.) with human influenza vaccine, following various feeding regimens: normal diet (Fed) (n = 18, black line), fasting with PBS (Fast + PBS) (n = 18, red line), fasting with leptin treatment (Fast + leptin) (n = 19, cyan line); mice were intranasally challenged with H1N1 influenza virus and analysed 6 days post-infection. b Accumulative survival curve of mice after viral challenge (Fast + PBS vs Fed: *P = 0.0369). c ELISA measurement of H1N1-specific IgG1, IgG2b and IgG2c in sera (IgG1: **P = 0.0073, **P = 0.0076; IgG2b: *P = 0.0133, *P = 0.0258; IgG2c: *P = 0.0326, *P = 0.0252) and bronchoalveolar lavage fluid (BALF) (IgG1: *P = 0.0488, *P = 0.0240; IgG2c: *P = 0.0271, *P = 0.0481). df Representative FACS plots and statistics showing frequencies of GC B cells in B cells (d) (*P = 0.0446, *P = 0.0197) and ASCs in lymphocytes (e) (*P = 0.0261, **P = 0.0081), and TFH cells in CD44+Foxp3+ CD4+ T cells (f) (**P = 0.0022, *P = 0.0197) in the mediastinal lymph nodes 6 days post-infection. Data are shown for individual (dots, n = 7) and mean (bars) values, and analysed by Log-rank tests (b), two-way ANOVA (cf). *P < 0.05, **P < 0.01. Results are representative of two independent experiments.

Similar articles

Cited by

References

    1. Vinuesa CG, Linterman MA, Yu D, MacLennan IC. Follicular helper T cells. Annu. Rev. Immunol. 2016;34:335–368. doi: 10.1146/annurev-immunol-041015-055605. - DOI - PubMed
    1. Crotty S. T follicular helper cell differentiation, function, and roles in disease. Immunity. 2014;41:529–542. doi: 10.1016/j.immuni.2014.10.004. - DOI - PMC - PubMed
    1. Ma CS, et al. Functional STAT3 deficiency compromises the generation of human T follicular helper cells. Blood. 2012;119:3997–4008. doi: 10.1182/blood-2011-11-392985. - DOI - PMC - PubMed
    1. Ueno H, Banchereau J, Vinuesa CG. Pathophysiology of T follicular helper cells in humans and mice. Nat. Immunol. 2015;16:142–152. doi: 10.1038/ni.3054. - DOI - PMC - PubMed
    1. Deng J, et al. Signal transducer and activator of transcription 3 hyperactivation associates with follicular helper T cell differentiation and disease activity in rheumatoid arthritis. Front. Immunol. 2018;9:1226. doi: 10.3389/fimmu.2018.01226. - DOI - PMC - PubMed

Publication types