Meta-Analysis
. 2021 May 24;12(1):3063.
doi: 10.1038/s41467-021-23265-y.

Identification of microbial markers across populations in early detection of colorectal cancer

Affiliations
Meta-Analysis

Identification of microbial markers across populations in early detection of colorectal cancer

Yuanqi Wu et al. Nat Commun. .

Abstract

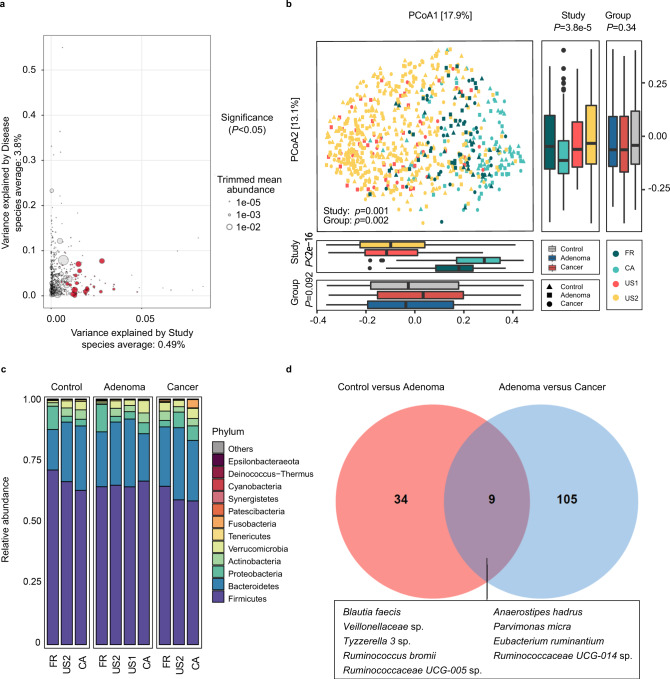
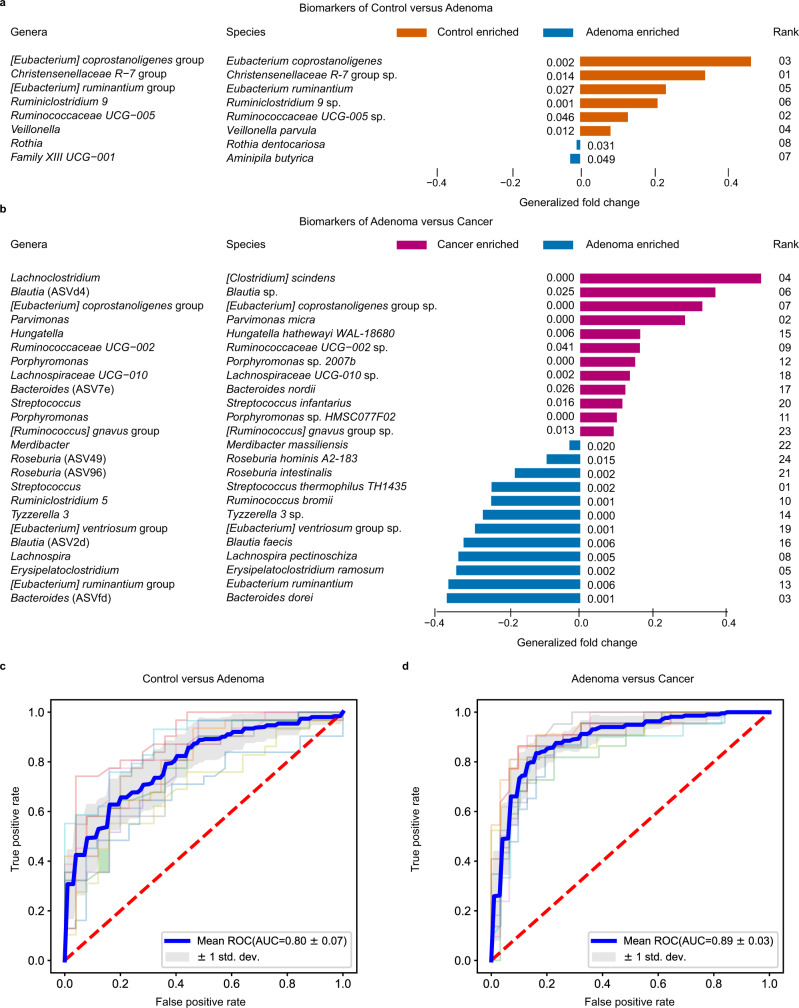
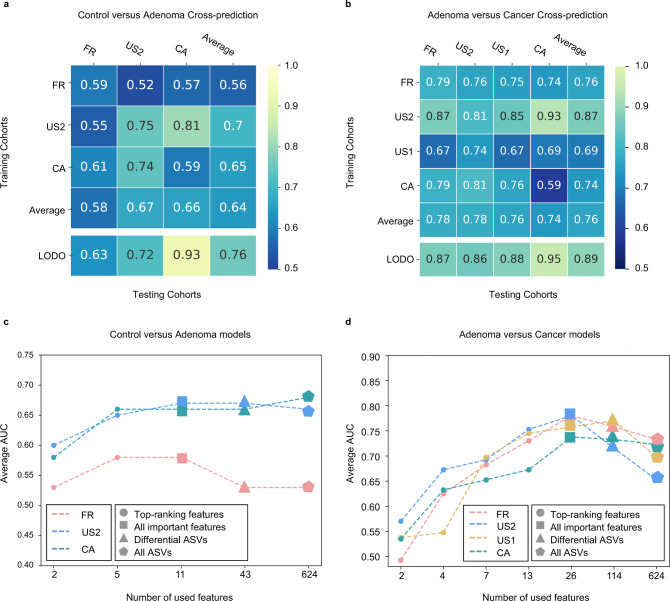
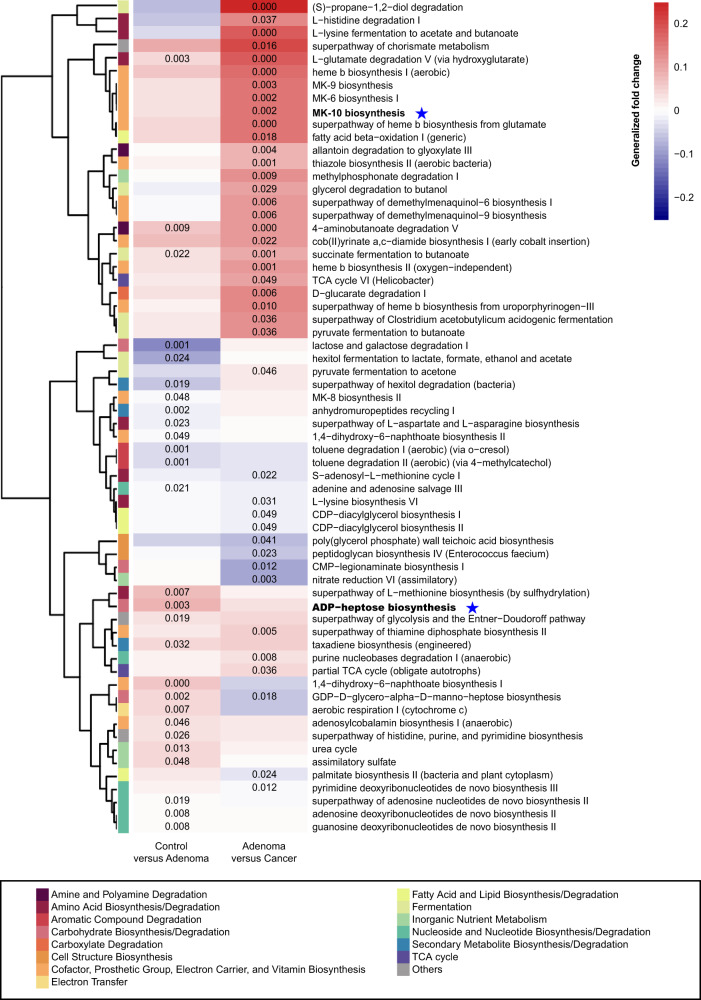
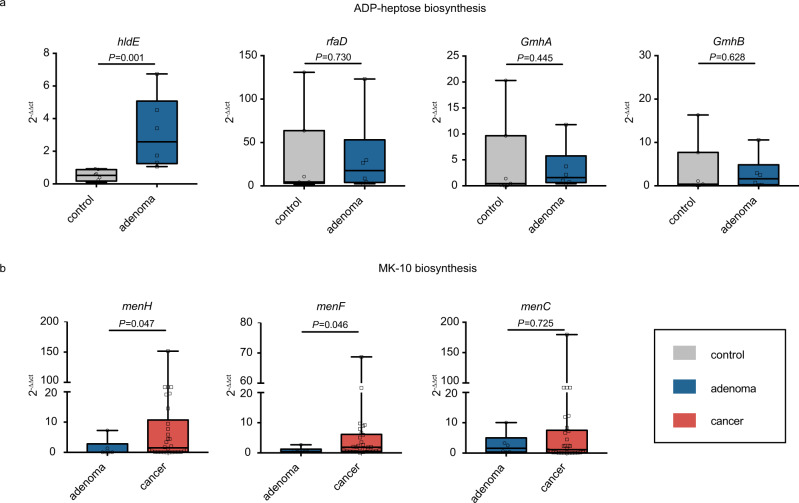
Associations between gut microbiota and colorectal cancer (CRC) have been widely investigated. However, the replicable markers for early-stage adenoma diagnosis across multiple populations remain elusive. Here, we perform an integrated analysis on 1056 public fecal samples, to identify adenoma-associated microbial markers for early detection of CRC. After adjusting for potential confounders, Random Forest classifiers are constructed with 11 markers to discriminate adenoma from control (area under the ROC curve (AUC) = 0.80), and 26 markers to discriminate adenoma from CRC (AUC = 0.89), respectively. Moreover, we validate the classifiers in two independent cohorts achieving AUCs of 0.78 and 0.84, respectively. Functional analysis reveals that the altered microbiome is characterized with increased ADP-L-glycero-beta-D-manno-heptose biosynthesis in adenoma and elevated menaquinone-10 biosynthesis in CRC. These findings are validated in a newly-collected cohort of 43 samples using quantitative real-time PCR. This work proves the validity of adenoma-specific markers across multi-populations, which would contribute to the early diagnosis and treatment of CRC.


Conflict of interest statement

The authors declare no competing interests.

Figures

Fig. 1
Fig. 1. Alterations of gut microbial composition in different disease status.
a Variance explained by disease status (adenoma versus cancer) is plotted against variance explained by study effects for individual ASVs. The significantly differential ASVs are colored in red and the dot size is proportional to the abundance of each ASV. P values were from a two-sided blocked Wilcoxon rank-sum test. Source data and exact P values are provided as a Source Data file. b Principal coordinate analysis of samples (control, n = 252; adenoma, n = 306; cancer, n = 217) from all four studies based on Bray–Curtis distance, which shows the fecal microbiota composition was different among studies (P = 0.001) and groups (P = 0.002). P values of beta diversity based on Bray–Curtis distance were calculated with PERMANOVA. The study is color-coded and the group (control, adenoma, and cancer) is indicated by different shapes. The upper-right and the bottom-left boxplots illustrate that samples projected onto the first two principal coordinates broken down by study and disease status, respectively. P values of the first and second principal components were calculated with a two-sided Kruskal–Wallis test for study and group. All boxplots represent the 25th–75th percentile of the distribution; the median is shown in a thick line at the middle of the box; the whiskers extend up to values within 1.5 times of IQR, and outliers are represented as dots. Source data are provided as a Source Data file. c Relative proportions of bacterial phyla in healthy controls, adenomas, and CRC across four different studies. d Venn diagram shows the overlap of differential ASVs assigned at species level between adenomas and healthy controls or CRC.
Fig. 2
Fig. 2. Performance of discriminating adenoma from control or cancer using important features.
a, b, The biomarkers were identified to construct RF models for discriminating adenoma from control (a) and CRC (b). Each biomarker represented a single ASV, and the genera and species columns displayed the taxonomy information for the ASVs at the genus and species level. The rank in a and b indicates the order of feature importance in the RF model; P values were computed using a two-sided blocked Wilcoxon rank-sum test and the exact P values were presented beside the barplots. Generalized fold change (see Methods meta-analysis of differentially abundant ASVs) was indicated by color gradients. Source data are provided as a Source Data file. c, d The AUC of the optimized models constructed with biomarkers and patient metadata of control versus adenoma (c) and adenoma versus cancer (d). Mean AUC and standard deviation of stratified 10-fold cross-validation were shown in c and d.
Fig. 3
Fig. 3. Prediction performance of important features across studies and identification of minimal features for detecting adenoma.
a, b, Cross-prediction matrix detailing prediction values for differentiating adenoma from control using bagging K-Nearest Neighbors classifiers (a) and CRC using RF models (b) as AUC obtained using important features. Values on the diagonal refer to the results of cross-validation within each study. Off-diagonal values refer to the AUC values obtained from cross-cohort validation, which training the classifier on the study of the corresponding row and applying it to the study of the corresponding column. The LODO values refer to the performances obtained by training the classifier using all but the study of the corresponding column and applying it to the study of the corresponding column (see “Model evaluation” section). The study-to-study and LODO validation values for differentiating adenoma from control using RF models can be found at Supplementary Fig. 9. c, d Average AUC of study-to-study transfer validation classifiers for control versus adenoma (c) and adenoma versus cancer (d) with different sets of features. Input features were indicated as different shapes, top-ranking features, all important features signed, differential ASVs and all ASVs were represented by circles, squares, triangles, and pentagons, respectively. The x axis in c and d indicate different numbers of features. Colors represent different studies. Source data are provided as a Source Data file.
Fig. 4
Fig. 4. Functional alterations in control, adenoma, and cancer.
The relative abundances of functional pathways were compared between adenoma and control or cancer. Differentially abundant pathways were plotted; P values were computed using a two-sided blocked Wilcoxon rank-sum test and the exact P values < 0.05 were presented in the heatmap. Generalized fold change (see “Meta-analysis of differentially abundant ASVs” section) was indicated by color gradients. The generalized fold change > 0: enriched in the latter; generalized fold change < 0: enriched in the former. Source data are provided as a Source Data file.
Fig. 5
Fig. 5. Relative abundance of candidate genes.
Plotted values are qRT-PCR quantifications of bacterial genes in the ADP-heptose and MK-10 biosynthesis. The abundances of a hldE, rfaD, GmhA, and GmhB were compared between control (n = 7) and adenoma (n = 6) groups, while the abundances of b menH, menF, and menC were compared between adenoma (n = 6) and cancer (n = 30) groups. All boxes extend from 25th to 75th percentiles and whiskers show the minimum and maximum values. Lines at the middle of each box show the median. P values were computed using a two-sided Wilcoxon rank-sum test. Source data are provided as a Source Data file.

References

    1. Bray F, et al. Global cancer statistics 2018: GLOBOCAN estimates of incidence and mortality worldwide for 36 cancers in 185 countries. CA Cancer J. Clin. 2018;68:394–424. doi: 10.3322/caac.21492. - DOI - PubMed
    1. Wong SH, Yu J. Gut microbiota in colorectal cancer: mechanisms of action and clinical applications. Nat. Rev. Gastroenterol. Hepatol. 2019;16:690–704. doi: 10.1038/s41575-019-0209-8. - DOI - PubMed
    1. Mariotto AB, Yabroff KR, Shao Y, Feuer EJ, Brown ML. Projections of the cost of cancer care in the United States: 2010–2020. J. Natl Cancer Inst. 2011;103:117–128. doi: 10.1093/jnci/djq495. - DOI - PMC - PubMed
    1. Liang JQ, et al. A novel faecal Lachnoclostridium marker for the non-invasive diagnosis of colorectal adenoma and cancer. Gut. 2020;69:1248–1257. doi: 10.1136/gutjnl-2019-318532. - DOI - PMC - PubMed
    1. Ren ZG, et al. Gut microbiome analysis as a tool towards targeted non-invasive biomarkers for early hepatocellular carcinoma. Gut. 2019;68:1014–1023. doi: 10.1136/gutjnl-2017-315084. - DOI - PMC - PubMed

Publication types