. 2021 May 24;12(1):3068.
doi: 10.1038/s41467-021-23138-4.

The role of drop shape in impact and splash

Affiliations

The role of drop shape in impact and splash

Qingzhe Liu et al. Nat Commun. .

Abstract

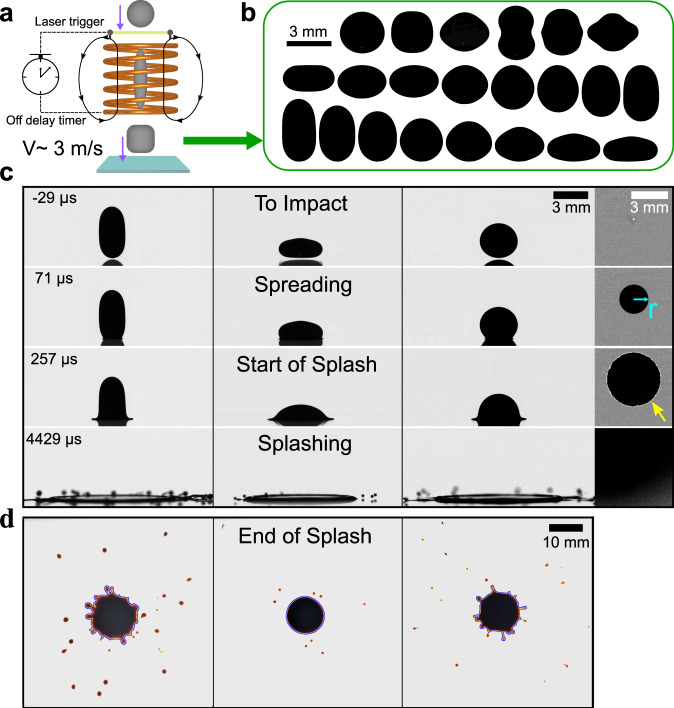
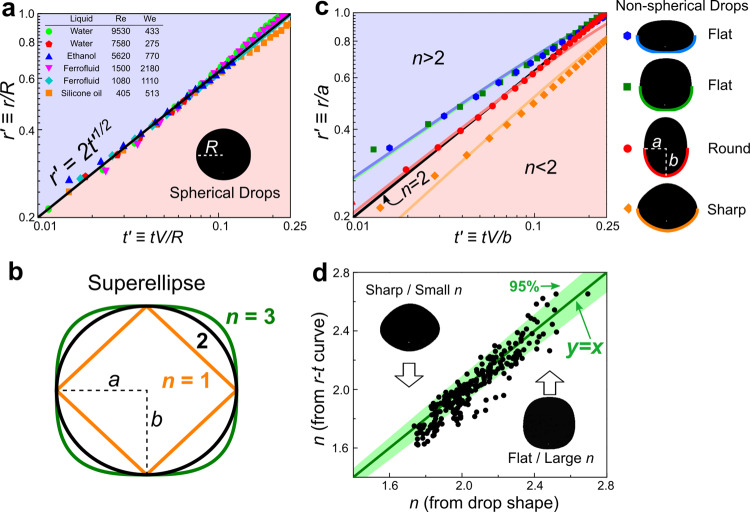
The impact and splash of liquid drops on solid substrates are ubiquitous in many important fields. However, previous studies have mainly focused on spherical drops while the non-spherical situations, such as raindrops, charged drops, oscillating drops, and drops affected by electromagnetic field, remain largely unexplored. Using ferrofluid, we realize various drop shapes and illustrate the fundamental role of shape in impact and splash. Experiments show that different drop shapes produce large variations in spreading dynamics, splash onset, and splash amount. However, underlying all these variations we discover universal mechanisms across various drop shapes: the impact dynamics is governed by the superellipse model, the splash onset is triggered by the Kelvin-Helmholtz instability, and the amount of splash is determined by the energy dissipation before liquid taking off. Our study generalizes the drop impact research beyond the spherical geometry, and reveals the potential of using drop shape to control impact and splash.


Conflict of interest statement

The authors declare no competing interests.

Figures

Fig. 1
Fig. 1. Experimental setup and typical impact events by different shaped drops.
a A schematics of our setup (not in scale). A free-falling ferrofluid drop first passes through a magnetic coil, which stretches the drop into a long spindle-like shape. The magnetic field is then turned off and the falling drop starts to oscillate across many different shapes due to surface tension. The timing of turning off the magnetic field is precisely controlled by a laser trigger and an off-delay timer. By fine-tuning the turn-off time of magnetic field, we realize different drop shapes at the impact moment. b Examples of drop cross-sectional shapes, in 3D they are axisymmetric around the vertical central axis. c Side-view snapshots of impact events by three typical shapes: elongated (column 1), flattened (column 2), and spherical (column 3) drops. They have the same impact velocity, V = 2.9 ± 0.2 m/s. Column 4 shows the bottom view of column 3. The cyan arrow indicates the radial position of contact line, r. The yellow arrow indicates the bright interference pattern due to the liquid sheet flying off the substrate, whose first appearance indicates the onset of splash. d Corresponding splatter patterns of the three drops in (c), which indicate the amount of splash. The blue curve shows the border between the parent drop and the satellite droplets.
Fig. 2
Fig. 2. The spreading dynamics explained by a superellipse model.
a Dimensionless spreading radius versus time for spherical drops. The experimental data agree excellently with the theoretical scaling law, r’=2t’1/2 (the thick black line), for various liquids (including the ferrofluid) and impact velocities. b The superellipse model. We construct a general model by fitting a non-spherical shape to a superellipse: n = 2 is defined as ‘round’, n < 2 is defined as ‘sharp’, and n > 2 is defined as ‘flat’. n is defined as the sharpness, a and b are the semi-major and semi-minor axes. c Verifying the superellipse model with four non-spherical drop shapes. The colored symbols are experimental data for different shapes, and the colored curves are predictions from the superellipse model, Eq. (3), without any fitting parameter. Four examples are shown: two n > 2 or ‘flat’ examples are on the top, one n = 2 or “round” example is in the middle, and one n < 2 or “sharp” example is at the bottom. The two “flat” examples have distinct outlooks: one is disc-like and the other is square-shaped (see the images at right). However, they exhibit almost identical spreading dynamics due to their similar sharpness n (blue and green symbols). The right panel shows the drop images and the colored curves at the bottom are the superellipse fittings. d A comprehensive test on our model with many drop shapes. X-axis is the n values directly measured from the drop shape before impact (Eq. (2)). Y-axis is the n values obtained by fitting spreading dynamics to the superellipse model (Eq. (3)) after impact. Two sets of data are mostly within 95% confidence interval, which demonstrates an excellent agreement.
Fig. 3
Fig. 3. The onset of splash explained by the Kelvin–Helmholtz instability criterion.
a Zoomed-in snapshots at the moment of splash onset for three typical shapes at the same impact velocity, V = 2.9 ± 0.2 m/s. Clearly a longer drop with a larger L has a smaller splash onset location Ronset. The red arrows indicate how we measure the liquid sheet thickness, h. The inset shows a zoomed-out image. b The splash onset location, Ronset, versus the dimensionless drop length, L/D, with D the diameter of an equivalent sphere. An exponential relation, Ronset ∝ exp(−0.37 L/D), appears. Inset: The splash onset time tonset also varies significantly with shape. c Spreading velocity versus time, vs(t), for the three typical shapes shown in (a). Although the three curves initially differ significantly, their last data points, vonset, are very close. d The splash onset velocities, vonset, for various shapes. They stay close to an average value, 4.1 ± 0.5 m/s, indicated by the horizontal line. e The splash onset data for various shapes agree well with the general criterion: km h ~1. Here km is the wave number of the fastest growing mode of Kelvin–Helmholtz (KH) instability in the Knudsen regime. The horizontal line indicates the mean of our data, 0.9. Some large deviations may come from the limited spatial resolution of our camera in the h measurements (see Supplementary Fig. 7).
Fig. 4
Fig. 4. The amount of splash explained by an energy dissipation model.
a The total area of splatter stains, A, versus the dimensionless drop length, L/D, in log-linear scale. D is the diameter of an equivalent sphere with the same volume. The error bars represent standard deviations. We find an exponential increase of splash amount with respect to the dimensionless length, A ∝ exp(1.10 L/D). b Schematics showing the energy Edis dissipated in the spreading liquid sheet due to strong viscous shear before taking off. Here μ is the liquid viscosity, vs is the spreading velocity, h is the liquid film thickness and Ronset is the onset radius of splash. c Total area of splatter stains, A, versus the splash onset location, Ronset, in log-log scale. The error bars represent standard deviations. The data agree with the power law, ARonset3, predicted by the energy dissipation model.

Similar articles

Cited by

References

    1. Yarin AL. Drop impact dynamics: splashing, spreading, receding, bouncing…. Annu. Rev. Fluid Mech. 2006;38:159–192. doi: 10.1146/annurev.fluid.38.050304.092144. - DOI
    1. Josserand C, Thoroddsen ST. Drop impact on a solid surface. Annu. Rev. Fluid Mech. 2016;48:365–391. doi: 10.1146/annurev-fluid-122414-034401. - DOI
    1. Lo HY, Liu Y, Xu L. Mechanism of contact between a droplet and an atomically smooth substrate. Phys. Rev. X. 2017;7:021036.
    1. de Ruiter J, Soto D, Varanasi KK. Self-peeling of impacting droplets. Nat. Phys. 2018;14:35–39. doi: 10.1038/nphys4252. - DOI
    1. Wang Y, Dandekar R, Bustos N, Poulain S, Bourouiba L. Universal rim thickness in unsteady sheet fragmentation. Phys. Rev. Lett. 2018;120:204503. doi: 10.1103/PhysRevLett.120.204503. - DOI - PubMed

LinkOut - more resources