. 2021 May 24;12(1):3033.
doi: 10.1038/s41467-021-23258-x.

Identifying molecules as biosignatures with assembly theory and mass spectrometry

Affiliations

Identifying molecules as biosignatures with assembly theory and mass spectrometry

Stuart M Marshall et al. Nat Commun. .

Abstract

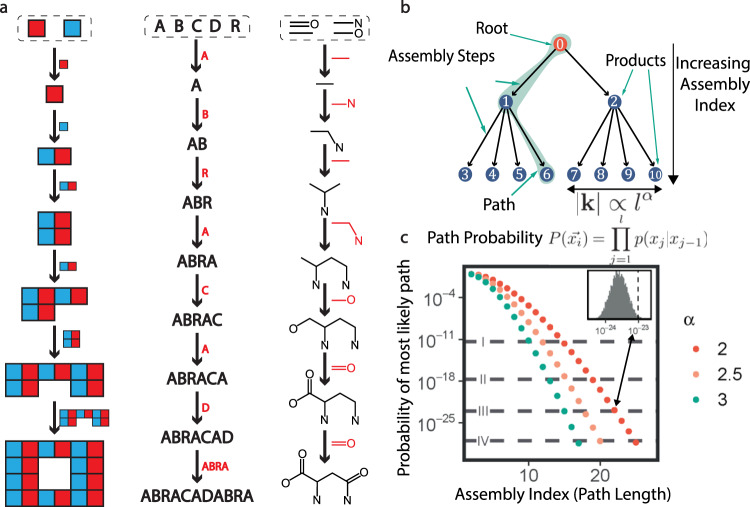
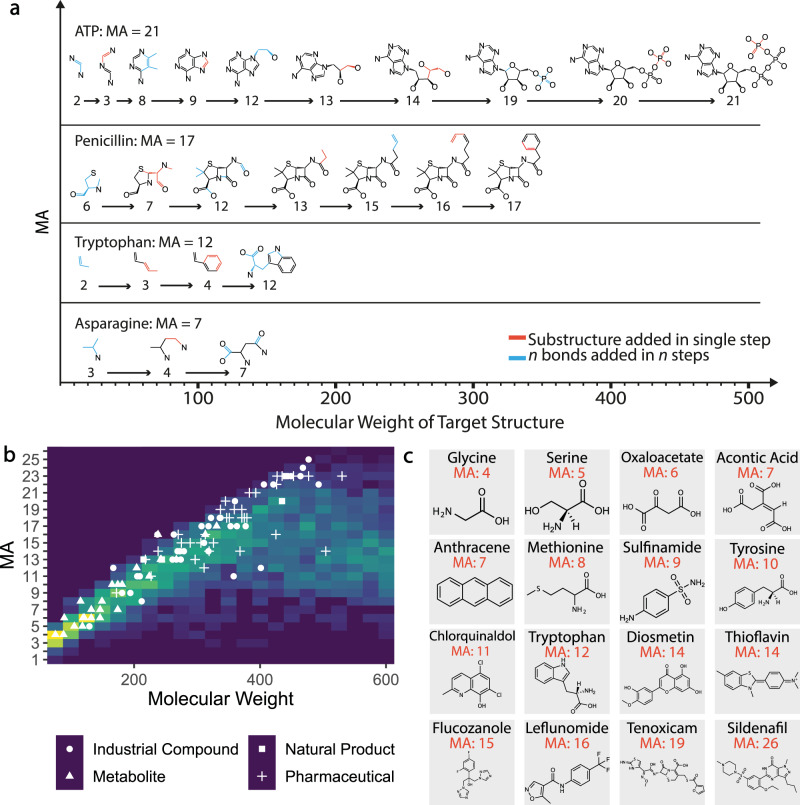
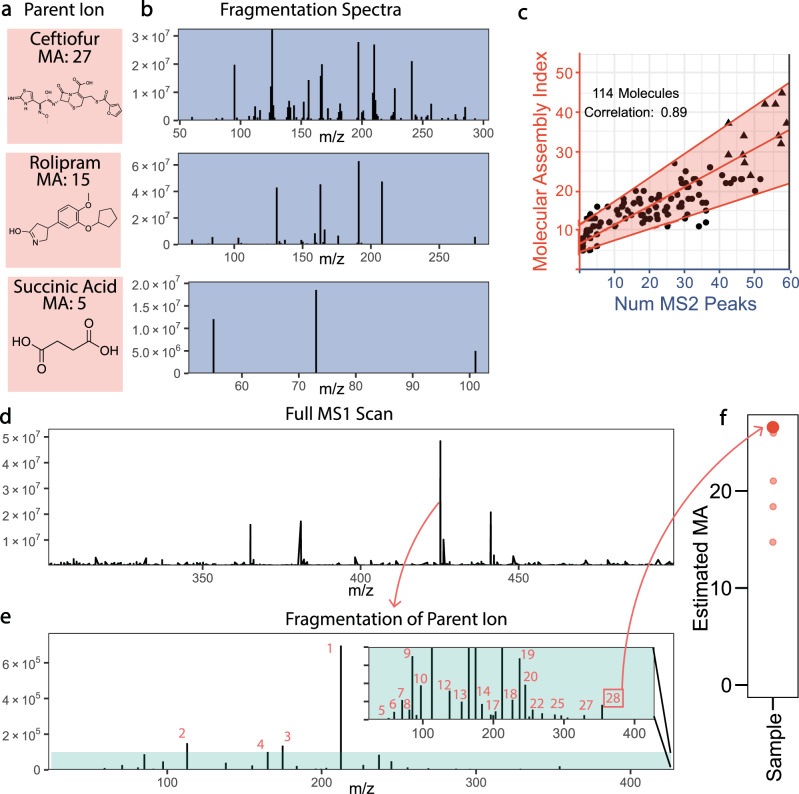
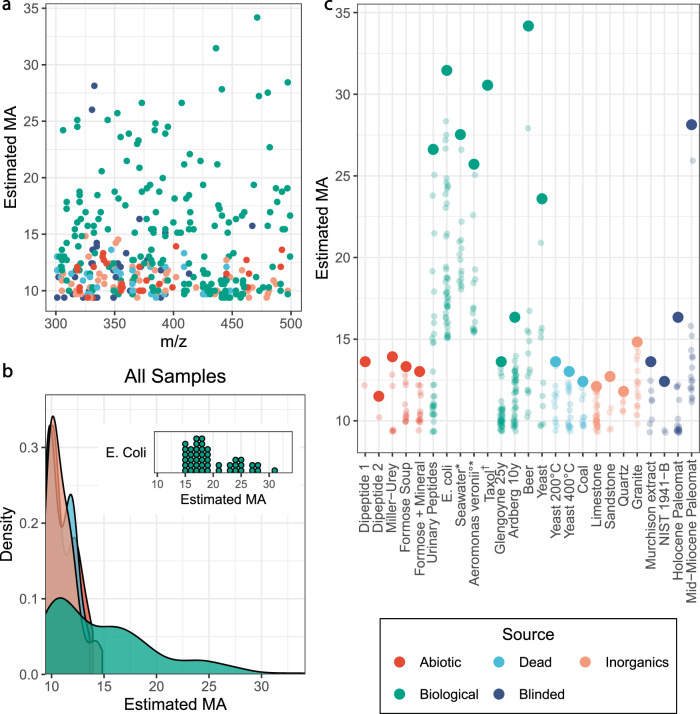
The search for alien life is hard because we do not know what signatures are unique to life. We show why complex molecules found in high abundance are universal biosignatures and demonstrate the first intrinsic experimentally tractable measure of molecular complexity, called the molecular assembly index (MA). To do this we calculate the complexity of several million molecules and validate that their complexity can be experimentally determined by mass spectrometry. This approach allows us to identify molecular biosignatures from a set of diverse samples from around the world, outer space, and the laboratory, demonstrating it is possible to build a life detection experiment based on MA that could be deployed to extraterrestrial locations, and used as a complexity scale to quantify constraints needed to direct prebiotically plausible processes in the laboratory. Such an approach is vital for finding life elsewhere in the universe or creating de-novo life in the lab.


Conflict of interest statement

The authors declare no competing interests.

Figures

Fig. 1
Fig. 1. Assembly pathways.
a In analyzing the assembly pathways of an object, we start with its basic building blocks, which are the shared set of objects that can construct our target object and any other object within the class of objects. The Assembly index of an object is defined as the smallest number of joining operations required to create the object using this model. b We can model the assembly process as a random walk on weighted trees where the number of outgoing edges (leaves) grows as a function of the depth of the tree, due to the addition of previously made sub-structures. By generating several million trees and calculating the likelihood of the most likely path through the tree, we can estimate the likelihood of an object forming by chance as a function of the number of joining operations required (path length). c The probability of the most likely path through the tree as a function of the path length decreases rapidly. The colors indicate different assumptions about the chemical space. For comparison, the dashed lines indicate the ratio of (I) one star in the entire milky way, 1:1011, (II) one gram out of all of Earth’s biomass, 1:1017, (III) one in a mole, 1:1023, and (IV) one gram out of Earth’s mass (1:1029). Note on this plot the path probability of the formation of Taxol would vary between 1:1035 to 1:1060 with a path length of 30 and the amount of chemical predisposition is varied with alpha biasing the effective selectivity between 50–99.9% at each step respectively.
Fig. 2
Fig. 2. Molecular assembly and chemical space.
a Schematic of assembly paths for four example molecules (hydrogens and charges omitted for clarity). b The computed MA of molecules from the Reaxys database shown by molecular weight. The color scale indicates the frequency, with increasing frequency from dark purple (0.0) to green and yellow (1.0) of molecules in a given molecular weight range with a given MA. 2.5 million MA were calculated, in the figure shown here that data has been subsampled to control for bias, see SI. The overlaid plot with the white labels shows how the MA varies for some compound types where some natural products, pharmaceuticals, and metabolites have a wide range of values (these molecules are listed in Supplementary Information Section 7, table 2). Note that the range of MA for the amino acids is limited. The molecular masses are binned in 50 Dalton sections. c Example organic molecular structures and the corresponding MA values calculated.
Fig. 3
Fig. 3. Experimental correlation of mass spectrometry data to MA and MA analysis of mixtures.
a Three example molecular structures with associated MA index. b The fragmentation spectra associated with the molecular ions from (A). The high MA molecules have more peaks in their fragmentation spectra. c The observed correlation between the number of peaks in a fragmentation spectrum and the MA value of the ion, the shaded region shows the 90% prediction interval using quantile regression, with the median prediction shown in the center line. The circles represent small organics while triangles represent peptides. D-F indicate analytical workflow for measuring MA in mixtures. d A single ion is selected based on intensity. e MS2 spectra from the selected ion, with the inset showing the same spectra zoomed in on the shaded region to show lower intensity peaks. The total number of peaks in the fragmentation spectra are counted to correlate with the MA. f Many ions from the mixture will be fragmented and the predicted MA from that sample form a distribution, we consider the highest MA value measured to represent the MA of the mixture.
Fig. 4
Fig. 4. Estimated MA of laboratory and environmental samples.
a The estimated MA against the parent mass of many ions for different samples in the 300–500 m/z range (excluding Taxol with has a m/z value of 854.9). b The distributions of estimated MA for all samples split by category, colored by source, the inset shows the distribution of points for a single biological sample, E. Coli. The MA of biological samples has a wider distribution, showing that only biologically produced samples produce MA above a certain threshold. c The estimated MA values for each sample with the blinded identities correctly labeled. The highest MA value in each sample is bold and the lower values faded. Each sample may have more than 15 points due to the dynamic exclusion settings used, which enable us to collect more MS2 peaks. Samples may have less than 15 points due to excluding noisy or unreliable spectra, for more information see Supplementary Information Section 5. *These samples were run with a column attached to the mass spectrometry but no chromatographic method was used. °This sample was gathered from an online database and analyzed with a different instrument. † Taxol is shown in Fig. 4C but has a mass that is not shown in Fig. 4A or 5B. See Supplementary Information Section 6 for details.

Similar articles

Cited by

References

    1. Ballou EV, Wood PC, Wydeven T, Lehwalt ME, Mack RE. Chemical interpretation of Viking Lander 1 life detection experiment. Nature. 1978;271:644–645. doi: 10.1038/271644a0. - DOI
    1. Schwieterman EW, et al. Exoplanet biosignatures: a review of remotely detectable signs of life. Astrobiology. 2018;18:663–708. doi: 10.1089/ast.2017.1729. - DOI - PMC - PubMed
    1. Selsis, F., Despois, D. & Parisot, J. P. Signature of life on exoplanets: can Darwin produce false positive detections? Astron. and astrophys.388, 985–1003 (2002).
    1. Gentry DM, et al. Correlations between life-detection techniques and implications for sampling site selection in planetary analog missions. Astrobiology. 2017;17:1009–1021. doi: 10.1089/ast.2016.1575. - DOI - PMC - PubMed
    1. Lovelock JE. A physical basis for life detection experiments. Nature. 1965;207:568–570. doi: 10.1038/207568a0. - DOI - PubMed

Publication types