. 2021 May 24;12(1):3077.
doi: 10.1038/s41467-021-23405-4.

Fast widefield scan provides tunable and uniform illumination optimizing super-resolution microscopy on large fields

Affiliations

Fast widefield scan provides tunable and uniform illumination optimizing super-resolution microscopy on large fields

Adrien Mau et al. Nat Commun. .

Abstract

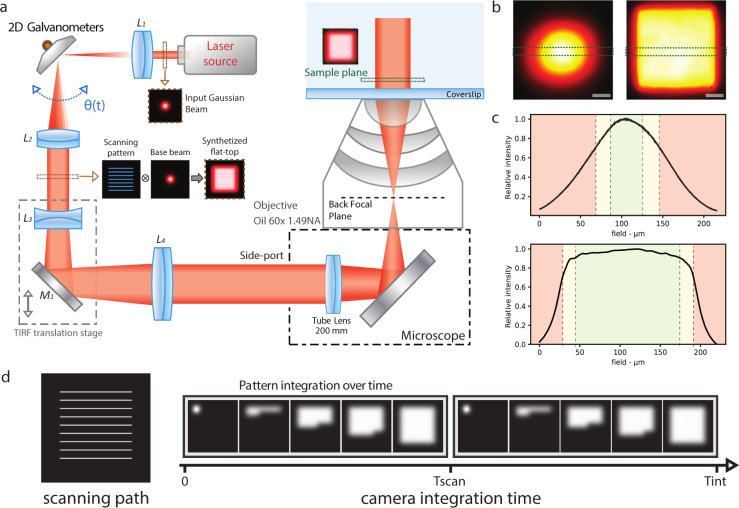
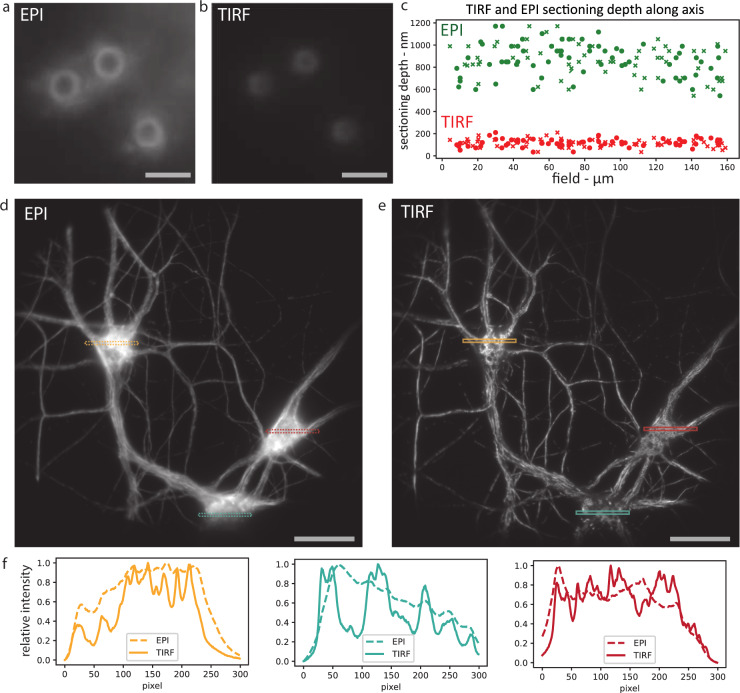
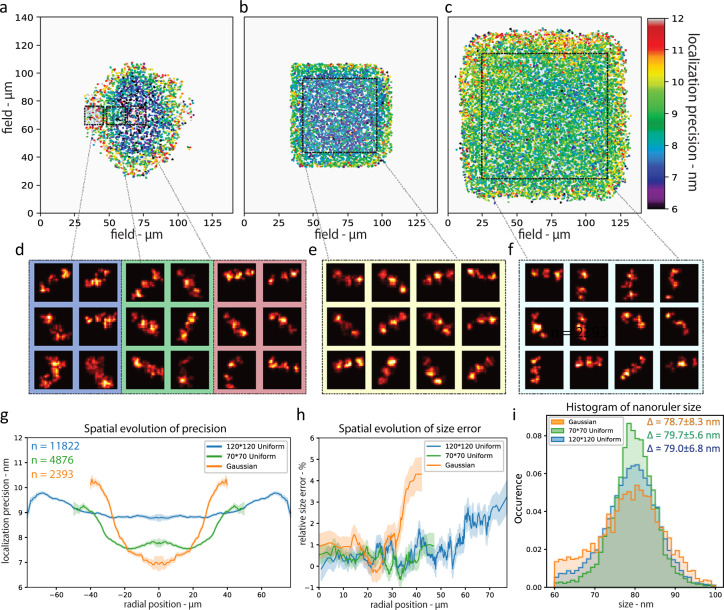
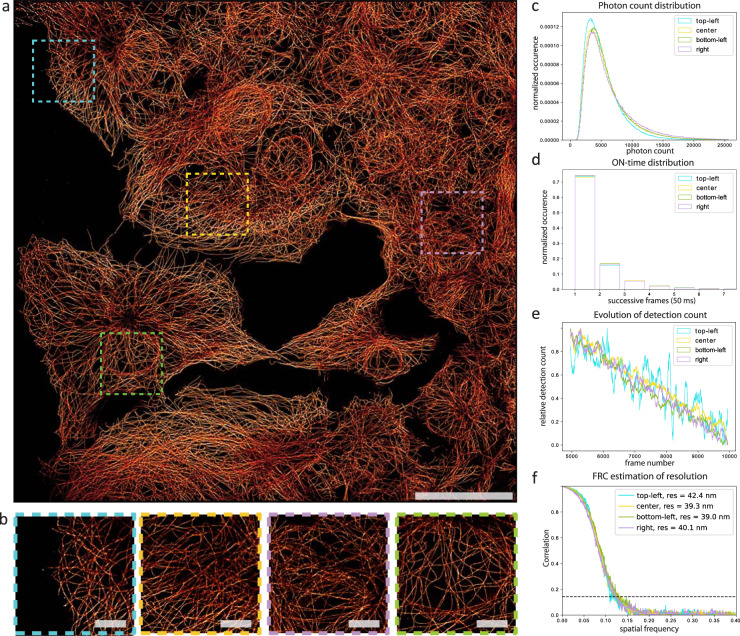
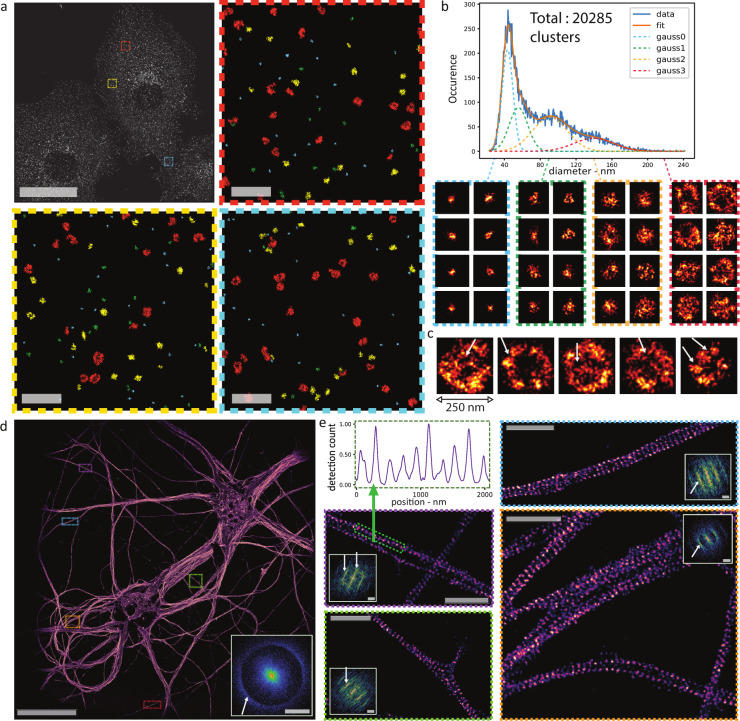
Non-uniform illumination limits quantitative analyses of fluorescence imaging techniques. In particular, single molecule localization microscopy (SMLM) relies on high irradiances, but conventional Gaussian-shaped laser illumination restricts the usable field of view to around 40 µm × 40 µm. We present Adaptable Scanning for Tunable Excitation Regions (ASTER), a versatile illumination technique that generates uniform and adaptable illumination. ASTER is also highly compatible with optical sectioning techniques such as total internal reflection fluorescence (TIRF). For SMLM, ASTER delivers homogeneous blinking kinetics at reasonable laser power over fields-of-view up to 200 µm × 200 µm. We demonstrate that ASTER improves clustering analysis and nanoscopic size measurements by imaging nanorulers, microtubules and clathrin-coated pits in COS-7 cells, and β2-spectrin in neurons. ASTER's sharp and quantitative illumination paves the way for high-throughput quantification of biological structures and processes in classical and super-resolution fluorescence microscopies.


Conflict of interest statement

N.B. and S.L.F. are shareholders in Abbelight. Other authors declare no competing interests.

Figures

Fig. 1
Fig. 1. Schematic of ASTER and resulting illumination patterns.
a Simplified schematic of ASTER setup generating a homogeneous field using a raster scanning pattern. Li are lenses with focal length fi: f1 = 100, f2 = 100, f3 = −35, f4 = 250. M1 is a dielectric mirror. A small input Gaussian base beam is scanned in-between the L1 and L2 lenses, resulting in a collimated flat-top profile, which then goes through a TIRF translation stage and is magnified between L3 and L4. After focalization at the BFP of an objective lens, it results in a temporally averaged flat-top excitation profile at the sample. b Thin layer of fluorescent Nile Blue imaged at low laser power with a fixed Gaussian excitation beam (left) and with ASTER (right) raster scanning excitation. Scalebars 40 µm. c intensity profiles from b of Gaussian (up) and ASTER (bottom) illuminations taken along the green dashed area. Dashed lines and colors indicate the field ranges in which intensity is above 90% (green), between 70 and 90% (yellow) or below 70% (red) of its maximum value. d Scanning path (left) and generation of the uniform profile over temporal acquisition of the camera. (right). With Tint the camera integration time, the example of a scanning period Tscan = Tint/2 is shown.
Fig. 2
Fig. 2. ASTER TIRF illumination.
Illumination of 3 µm beads with focus at the coverslip, in ASTER epifluorescence (EPI, a) and ASTER TIRF (b) illuminations (whole images are shown in Supplementary Fig. 6). Scalebars 4 µm. c Measured sectioning depth for 67 individual beads in EPI (green) and TIRF (red) illuminations on a large 160 µm × 160 µm FOV. Cross and circle markers, respectively, denote measurement along the x and y axis of the sample plane. In total, 200 µm × 200 µm imaging FOV of neurons labeled with an anti-β2-spectrin primary and an AF647-coupled secondary antibody, illuminated with raster scanning ASTER, with a scanning period of 50 ms and an exposure time of 100 ms, in either classical epifluorescence (d) or TIRF (e) illumination schemes. Scalebars 40 µm. f Normalized EPI and TIRF profiles of each colored area in d and e.
Fig. 3
Fig. 3. Nanorulers imaging for localization precision estimation.
DNA-PAINT imaging of 40 nm spaced 3 spots nanorulers, obtained with Gaussian (a, d), ASTER small field of view (70 µm × 70 µm, b, e), and ASTER large field of view (120 µm × 120 µm, c, f) illuminations. ac are resulting localization precision maps where each point represents the average precision for one individual nanoruler (3 spots). df are nanoruler super-resolution images (150 nm × 150 nm), taken randomly from highlighted areas in ac. g Mean localization precision along FOV radius for each excitation scheme (symmetrized). The number of nanoruler for each excitation scheme is indicated in a similar color. For each colored curve, the surrounding transparent curve indicates the standard deviation around the mean precision at a given radius. h Resulting size estimation error along FOV radius for each excitation scheme. A size error above 0 indicates that the nanoruler spots were measured <80 nm apart. Each colored curve is surrounded by a transparent curve that indicates the standard deviation around the mean size. i Resulting size measurement histogram for each excitation scheme. The mean and the standard deviation for the size (symbolized by Δ) are indicated in the upper right corner.
Fig. 4
Fig. 4. STORM imaging using ASTER.
a ASTER STORM imaging of COS-7 cells labeled for microtubules and an AF647-coupled secondary antibody, FOV size 200 µm × 200 µm, 20,000 frames at 20 fps. Excitation consisted in a ten-line scan with a laser power of 250 mW at the BFP, a gap of 1.4σ and a 25 ms scanning period. Scalebar 50 µm. b Zoomed views of highlighted areas in a. Scalebars 10 µm. c Photon count distribution histogram for highlighted areas in a. d Blinking ON-time distribution for highlighted areas in a, expressed in number of successive frames (50 ms camera integration time). e Temporal evolution of detection count for highlighted areas in a. f FRC estimation of resolution for highlighted areas in a.
Fig. 5
Fig. 5. ASTER applications for single-molecule localization microscopy.
ac ASTER STORM imaging and cluster analysis of COS-7 cells labeled for clathrin heavy-chain and an AF647-coupled secondary antibody. a Final 140 µm × 140 µm image with scalebar 40 µm (top left) and close-up views of the highlighted regions (colors encode cluster affiliation) with scalebars 1 µm. Pixel size is 10 nm. b shows the distribution of the diameter of clathrin clusters and highlights four potential populations, that can be fitted with Gaussian functions. Below are 250 nm × 250 nm images of individual clathrin related clusters, each group corresponding to a specific population. c shows 250 nm × 250 nm images of large, hollow clathrin clusters likely corresponding to large clathrin-coated pits. Visible cavities are highlighted by arrows. d, e ASTER STORM imaging and structural analysis of neurons labeled for β2-spectrin and AF647-coupled secondary antibody. d 200 µm × 200 µm STORM image obtained with ASTER (30 nm pixel size). Scalebar 40 µm. The two-dimensional Fourier transformation (inset) exhibits a circular frequency pattern corresponding to a ~190 nm periodicity of the staining that is present along all axons. e Zoomed views of regions in d revealing the periodic cytoskeleton along single axons (pixel size is 10 nm). Upper left image shows the intensity profile along the highlighted green line, revealing again the 190 nm periodicity. Scalebars 2 µm. For d, e, insets show the respective two-dimensional Fourier transformation and the known 190 nm periodicity of the axonal spectrin scaffold is highlighted by arrows. All Fourier images scalebars are 4 µm−1.

Similar articles

Cited by

References

    1. Tokunaga M, Imamoto N, Sakata-Sogawa K. Highly inclined thin illumination enables clear single-molecule imaging in cells. Nat. Methods. 2008;5:159–161. doi: 10.1038/nmeth1171. - DOI - PubMed
    1. Nakata T, Hirokawa N. Microtubules provide directional cues for polarized axonal transport through interaction with kinesin motor head. J. Cell Biol. 2003;162:1045–1055. doi: 10.1083/jcb.200302175. - DOI - PMC - PubMed
    1. Guo Y, et al. Visualizing intracellular organelle and cytoskeletal interactions at nanoscale resolution on millisecond timescales. Cell. 2018;175:1430–1442. doi: 10.1016/j.cell.2018.09.057. - DOI - PubMed
    1. Stout AL, Axelrod D. Evanescent field excitation of fluorescence by epi-illumination microscopy. Appl. Opt. 1989;28:5237–5242. doi: 10.1364/AO.28.005237. - DOI - PubMed
    1. Axelrod D. Cell-substrate contacts illuminated by total internal reflection fluorescence. J. Cell Biol. 1981;89:141–145. doi: 10.1083/jcb.89.1.141. - DOI - PMC - PubMed