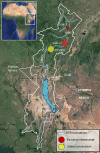
When timing matters-misdesigned dam filling impacts hydropower sustainability
- PMID: 34031413
- PMCID: PMC8144588
- DOI: 10.1038/s41467-021-23323-5
When timing matters-misdesigned dam filling impacts hydropower sustainability
Abstract
Decades of sustainable dam planning efforts have focused on containing dam impacts in regime conditions, when the dam is fully filled and operational, overlooking potential disputes raised by the filling phase. Here, we argue that filling timing and operations can catalyze most of the conflicts associated with a dam's lifetime, which can be mitigated by adaptive solutions that respond to medium-to-long term hydroclimatic fluctuations. Our retrospective analysis of the contested recent filling of Gibe III in the Omo-Turkana basin provides quantitative evidence of the benefits generated by adaptive filling strategies, attaining levels of hydropower production comparable with the historical ones while curtailing the negative impacts to downstream users. Our results can inform a more sustainable filling of the new megadam currently under construction downstream of Gibe III, and are generalizable to the almost 500 planned dams worldwide in regions influenced by climate feedbacks, thus representing a significant scope to reduce the societal and environmental impacts of a large number of new hydropower reservoirs.
Conflict of interest statement
The authors declare no competing interests.
Figures


Similar articles
-
Would Africa's largest hydropower dam have profound environmental impacts?Environ Sci Pollut Res Int. 2021 Feb;28(7):8936-8944. doi: 10.1007/s11356-020-11746-4. Epub 2021 Jan 6. Environ Sci Pollut Res Int. 2021. PMID: 33405168
-
Mutually beneficial outcomes for hydropower expansion and environmental protection at a basin scale.Sci Total Environ. 2023 Oct 20;896:165298. doi: 10.1016/j.scitotenv.2023.165298. Epub 2023 Jul 4. Sci Total Environ. 2023. PMID: 37406702
-
Planning dam portfolios for low sediment trapping shows limits for sustainable hydropower in the Mekong.Sci Adv. 2019 Oct 23;5(10):eaaw2175. doi: 10.1126/sciadv.aaw2175. eCollection 2019 Oct. Sci Adv. 2019. PMID: 32047852 Free PMC article.
-
Social-ecological change in the Omo-Turkana basin: A synthesis of current developments.Ambio. 2019 Oct;48(10):1099-1115. doi: 10.1007/s13280-018-1139-3. Epub 2019 Jan 8. Ambio. 2019. PMID: 30623361 Free PMC article. Review.
-
Hydropower: A low-hanging sour-sweet energy option for India.Heliyon. 2023 Jun 9;9(6):e17151. doi: 10.1016/j.heliyon.2023.e17151. eCollection 2023 Jun. Heliyon. 2023. PMID: 37484265 Free PMC article. Review.
Cited by
-
Climate oscillation impacts on water supply augmentation planning.Proc Natl Acad Sci U S A. 2023 Aug 29;120(35):e2215681120. doi: 10.1073/pnas.2215681120. Epub 2023 Aug 21. Proc Natl Acad Sci U S A. 2023. PMID: 37599444 Free PMC article.
-
Concentration, Health Risk, and Hydrological Forcing of Heavy Metals in Surface Water Following Water-Sediment Regulation of the Xiaolangdi Dam in the Yellow River.Int J Environ Res Public Health. 2022 May 7;19(9):5713. doi: 10.3390/ijerph19095713. Int J Environ Res Public Health. 2022. PMID: 35565108 Free PMC article.
-
Can restoring water and sediment fluxes across a mega-dam cascade alleviate a sinking river delta?Sci Adv. 2024 May 3;10(18):eadn9731. doi: 10.1126/sciadv.adn9731. Epub 2024 May 1. Sci Adv. 2024. PMID: 38691594 Free PMC article.
References
-
- Zarfl C, Lumsdon AE, Berlekamp J, Tydecks L, Tockner K. A global boom in hydropower dam construction. Aquatic Sci. 2015;77:161–170. doi: 10.1007/s00027-014-0377-0. - DOI
-
- Liu J, et al. Nexus approaches to global sustainable development. Nat. Sustainability. 2018;1:466–476. doi: 10.1038/s41893-018-0135-8. - DOI
-
- Bertoni, F., Castelletti, A., Giuliani, M. & Reed, P. Discovering dependencies, trade-offs, and robustness in joint dam design and operation: an ex-post assessment of the Kariba Dam. Earth’s Future10.1029/2019EF001235 (2019).
-
- Jozaghi A, et al. A comparative study of the AHP and TOPSIS techniques for dam site selection using GIS: a case study of Sistan and Baluchestan Province, Iran. Geosciences. 2018;8:494. doi: 10.3390/geosciences8120494. - DOI
Publication types
LinkOut - more resources
Full Text Sources
Other Literature Sources

