

Comparative transcriptome analysis reveals key epigenetic targets in SARS-CoV-2 infection
- PMID: 34031419
- PMCID: PMC8144203
- DOI: 10.1038/s41540-021-00181-x
Comparative transcriptome analysis reveals key epigenetic targets in SARS-CoV-2 infection
Abstract
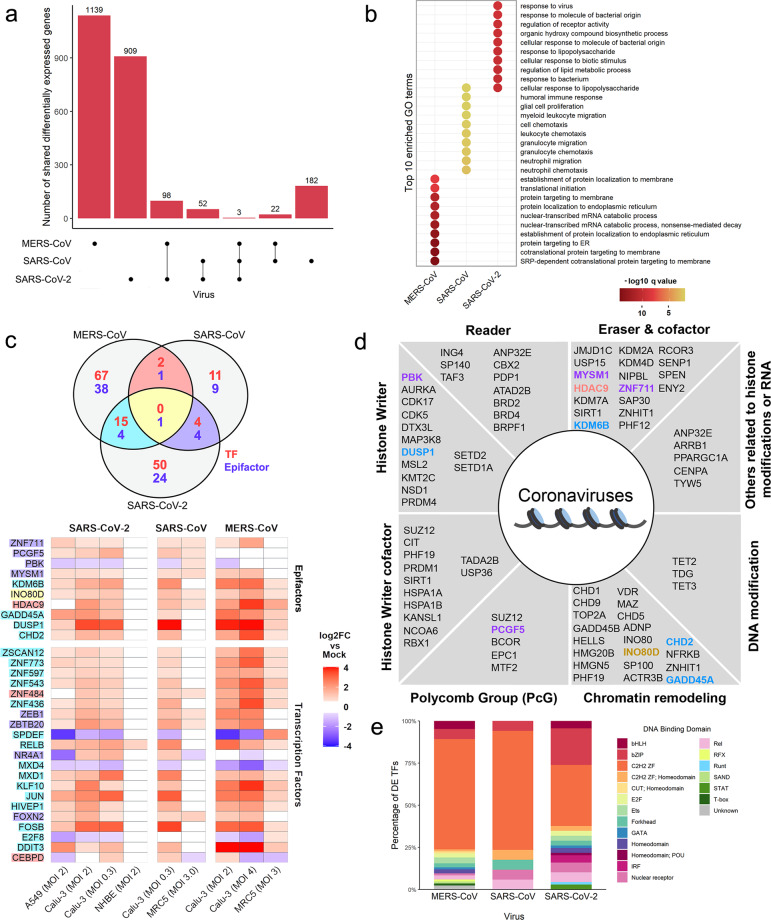
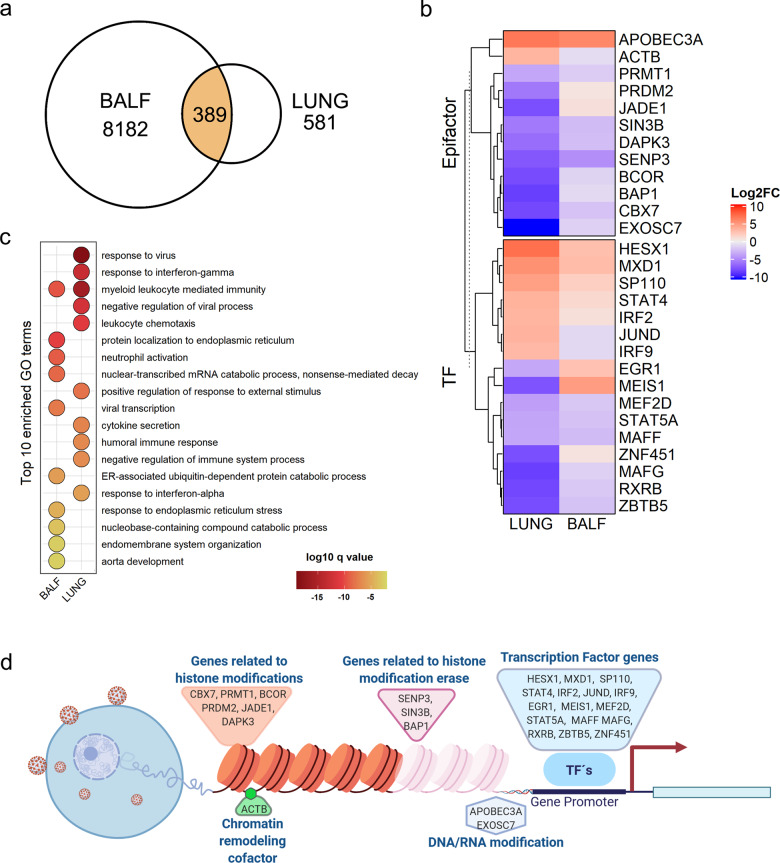
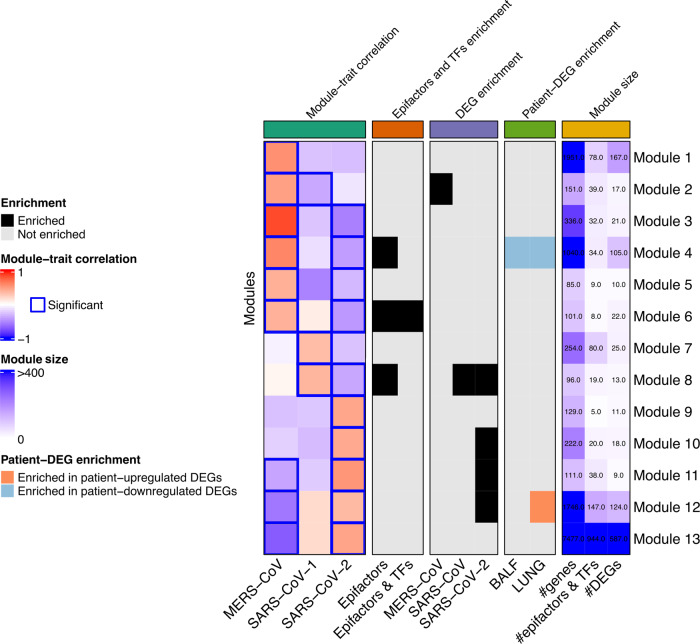
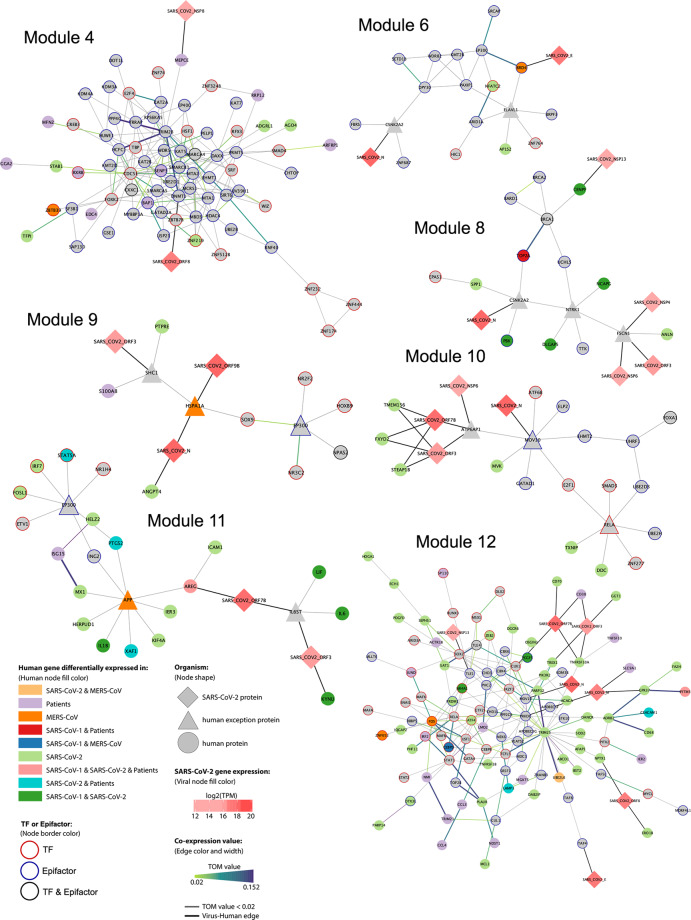
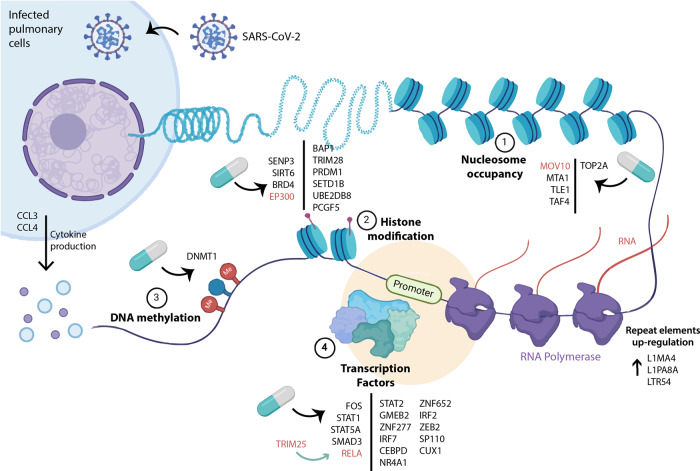
COVID-19 is an infection caused by SARS-CoV-2 (Severe Acute Respiratory Syndrome coronavirus 2), which has caused a global outbreak. Current research efforts are focused on the understanding of the molecular mechanisms involved in SARS-CoV-2 infection in order to propose drug-based therapeutic options. Transcriptional changes due to epigenetic regulation are key host cell responses to viral infection and have been studied in SARS-CoV and MERS-CoV; however, such changes are not fully described for SARS-CoV-2. In this study, we analyzed multiple transcriptomes obtained from cell lines infected with MERS-CoV, SARS-CoV, and SARS-CoV-2, and from COVID-19 patient-derived samples. Using integrative analyses of gene co-expression networks and de-novo pathway enrichment, we characterize different gene modules and protein pathways enriched with Transcription Factors or Epifactors relevant for SARS-CoV-2 infection. We identified EP300, MOV10, RELA, and TRIM25 as top candidates, and more than 60 additional proteins involved in the epigenetic response during viral infection that has therapeutic potential. Our results show that targeting the epigenetic machinery could be a feasible alternative to treat COVID-19.
Conflict of interest statement
The authors declare no competing interests.
Figures
Similar articles
-
Comparative transcriptome analysis of SARS-CoV, MERS-CoV, and SARS-CoV-2 to identify potential pathways for drug repurposing.Comput Biol Med. 2021 Jan;128:104123. doi: 10.1016/j.compbiomed.2020.104123. Epub 2020 Nov 24. Comput Biol Med. 2021. PMID: 33260034 Free PMC article.
-
Comparative pathology, molecular pathogenicity, immunological features, and genetic characterization of three highly pathogenic human coronaviruses (MERS-CoV, SARS-CoV, and SARS-CoV-2).Eur Rev Med Pharmacol Sci. 2021 Nov;25(22):7162-7184. doi: 10.26355/eurrev_202111_27270. Eur Rev Med Pharmacol Sci. 2021. PMID: 34859882 Review.
-
Topological Analysis for Sequence Variability: Case Study on more than 2K SARS-CoV-2 sequences of COVID-19 infected 54 countries in comparison with SARS-CoV-1 and MERS-CoV.Infect Genet Evol. 2021 Mar;88:104708. doi: 10.1016/j.meegid.2021.104708. Epub 2021 Jan 6. Infect Genet Evol. 2021. PMID: 33421654 Free PMC article. Review.
-
Comparative analysis of dynamic transcriptomes reveals specific COVID-19 features and pathogenesis of immunocompromised populations.mSystems. 2024 Jun 18;9(6):e0138523. doi: 10.1128/msystems.01385-23. Epub 2024 May 16. mSystems. 2024. PMID: 38752789 Free PMC article.
-
Coronavirus genomes carry the signatures of their habitats.PLoS One. 2020 Dec 22;15(12):e0244025. doi: 10.1371/journal.pone.0244025. eCollection 2020. PLoS One. 2020. PMID: 33351847 Free PMC article.
Cited by
-
Identification of differentially expressed genes and their major pathways among the patient with COVID-19, cystic fibrosis, and chronic kidney disease.Inform Med Unlocked. 2022;32:101038. doi: 10.1016/j.imu.2022.101038. Epub 2022 Aug 7. Inform Med Unlocked. 2022. PMID: 35966126 Free PMC article.
-
Harnessing Epigenetics: Innovative Approaches in Diagnosing and Combating Viral Acute Respiratory Infections.Pathogens. 2025 Feb 1;14(2):129. doi: 10.3390/pathogens14020129. Pathogens. 2025. PMID: 40005506 Free PMC article. Review.
-
A bioinformatics approach combined with experimental validation analyzes the efficacy of azithromycin in treating SARS-CoV-2 infection in patients with IPF and COPD These authors contributed equally: Yining Xie, Guangshu Chen, and Weiling Wu.Sci Rep. 2025 Mar 23;15(1):10009. doi: 10.1038/s41598-025-94801-9. Sci Rep. 2025. PMID: 40122903 Free PMC article.
-
Involvement of epigenetics in affecting host immunity during SARS-CoV-2 infection.Biochim Biophys Acta Mol Basis Dis. 2023 Mar;1869(3):166634. doi: 10.1016/j.bbadis.2022.166634. Epub 2022 Dec 26. Biochim Biophys Acta Mol Basis Dis. 2023. PMID: 36577469 Free PMC article. Review.
-
Epigenetic rewiring of pathways related to odour perception in immune cells exposed to SARS-CoV-2 in vivo and in vitro.Epigenetics. 2022 Dec;17(13):1875-1891. doi: 10.1080/15592294.2022.2089471. Epub 2022 Jun 26. Epigenetics. 2022. PMID: 35758003 Free PMC article.
References
-
- Payne, S. Chapter 17—family coronaviridae. in Viruses (ed Payne, S.) 149–158 (Academic Press, 2017).
-
- World Health Organization. Coronavirus disease (COVID-19) pandemic. https://www.who.int/emergencies/diseases/novel-coronavirus-2019 (2020).
Publication types
MeSH terms
Grants and funding
- 0284748/Consejo Nacional de Ciencia y Tecnología (National Council of Science and Technology, Mexico)
- CVU659273/Consejo Nacional de Ciencia y Tecnología (National Council of Science and Technology, Mexico)
- CVU894530/Consejo Nacional de Ciencia y Tecnología (National Council of Science and Technology, Mexico)
- 91693321/Deutscher Akademischer Austauschdienst (German Academic Exchange Service)
- 6108-00038B/Det Frie Forskningsråd (Danish Council for Independent Research)
LinkOut - more resources
Full Text Sources
Other Literature Sources
Medical
Miscellaneous
