. 2021 May 24;11(1):10740.
doi: 10.1038/s41598-021-89938-2.

Improved methods for RNAseq-based alternative splicing analysis

Collaborators, Affiliations

Improved methods for RNAseq-based alternative splicing analysis

Rebecca F Halperin et al. Sci Rep. .

Abstract

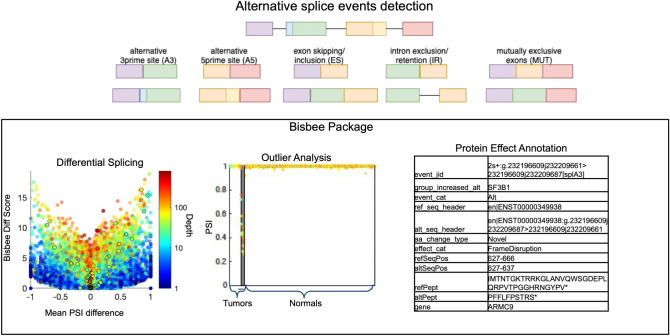
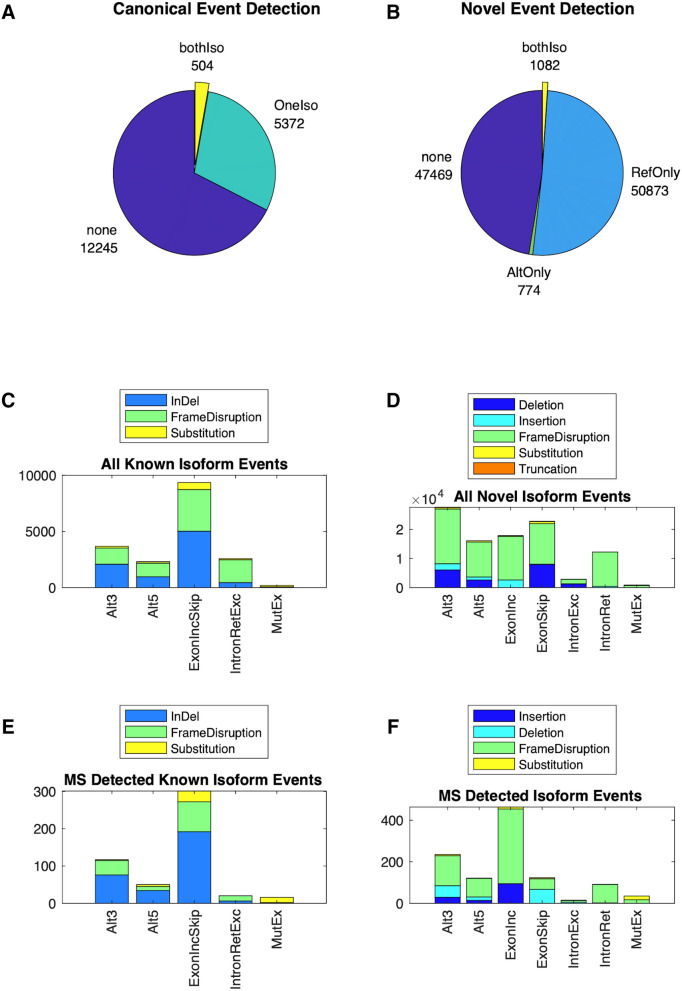
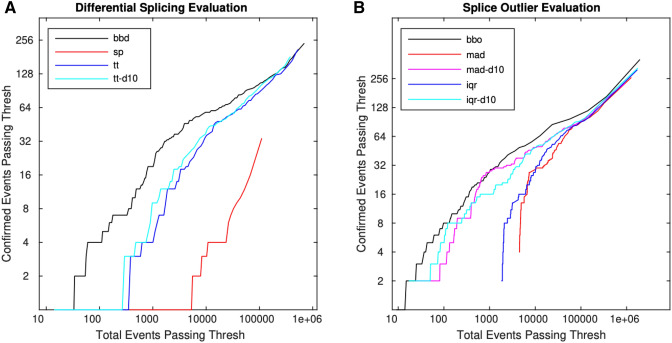
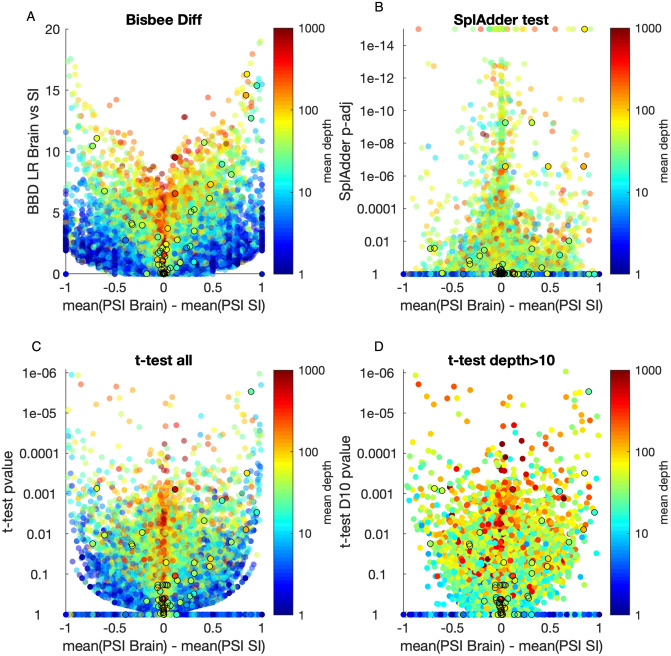
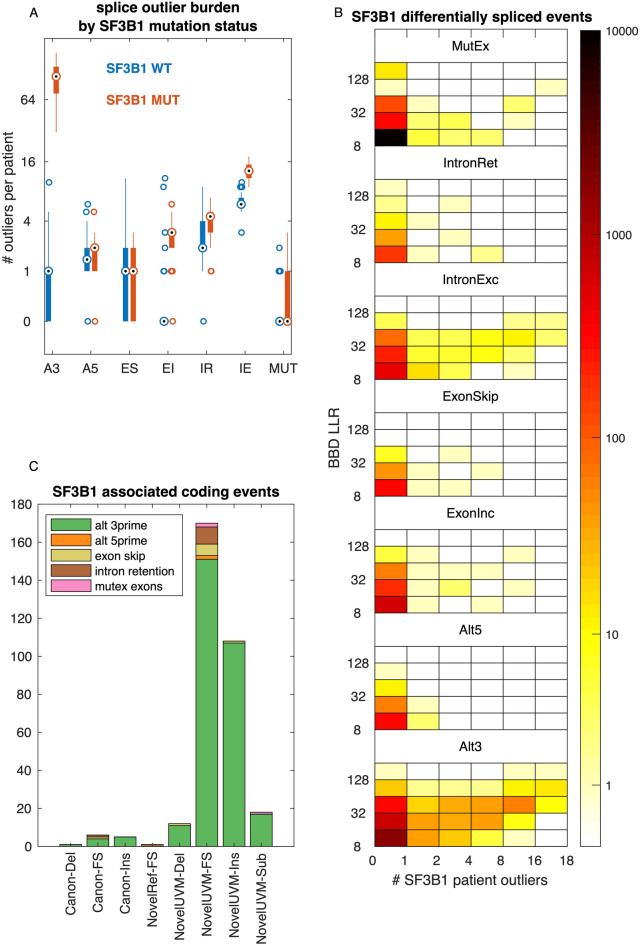
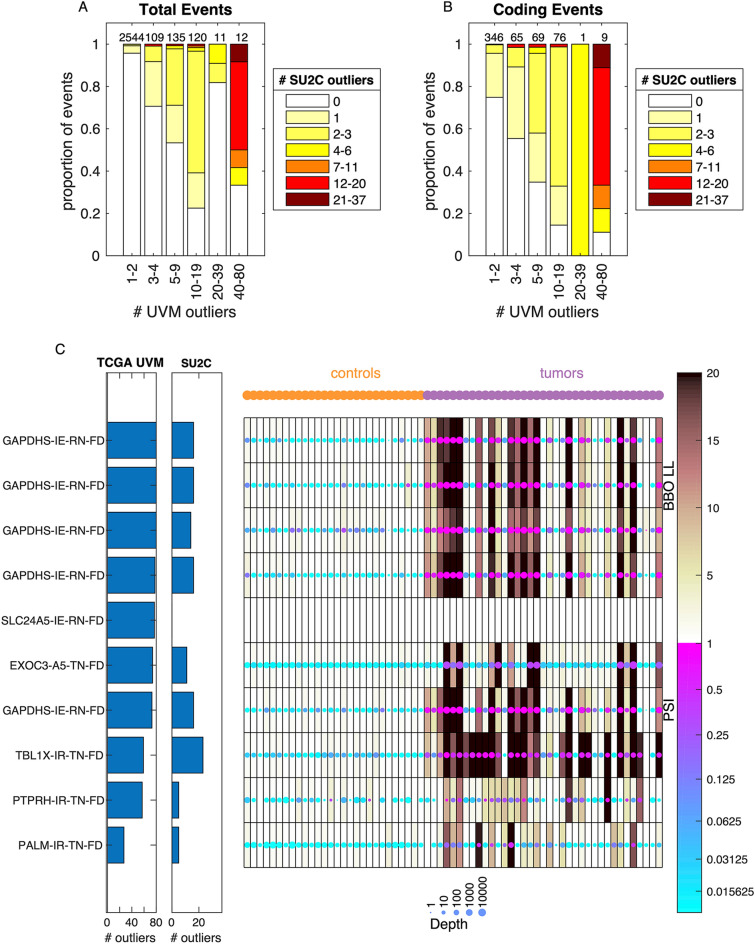
The robust detection of disease-associated splice events from RNAseq data is challenging due to the potential confounding effect of gene expression levels and the often limited number of patients with relevant RNAseq data. Here we present a novel statistical approach to splicing outlier detection and differential splicing analysis. Our approach tests for differences in the percentages of sequence reads representing local splice events. We describe a software package called Bisbee which can predict the protein-level effect of splice alterations, a key feature lacking in many other splicing analysis resources. We leverage Bisbee's prediction of protein level effects as a benchmark of its capabilities using matched sets of RNAseq and mass spectrometry data from normal tissues. Bisbee exhibits improved sensitivity and specificity over existing approaches and can be used to identify tissue-specific splice variants whose protein-level expression can be confirmed by mass spectrometry. We also applied Bisbee to assess evidence for a pathogenic splicing variant contributing to a rare disease and to identify tumor-specific splice isoforms associated with an oncogenic mutation. Bisbee was able to rediscover previously validated results in both of these cases and also identify common tumor-associated splice isoforms replicated in two independent melanoma datasets.


Conflict of interest statement

The authors declare no competing interests.

Figures

Figure 1
Figure 1
Method overview. Five types of alternative splicing events are detected by SplAdder. For each event, two alternative splice isoforms are considered. Bisbee takes the read counts supporting each isoform in each sample and performs differential splicing or outlier analysis. As illustrated in the volcano plot on the left, Bisbee Diff is able to detect high coverage events with subtle differences in percent spliced in (PSI) as well as low coverage events with large differences in PSI. As illustrated in the center plot, the Bisbee outlier test also takes into account the differences in PSI and the coverage of the event. Each dot represents a sample, with tumors on the left and normal tissues on the right. The samples are sorted by outlier score within each set on the x-axis, the PSI is plotted on the y-axis, and the color represents the depth of coverage of the event in the sample. The dots within the grey stripe pass the outlier score threshold. Bisbee also annotates protein-level effects and as can be seen in the example output on the right.
Figure 2
Figure 2
Splice event detection. Pie charts show the breakdown of splice events by their mass spectrometry evidence with “none” indicating no peptides map to either isoform, “oneIso”, indicating at least one peptide maps to one of the two isoforms of a known event, “refOnly” indicating at least one peptide maps to the reference isoform of a novel event, “AltOnly” indicating at least one peptide maps to the alternative (novel) isoform of a novel event, and “bothIso” indicating at least one peptide maps to each of the two isoforms for known (A) or novel (B) events. Breakdown of splice events by event type and predicted protein level effect for all predicted known isoform events (C), all predicted novel isoform events (D), known isoform events with both isoforms detected (E), and novel isoform events with both isoforms detected (F).
Figure 3
Figure 3
Bisbee detects protein expression confirmed splice events with high sensitivity. (A) The number of events with protein expression evidence of differential splicing is plotted against the total number of events passing the threshold for four different differential splicing methods: beta binomial (bbd—black), SplAdder’s test (sp—red), t-test on all PSI (tt—blue), t-test on PSI with depth > 10 (tt-d10—cyan). (b) The number of mass spectrometry confirmed outlier events is plotted against the total number of events passing the threshold for five different methods: bisbee outlier (black), median absolute deviation (red), median absolute deviation with depth > 10 (magenta), interquartile range (blue), and interquartile range with depth > 10 (cyan).
Figure 4
Figure 4
Volcano plots of brain versus small intestine for four differential splicing methods. Differential splicing results for the brain versus small intestine comparison from the Wang et al. dataset. The Bisbee Diff LR (A), SplAdder test adjusted p value on a log scale (B), or t-test p value on a log scale (C,D) are plotted against the difference in mean PSI between the brain and small intestine samples. Points are colored by the mean read depth covering the event on a log scale as indicated by the color bar. Events with mass spectrometry confirmed tissue specific protein expression are outlined by black circles.
Figure 5
Figure 5
Aberrant splicing in uveal melanoma. (A) Boxplot comparing the number of splice event outliers between SF3B1 mutant patients (n = 18) and wild-type patients (n = 62) by splice event type. (B) Heatmap overview of differentially spliced events between SF3B1 mutant and wild-type tumors. Bins on the x-axis indicate the number of SF3B1 mutant tumors meeting the outlier criteria and bins on the y-axis indicate the Bisbee Diff LLR, and the color indicates the number of events falling into each bin. (C) Event type and protein level effects of events that are differentially spliced between SF3B1 mutant and wildtype tumors, are outliers in at least one SF3B1 mutant tumor, and result in an altered protein sequence.
Figure 6
Figure 6
Common melanoma associated splice events are shared between cohorts. (A) Comparison of number tumors meeting outlier criteria between cohorts. Along the x-axis, events are binned by the number of tumors meeting the outlier threshold in the TCGA cohort. The total number of events in each bin is indicated at the top of each bar. Within each bar, the events are binned by the total number of tumors meeting the outlier threshold in the SU2C cohort, and the proportion of events in each bin is indicated by the color. (B) Same as (A) but only including events with predicted protein coding changes. (C) Heatmap of the data in the SU2C cohort for the 10 events with predicted coding sequence changes that are found in more than 20 tumors in the TCGA cohort. Each row is an event and each column is a sample, with the controls on the left and the tumors on the right. The color of each dot represents the PSI and the size of each dot represents the coverage at the event. The shading behind the dot indicates the Bisbee outlier score. The bar graphs to the left of the heatmap indicate the number of tumors meeting the outlier threshold in each cohort. The labels on the left indicate the gene name, event type (IE—intron exclusion, A5—alternative 5′, IR—intron retention), and the effect type (RN-FD—frame disruption in the control samples predicted to result in novel sequences, TN-FD frame disruption in the tumor samples predicted to result in novel sequences).

References

    1. Park E, Pan Z, Zhang Z, Lin L, Xing Y. The expanding landscape of alternative splicing variation in human populations. Am. J. Hum. Genet. 2018;102:11–26. doi: 10.1016/j.ajhg.2017.11.002. - DOI - PMC - PubMed
    1. Gamazon ER, Stranger BE. Genomics of alternative splicing: Evolution, development and pathophysiology. Hum. Genet. 2014;133:679–687. doi: 10.1007/s00439-013-1411-3. - DOI - PubMed
    1. Kahles A, Lehmann K-V, Toussaint NC, Hüser M, Stark SG, Sachsenberg T, et al. Comprehensive analysis of alternative splicing across tumors from 8,705 patients. Cancer Cell. 2018;34:211.e6–224.e6. doi: 10.1016/j.ccell.2018.07.001. - DOI - PMC - PubMed
    1. Dvinge H, Kim E, Abdel-Wahab O, Bradley RK. RNA splicing factors as oncoproteins and tumor suppressors. Nat. Rev. Cancer. 2016;16:413–430. doi: 10.1038/nrc.2016.51. - DOI - PMC - PubMed
    1. Li YI, van de Geijn B, Raj A, Knowles DA, Petti AA, Golan D, et al. RNA splicing is a primary link between genetic variation and disease. Science. 2016;352:600–604. doi: 10.1126/science.aad9417. - DOI - PMC - PubMed

Publication types

Substances