. 2021 May 24;11(1):10774.
doi: 10.1038/s41598-021-89613-6.

Molecular model of a sensor of two-component signaling system

Affiliations

Molecular model of a sensor of two-component signaling system

Yury L Ryzhykau et al. Sci Rep. .

Abstract

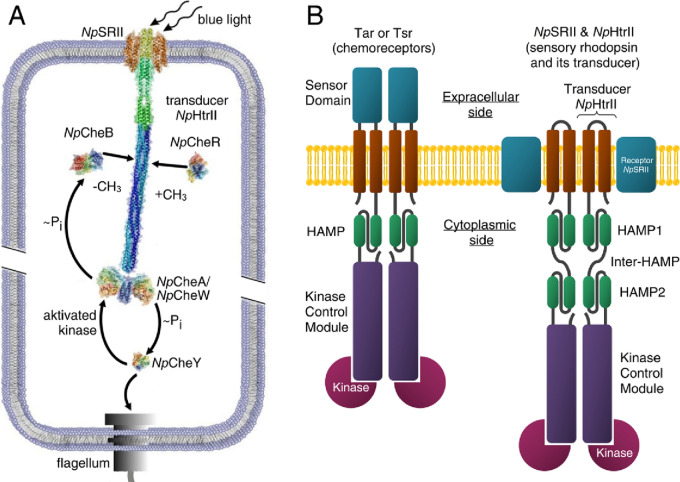
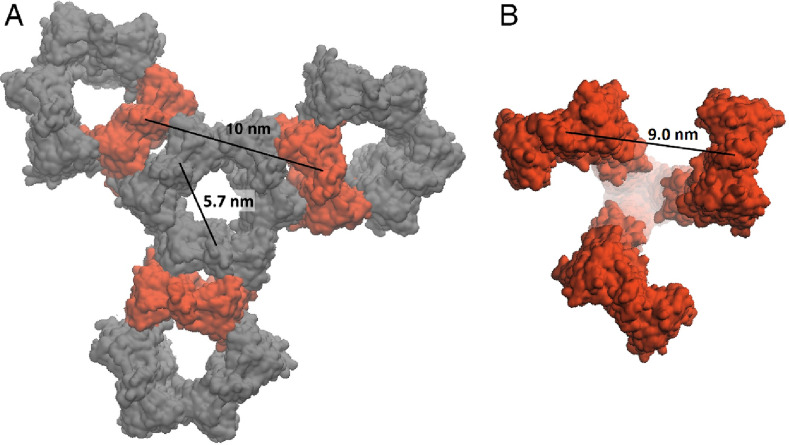
Two-component systems (TCS) are widespread signaling systems present in all domains of life. TCS typically consist of a signal receptor/transducer and a response regulator. The receptors (histidine kinases, chemoreceptors and photoreceptors) are often embedded in the membrane and have a similar modular structure. Chemoreceptors were shown to function in highly ordered arrays, with trimers of dimers being the smallest functional unit. However, much less is known about photoreceptors. Here, we use small-angle scattering (SAS) to show that detergent-solubilized sensory rhodopsin II in complex with its cognate transducer forms dimers at low salt concentration, which associate into trimers of dimers at higher buffer molarities. We then fit an atomistic model of the whole complex into the SAS data. The obtained results suggest that the trimer of dimers is "tripod"-shaped and that the contacts between the dimers occur only through their cytoplasmic regions, whereas the transmembrane regions remain unconnected.


Conflict of interest statement

The authors declare no competing interests.

Figures

Figure 1
Figure 1
Signal transduction pathway in case of the two-component phototaxis system of Natronomonas pharaonis and domain architecture of membrane chemo- and photoreceptors of TCS. (A) Light activated sensory rhodopsin II (NpSRII) induces conformational and/or dynamical changes in the transducer (NpHtrII), which are converted by two HAMP domains and conveyed along the 200 Å long transducer to the tip region. Activated by the transducer histidine kinase CheA (bound to the adapter protein CheW) undergoes auto-phosphorylation and further transfers the phosphate group to the response regulators CheY or CheB. CheY affects the rotational bias of the flagellar motor, while the methylesterase CheB along with the methyltransferase CheR controls the adaptation mechanism. (B) Cartoon representations of the chemoreceptor dimer (Tar and Tsr in complex with kinases) from E. coli and of the photosensor dimer of the complex of the sensory rhodopsin II with its cognate transducer NpHtrII and kinases from N. pharaonis.
Figure 2
Figure 2
Dimerization of NpSRII/NpHtrII137 and of full-length NpSRII/NpHtrII at low salt concentration. (A) Bottom—experimental SANS curve for NpSRII/NpHtrII (purple hollow rhombus) and CRYSON fit (χ2 = 0.7, corresponding blue line) based on a model (shown on the left of the curves) of an NpSRII/NpHtrII dimer with a detergent corona. Middle—experimental SAXS curve for the NpSRII/NpHtrII137 dimer (red circles) and MEMPROT fit (χ2 = 1.5, corresponding blue line) based on a model (shown near the corresponding curve) of the NpSRII/NpHtrII137 dimer with the detergent corona. Top—experimental SAXS curve for full-length NpSRII/NpHtrII (dark yellow triangles) and two theoretical approximations. The first (blue solid line) is a CRYSOL3 fit (χ2 = 5.1) based on a "straight" model of the NpSRII/NpHtrII dimer. The second (brown pointed line) is a fit (χ2 = 3.4) based on a combination of modified models of the NpSRII/NpHtrII dimer (see “Methods”, Fig. S2 and Text document S1 for details). While the difference between the two fits is not immediately apparent, the improved fit of the second approximation is evident when considering of the relative residuals of the fit in the region in reciprocal space q < 0.04 Å−1 (see B), that corresponds to the distances > 160 Å in a real space. For this range of distances, discrepancy between the experimental distance distribution function and theoretical one obtained for the "straight" model of the NpSRII/NpHtrII dimer is evident (see C). In the representations of the atomic models, the detergent belt is shown in red. (B) Relative residuals of theoretical approximations and experimental SAXS data obtained for full-length NpSRII/NpHtrII (A, top). Data related to the "straight" model is shown as blue solid line; data related to the combination of modified models is shown as brown pointed line. (C) Distance distribution functions calculated from the SAXS curves shown in (A) (designations are the same as in A). (D) Distance distribution functions calculated from SANS data shown in (A) (designations are the same as in A).
Figure 3
Figure 3
SANS curve for NpSRII/NpHtrII at 4.0 M NaCl and corresponding distance distribution functions. (A) Experimental scattering curve for NpSRII/NpHtrII at 4.0 M NaCl (orange squares) fitted with χ2 = 5.5 to a theoretical curve (blue line) calculated for a mixture of NpSRII/NpHtrII dimers and trimers of dimers which inter-dimer contacts are induced both between the transmembrane regions of dimers and their cytoplasmic tips (Fig. 4A). (B) Experimental scattering curve for NpSRII/NpHtrII at 4.0 M NaCl (orange squares) fitted with χ2 = 1.3 to a theoretical curve (blue line) calculated for a mixture of NpSRII/NpHtrII dimers and "tripod"-shaped trimers of dimers (Fig. 4B). (C) Distance distribution function calculated from the experimental curve shown in (A,B) (orange squares), and theoretical distance distribution functions of the dimers (grey line), the "tripod"-shaped (Fig. 4B) trimers of dimers (brown line) and the "transmembrane-bound" conformation of trimer of dimers of the NpSRII/NpHtrII (Fig. 4A) (black line). For greater clarity, distance distribution functions were normalized to obtain maximum values of 1.0 for the experimental and 0.6 for the theoretical curves.
Figure 4
Figure 4
Optimized molecular models of the NpSRII/NpHtrII trimer of dimers. (A,B) Molecular models of the "transmembrane-bound" (A) and the "tripod"-shaped (B) trimer of dimers. Individual polypeptide chains are colored differently. Putative methylation sites are represented as spheres. (C) Putative methylation sites in the methyl-accepting region of a single dimer of the complex. (D) Inter-dimer contacts within the highly conservative tip region of the cytoplasmic domain of the "tripod"-shaped trimer of dimers. Key amino acid residues are shown with those belonging to the partnering dimer labeled by apostrophe. (E) Cross-section view highlighting the formation of ionic locks between E355-R358' (homologous to E385 and R388' from Tsr and stacking between F366 (equivalent to F396 of Tsr) and F366'. (F) Cross section depicting contacts between conservative K374' and Q344 residues, and hydrophobic contacts between I347. (G) Logo plot showing conservation of residues in the tip region involved in the formation of the trimer contacts.
Figure 5
Figure 5
Inter-dimer distances between transmembrane parts of the NpSRII/NpHtrII dimers. (A) Characteristic distances between dimers in 2D-array proposed in. (B) The "tripod"-shaped model of the trimer of dimers (Fig. 4B) demonstrating the inter-dimer distance of 9.0 nm.

References

    1. Bem AE, et al. Bacterial histidine kinases as novel antibacterial drug targets. ACS Chem. Biol. 2015;10:213–224. doi: 10.1021/cb5007135. - DOI - PubMed
    1. Mazé A, Benenson Y. Artificial signaling in mammalian cells enabled by prokaryotic two-component system. Nat. Chem. Biol. 2020;16:179–187. doi: 10.1038/s41589-019-0429-9. - DOI - PMC - PubMed
    1. Hazelbauer GL, Falke JJ, Parkinson JS. Bacterial chemoreceptors: High-performance signaling in networked arrays. Trends Biochem. Sci. 2008;33:9–19. doi: 10.1016/j.tibs.2007.09.014. - DOI - PMC - PubMed
    1. Klare JP, Chizhov I, Engelhard M. Microbial rhodopsins: Scaffolds for ion pumps, channels, and sensors. Results Probl. Cell Differ. 2008;45:73–122. doi: 10.1007/400_2007_041. - DOI - PubMed
    1. Orekhov PS, et al. Signaling and adaptation modulate the dynamics of the photosensoric complex of Natronomonas pharaonis. PLoS Comput. Biol. 2015;11:e1004561. doi: 10.1371/journal.pcbi.1004561. - DOI - PMC - PubMed

Publication types