

Power determination in vitamin D randomised control trials and characterising factors affecting it through a novel simulation-based tool
- PMID: 34031451
- PMCID: PMC8144427
- DOI: 10.1038/s41598-021-90019-7
Power determination in vitamin D randomised control trials and characterising factors affecting it through a novel simulation-based tool
Erratum in
-
Publisher Correction: Power determination in vitamin D randomised control trials and characterising factors affecting it through a novel simulation-based tool.Sci Rep. 2021 Jun 22;11(1):13387. doi: 10.1038/s41598-021-92486-4. Sci Rep. 2021. PMID: 34158550 Free PMC article. No abstract available.
Abstract
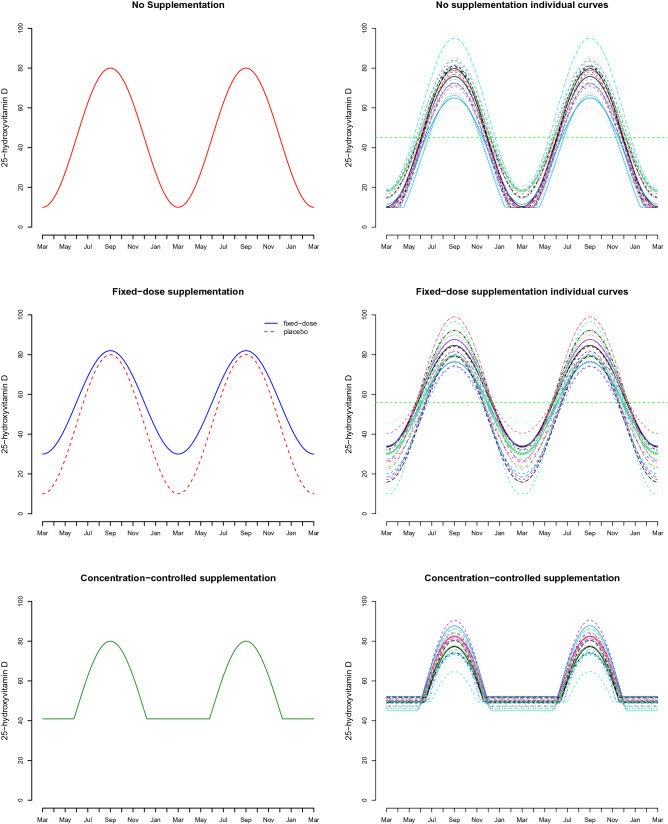
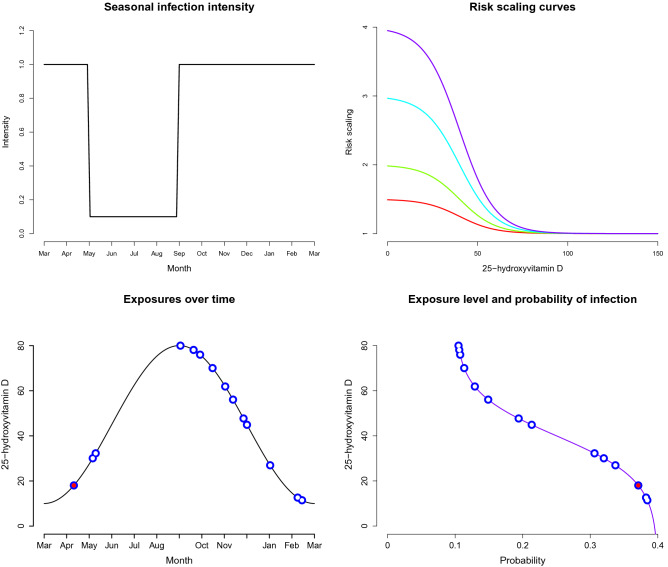
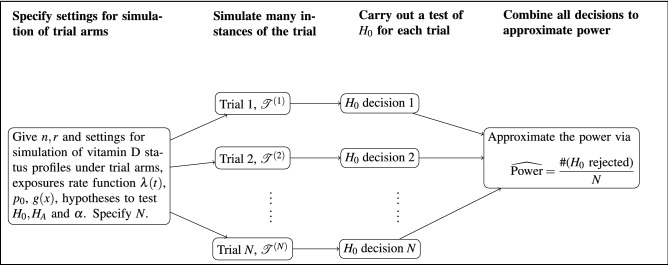
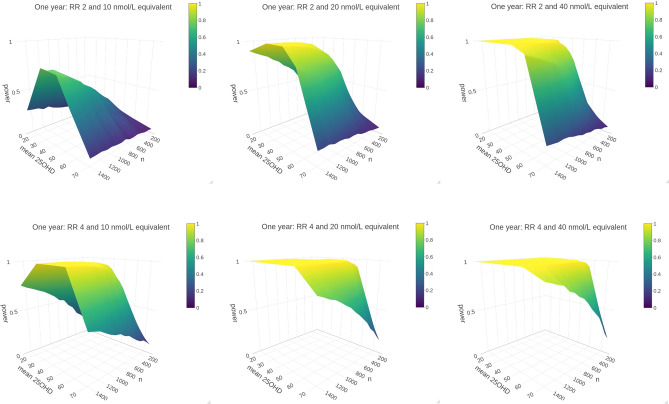
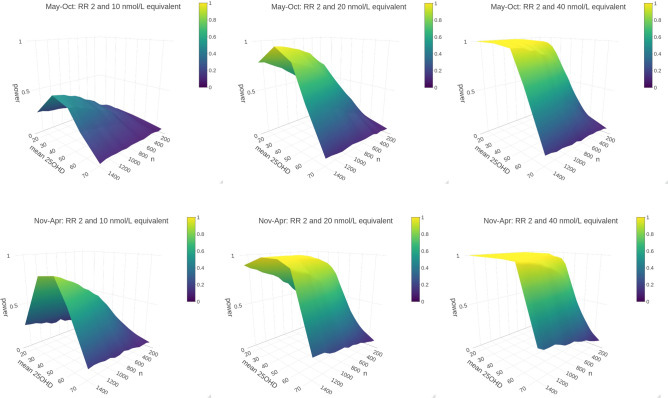
Thousands of observational studies have linked vitamin D deficiency with numerous diseases, but randomised controlled trials (RCTs) often fail to show benefit of supplementation. Population characteristics and trial design have long been suspected to undermine power but were not systematically investigated. We propose a flexible generative model to characterise benefit of vitamin D supplementation at the individual level, and use this to quantify power in RCTs. The model can account for seasonality and population heterogeneity. In a simulated 1-year trial with 1000 participants per arm and assuming a 25-hydroxyvitamin D (25OHD) increase of 20 nmol/L due to the intervention, with baseline 25OHD in the population of 15, 35, 50, 60 and 75 nmol/L, the power to detect intervention effect was 77%, 99%, 95%, 68% and 19%, respectively. The number of participants required per arm to achieve 80% power according to baseline 25OHD of 15-60 nmol/L was 1200, 400, 600 and 1400, respectively. As expected, larger increases in 25OHD due to supplementation improved power in certain scenarios. For a population baseline of 50 nmol/L, with 1500 participants in each arm, there was 100% power to detect a 20 nmol/L 25OHD increase while it was 76% for a 10 nmol/L increase. Population characteristics and trial design, including temporal considerations, have a dramatic impact on power and required sample size in vitamin D RCTs.
Conflict of interest statement
The authors declare no competing interests.
Figures
Similar articles
-
Statistical power in vitamin D randomized control trials investigating biomarkers as continuous outcomes.J Steroid Biochem Mol Biol. 2022 Sep;222:106148. doi: 10.1016/j.jsbmb.2022.106148. Epub 2022 Jul 6. J Steroid Biochem Mol Biol. 2022. PMID: 35809790
-
Assessment of research waste part 2: wrong study populations- an exemplar of baseline vitamin D status of participants in trials of vitamin D supplementation.BMC Med Res Methodol. 2018 Oct 3;18(1):101. doi: 10.1186/s12874-018-0555-1. BMC Med Res Methodol. 2018. PMID: 30285729 Free PMC article.
-
Serum 25-hydroxyvitamin D response to vitamin D supplementation in infants: a systematic review and meta-analysis of clinical intervention trials.Eur J Nutr. 2020 Feb;59(1):359-369. doi: 10.1007/s00394-019-01912-x. Epub 2019 Feb 5. Eur J Nutr. 2020. PMID: 30721411
-
Vitamin D supplementation to prevent acute respiratory infections: a systematic review and meta-analysis of aggregate data from randomised controlled trials.Lancet Diabetes Endocrinol. 2021 May;9(5):276-292. doi: 10.1016/S2213-8587(21)00051-6. Epub 2021 Mar 30. Lancet Diabetes Endocrinol. 2021. PMID: 33798465
-
Vitamin D intervention in preschoolers with viral-induced asthma (DIVA): a pilot randomised controlled trial.Trials. 2016 Jul 26;17(1):353. doi: 10.1186/s13063-016-1483-1. Trials. 2016. PMID: 27456232 Free PMC article.
Cited by
-
Beneficial health effects of ultraviolet radiation: expert review and conference report.Photochem Photobiol Sci. 2025 Jun;24(6):867-893. doi: 10.1007/s43630-025-00743-6. Epub 2025 Jun 4. Photochem Photobiol Sci. 2025. PMID: 40465176 Review.
-
Vitamin D and Gestational Diabetes Mellitus in the IEU OpenGWAS Project: A Two-Sample Bidirectional Mendelian Randomization Study.Nutrients. 2024 Aug 24;16(17):2836. doi: 10.3390/nu16172836. Nutrients. 2024. PMID: 39275154 Free PMC article.
-
Circulating 25-hydroxyvitamin D and survival outcomes of colorectal cancer: evidence from population-based prospective cohorts and Mendelian randomisation.Br J Cancer. 2024 May;130(9):1585-1591. doi: 10.1038/s41416-024-02643-5. Epub 2024 Mar 13. Br J Cancer. 2024. PMID: 38480934 Free PMC article.
-
Efficacy of vitamin D3 supplementation on cancer mortality: Systematic review and individual patient data meta-analysis of randomised controlled trials.Ageing Res Rev. 2023 Jun;87:101923. doi: 10.1016/j.arr.2023.101923. Epub 2023 Mar 31. Ageing Res Rev. 2023. PMID: 37004841 Free PMC article.
-
Comprehensive Analysis of Seasonal and Geographical Variation in UVB Radiation Relevant for Vitamin D Production in Europe.Nutrients. 2022 Dec 6;14(23):5189. doi: 10.3390/nu14235189. Nutrients. 2022. PMID: 36501219 Free PMC article.
References
-
- Entrenas Castillo M, et al. Effect of calcifediol treatment and best available therapy versus best available therapy on intensive care unit admission and mortality among patients hospitalized for COVID-19: A pilot randomized clinical study. J. Steroid Biochem. Mol. Biol. 2020;203:105751. doi: 10.1016/j.jsbmb.2020.105751. - DOI - PMC - PubMed
Publication types
MeSH terms
Substances
LinkOut - more resources
Full Text Sources
Other Literature Sources
Medical
Research Materials
