

Health monitoring in birds using bio-loggers and whole blood transcriptomics
- PMID: 34031452
- PMCID: PMC8144624
- DOI: 10.1038/s41598-021-90212-8
Health monitoring in birds using bio-loggers and whole blood transcriptomics
Abstract
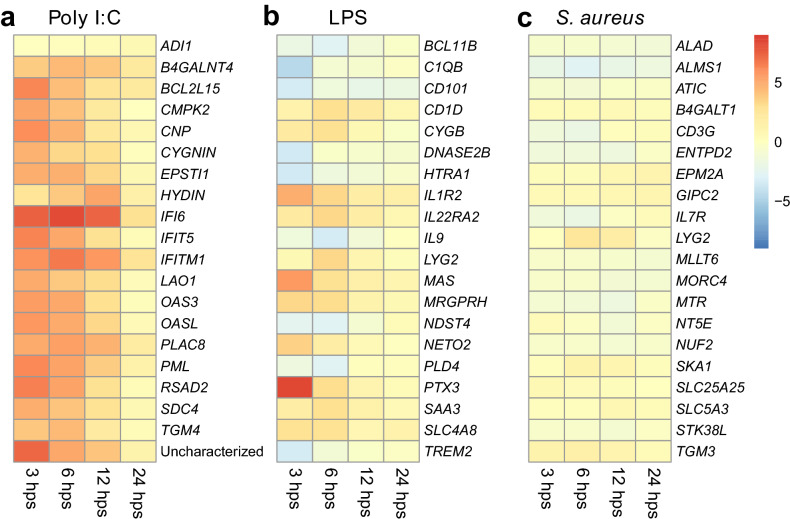
Monitoring and early detection of emerging infectious diseases in wild animals is of crucial global importance, yet reliable ways to measure immune status and responses are lacking for animals in the wild. Here we assess the usefulness of bio-loggers for detecting disease outbreaks in free-living birds and confirm detailed responses using leukocyte composition and large-scale transcriptomics. We simulated natural infections by viral and bacterial pathogens in captive mallards (Anas platyrhynchos), an important natural vector for avian influenza virus. We show that body temperature, heart rate and leukocyte composition change reliably during an acute phase immune response. Using genome-wide gene expression profiling of whole blood across time points we confirm that immunostimulants activate pathogen-specific gene regulatory networks. By reporting immune response related changes in physiological and behavioural traits that can be studied in free-ranging populations, we provide baseline information with importance to the global monitoring of zoonotic diseases.
Conflict of interest statement
The authors declare no competing interests.
Figures


Similar articles
-
Transfer of maternal antibodies against avian influenza virus in mallards (Anas platyrhynchos).PLoS One. 2014 Nov 11;9(11):e112595. doi: 10.1371/journal.pone.0112595. eCollection 2014. PLoS One. 2014. PMID: 25386907 Free PMC article.
-
One Decade of Active Avian Influenza Wild Bird Surveillance in Belgium Showed a Higher Viroprevalence in Hunter-Harvested Than in Live-Ringed Birds.Avian Dis. 2016 May;60(1 Suppl):387-93. doi: 10.1637/11128-050715-ResNote. Avian Dis. 2016. PMID: 27309083
-
Individual variation in influenza A virus infection histories and long-term immune responses in Mallards.PLoS One. 2013 Apr 23;8(4):e61201. doi: 10.1371/journal.pone.0061201. Print 2013. PLoS One. 2013. PMID: 23637797 Free PMC article.
-
Emerging avian influenza infections: Current understanding of innate immune response and molecular pathogenesis.Int Rev Immunol. 2017 Mar 4;36(2):89-107. doi: 10.1080/08830185.2017.1291640. Epub 2017 Mar 8. Int Rev Immunol. 2017. PMID: 28272907 Review.
-
Immunology of avian influenza virus: a review.Dev Comp Immunol. 2000 Mar-Apr;24(2-3):269-83. doi: 10.1016/s0145-305x(99)00078-6. Dev Comp Immunol. 2000. PMID: 10717293 Review.
Cited by
-
Comparison of ruminal ecology and blood profiles in Bali, Madura, and Ongole crossbred cattle of Indonesia.Vet World. 2025 Feb;18(2):379-387. doi: 10.14202/vetworld.2025.379-387. Epub 2025 Jan 15. Vet World. 2025. PMID: 40182819 Free PMC article.
-
Comparative Genomics of the Waterfowl Innate Immune System.Mol Biol Evol. 2022 Aug 3;39(8):msac160. doi: 10.1093/molbev/msac160. Mol Biol Evol. 2022. PMID: 35880574 Free PMC article.
-
Evolution of RNA sensing receptors in birds.Immunogenetics. 2022 Feb;74(1):149-165. doi: 10.1007/s00251-021-01238-1. Epub 2022 Jan 21. Immunogenetics. 2022. PMID: 35059779 Free PMC article. Review.
-
Sustainable software development in science - insights from 20 years of Vanted.J Integr Bioinform. 2025 Jul 1;22(1):20250007. doi: 10.1515/jib-2025-0007. eCollection 2025 Mar 1. J Integr Bioinform. 2025. PMID: 40586365 Free PMC article.
-
Evaluating Effects of AIV Infection Status on Ducks Using a Flow Cytometry-Based Differential Blood Count.Microbiol Spectr. 2023 Aug 17;11(4):e0435122. doi: 10.1128/spectrum.04351-22. Epub 2023 Jun 15. Microbiol Spectr. 2023. PMID: 37318353 Free PMC article.
References
Publication types
MeSH terms
Substances
LinkOut - more resources
Full Text Sources
Other Literature Sources
Medical
