. 2021 May 24;11(1):10790.
doi: 10.1038/s41598-021-89039-0.

Activation of IGF-1 pathway and suppression of atrophy related genes are involved in Epimedium extract (icariin) promoted C2C12 myotube hypertrophy

Affiliations

Activation of IGF-1 pathway and suppression of atrophy related genes are involved in Epimedium extract (icariin) promoted C2C12 myotube hypertrophy

Yi-An Lin et al. Sci Rep. .

Abstract

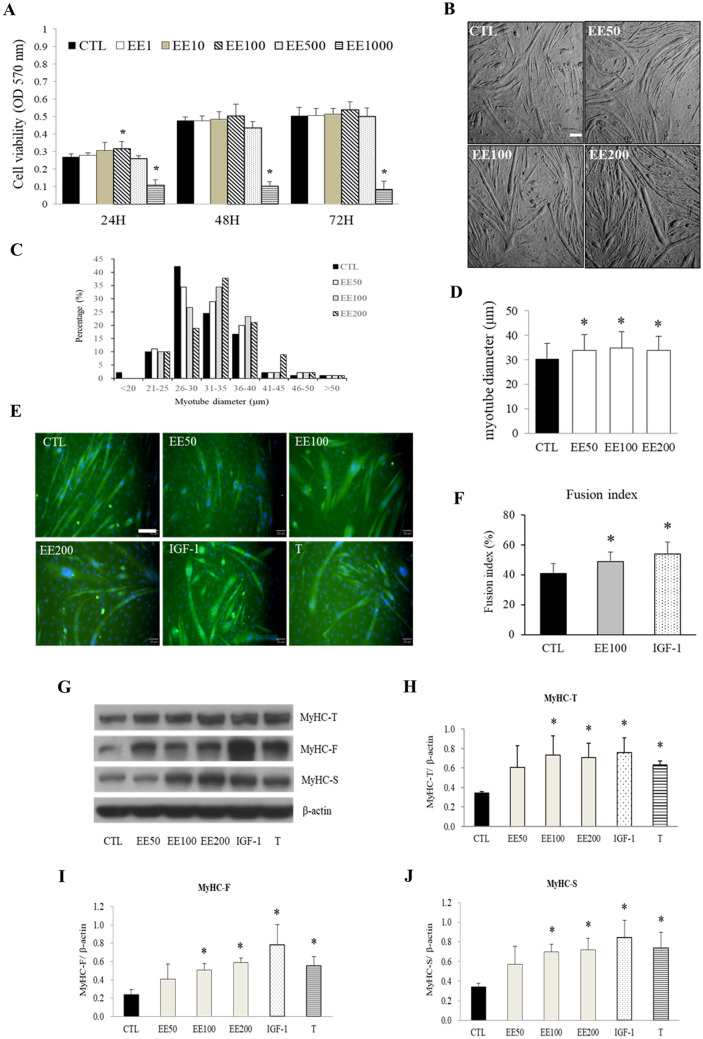
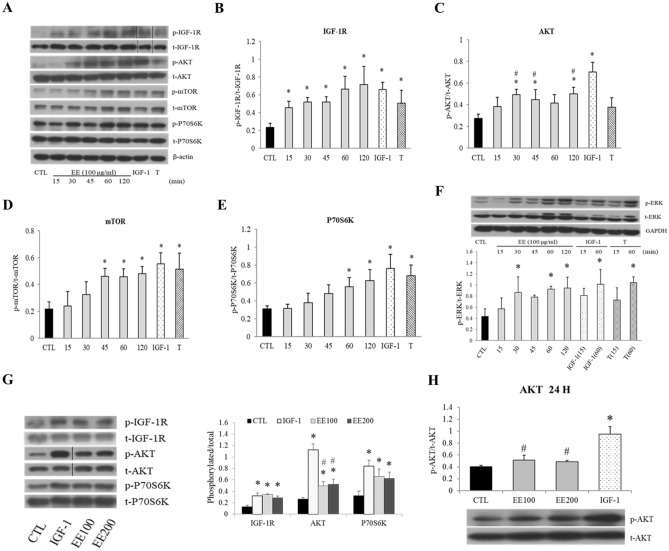
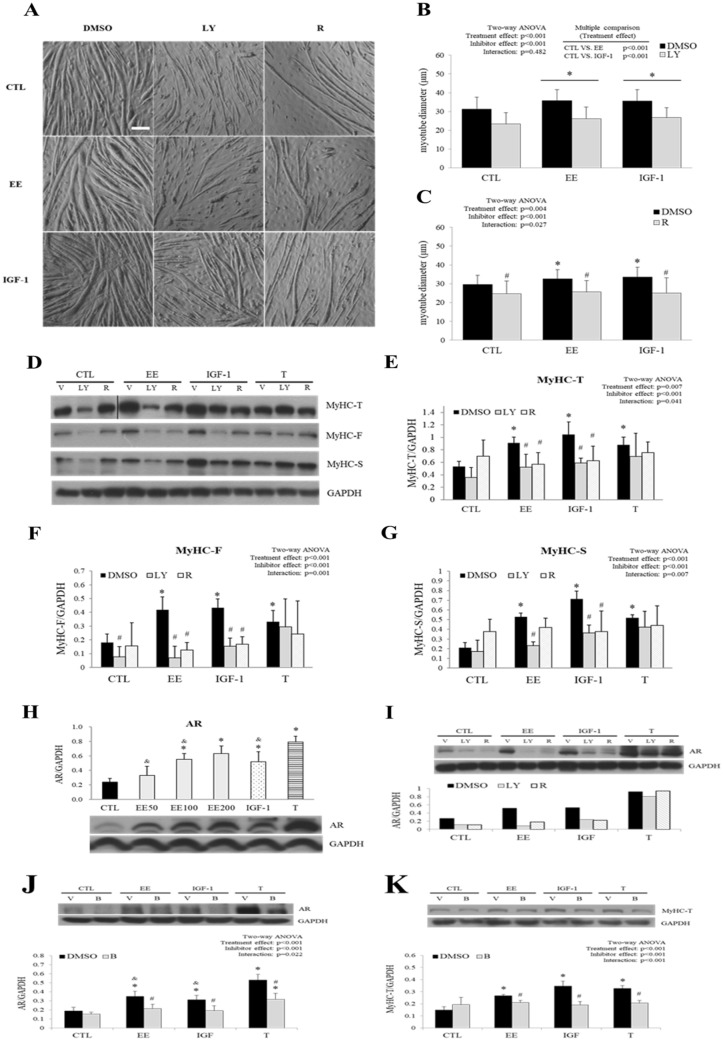
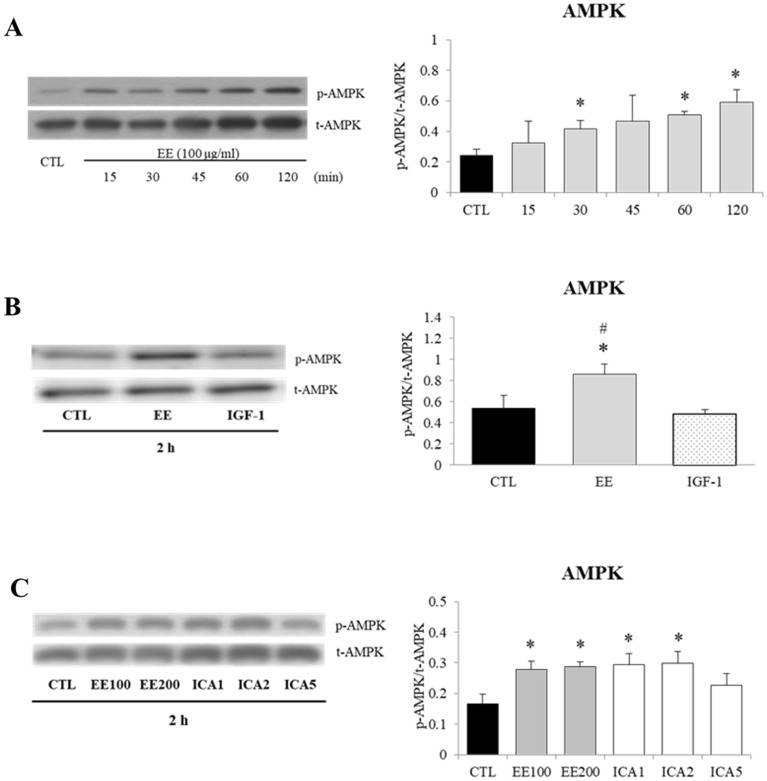
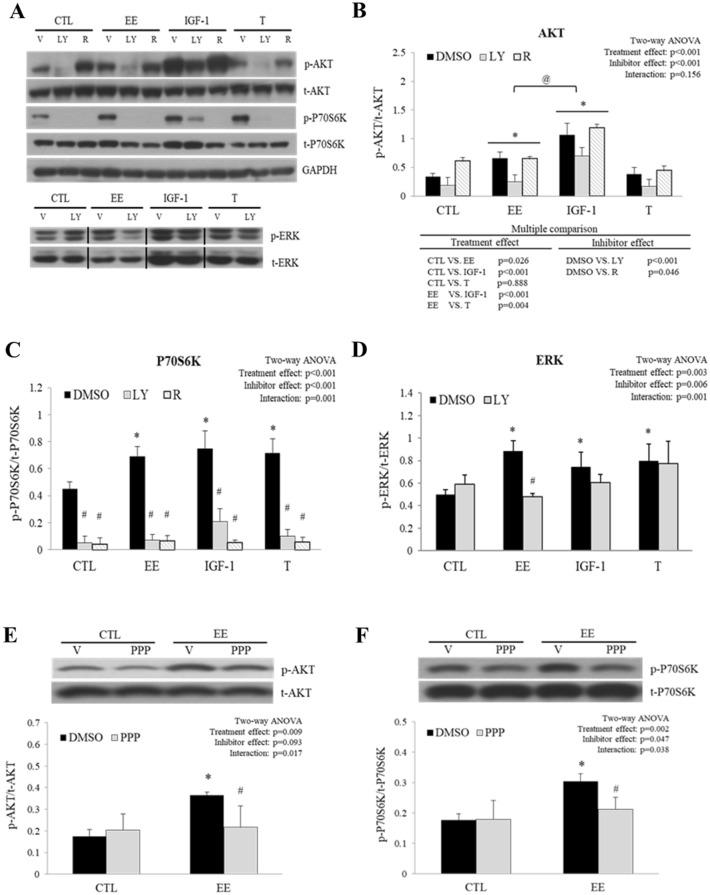
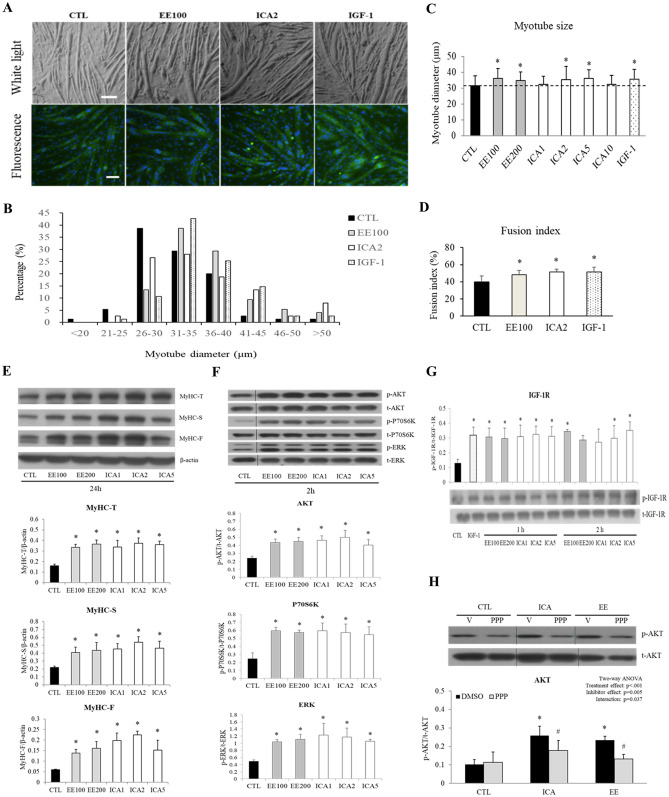
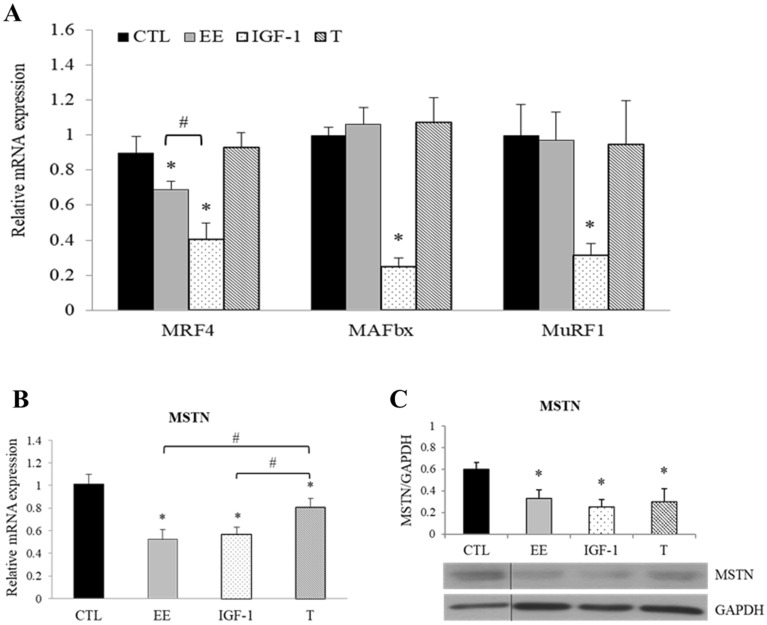
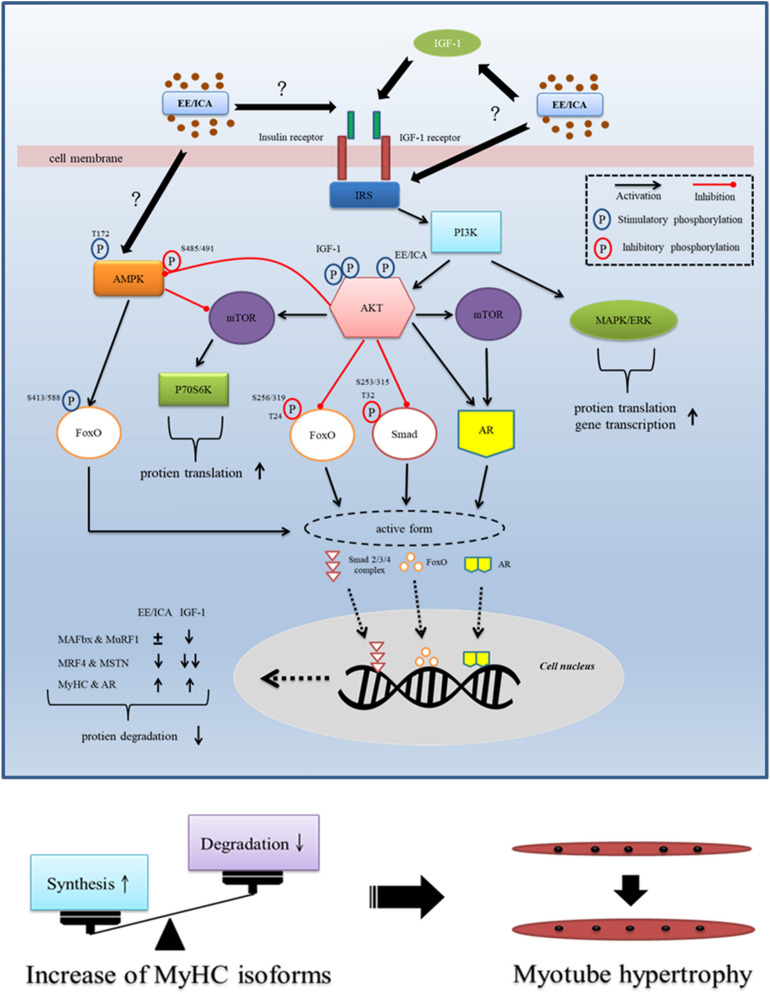
The regenerative effect of Epimedium and its major bioactive flavonoid icariin (ICA) have been documented in traditional medicine, but their effect on sarcopenia has not been evaluated. The aim of this study was to investigate the effects of Epimedium extract (EE) on skeletal muscle as represented by differentiated C2C12 cells. Here we demonstrated that EE and ICA stimulated C2C12 myotube hypertrophy by activating several, including IGF-1 signal pathways. C2C12 myotube hypertrophy was demonstrated by enlarged myotube and increased myosin heavy chains (MyHCs). In similar to IGF-1, EE/ICA activated key components of the IGF-1 signal pathway, including IGF-1 receptor. Pre-treatment with IGF-1 signal pathway specific inhibitors such as picropodophyllin, LY294002, and rapamycin attenuated EE induced myotube hypertrophy and MyHC isoform overexpression. In a different way, EE induced MHyC-S overexpression can be blocked by AMPK, but not by mTOR inhibitor. On the level of transcription, EE suppressed myostatin and MRF4 expression, but did not suppress atrogenes MAFbx and MuRF1 like IGF-1 did. Differential regulation of MyHC isoform and atrogenes is probably due to inequivalent AKT and AMPK phosphorylation induced by EE and IGF-1. These findings suggest that EE/ICA stimulates pathways partially overlapping with IGF-1 signaling pathway to promote myotube hypertrophy.


Conflict of interest statement

The authors declare no competing interests.

Figures

Figure 1
Figure 1
EE promoted C2C12 myotube hypertrophy and MyHC expression. (A) MTT assay was applied to determine the viability of undifferentiated C2C12 cells under various concentrations of EE at 24, 48, or 72 h. (B) Differentiated C2C12 cells were incubated in serum-free DMEM supplemented with 0 (CTL), 50, 100, or 200 μg/ml of EE. Representative photos were taken by a light microscope (scale bar, 100 μm) 48-h after EE treatment, which was then applied for measurement of myotube diameter (N = 90/group, data from three independent experiments). (C) The majority of C2C12 myotbe was measured around 26 to 30 μm under normal culture condition, various concentration of EE treatment significantly increased the average myotube diameter around 31 to 35 μm. (D) After 48-h treatment of vehicle (CTL), EE (50, 100, 200 μg/ml), IGF-1 (20 ng/ml), or testosterone (T, 500 nM), cells were stained with an immunofluorescent antibody against MyHC-T (green) and DAPI (blue). Scale bar, 100 μm. (E) Fusion index analysis indicated the percentage of nuclei in MyHC-positive myotube was increased after 100 μg/ml EE and IGF-1 treatment (N = 12 fields/group). (F) The abundance of MyHC expressed in C2C12 cells after 24-h treatment with vehicle (CTL), EE (50, 100, 200 μg/ml), IGF-1 (20 ng/ml), or testosterone (T, 500 nM) was evaluated by western blot assay (N = 4–6). The volume of bands stood for MyHC isoforms were digitally scanned and quantified by densitometry. After standardized with β-actin, the calculated densitometry data indicated that 24-h EE (100 and 200 μg/ml) treatment significantly increased the expression levels of MyHC-T (total, G), MyHC-F (fast type, H), and MyHC-S (slow type, I). IGF-1 and testosterone treatment served as positive controls. All data were expressed as mean ± SD. The symbol * stands for p < 0.05 as compared to CTL.
Figure 2
Figure 2
EE stimulated IGF-1 signal pathway in C2C12 cells. Differentiated C2C12 cells were overnight starved in serum-free medium before the indicated treatment. The levels of phosphorylated and total proteins before (CTL) and after EE (100 or 200 μg/ml) treatment were evaluated by Western blot for indicated time intervals (15–120 min). IGF-1 (20 ng/ml for 1 h) and testosterone (T, 500 nM for 1 h) treatment represented positive controls. (A,F) Western blot was performed by using specific antibodies against the phosphorylated and total proteins associated with the IGF-1 signal pathway. After standardized to β-actin or GAPDH, the level of target protein phosphorylation was semi-quantified by phosphorylated/total protein ratio, as shown in the followings IGF-1R (B), AKT (C), mTOR (D), P70S6K (E), and ERK (F) (N = 3–5). EE also activated all of the aforementioned proteins in a time sequence manner, only that the percentage of p-AKT was significantly lower than that induced by IGF-1 (G). After 24 h treatment, the ratio of the IGF-1 induced p-AKT was still significantly higher than those induced by EE (H) (N = 4). All data were expressed as mean ± SD. The symbol * stands for p < 0.05 as compared to CTL; the symbol # stands for p < 0.05 as compared to IGF-1.
Figure 3
Figure 3
PI3K and mTOR inhibitors abolished EE-induced myotube hypertrophy. Specific inhibitors LY294002 (LY, 10 μM), rapamycin (R 20 nM), or bicalutamide (B, 20 μM) were applied 30 min before EE (100 μg/ml), IGF-1 (20 ng/ml), testosterone (T, 500 nM) or control (CTL) treatment. DMSO (0.1%) served as the vehicle control (V). Differentiated C2C12 cells were maintained in serum-free medium and pre-treated with inhibitors or DMSO followed by indicated treatment for 24 h (western blot) or 48 h further (morphological analysis). (A) Representative photos were taken at the end of the indicated treatment by a light microscope (scale bar, 100 μm). (B,C) Myotube hypertrophy was determined by measurement of myotube diameter (N = 75/group). (D) The abundance of MyHC [total (T) as well as fast (F) and slow (S) isoforms] in cells treated with indicated regimen was detected by western blot, and the quantitative results are shown in (E–G) (N = 3–6). (H) The abundance of AR after treated for 24 h with EE, IGF-1, and T was examined with western blot. The effects of IGF-I inhibitor and T antagonist on AR were also detected in (I–K) (N = 3–5). All data were expressed as mean ± SD. The symbol * stands for p < 0.05 as compared to the basal (CTL or CTL-DMSO); the symbol # stands for p < 0.05 as compared to the intra-group DMSO treatment; the symbol & stands for p < 0.05 as compared to T or T-DMSO treatment.
Figure 4
Figure 4
Effects of EE and ICA on AMPK/Thr172 phosphorylation. Differentiated C2C12 cells were starved in serum-free medium overnight before EE (100, 200 μg/ml), ICA (1–5 μM), and IGF-1 (20 ng/ml) treatment. Representative western blot images and corresponding densitometry measurements were shown and presented as phosphorylated/total protein ratios. (A) A time interval ranging from 15–120 min showed a sequential appearance of the phosphorylated AMPK induced by EE (100 μg/mL) (N = 5). (B) After a 2-h treatment, AMPK was activated by EE, but not by IGF-1 (N = 3). (C) ICA (1–2 μM) treatment induced a similar degree of AMPK phosphorylation as EE did (N = 3). All data were expressed as mean ± SD. The symbol * stands for p < 0.05 as compared to CTL, the symbol # represents p < 0.05 as compared to IGF-1.
Figure 5
Figure 5
AKT and P70S6K phosphorylation induced by EE was attenuated by inhibitors targeted to the IGF-1 signal pathway. Differentiated C2C12 cells were starved in serum-free medium overnight before the treatment with control (CTL, no treatment), EE (100 μg/ml for 2 h), IGF-1 (20 ng/ml for 1 h), or testosterone (T, 500 nM for 1 h). In the reference group, cells were pre-treated with specific inhibitors such as LY294002 (LY, 10 μM), rapamycin (R, 20 nM), picropodophyllin (PPP, 5 μM), or 0.1% DMSO (served as vehicle control, V). The abundance of phosphorylated and total AKT, P70S6K, and ERK proteins was examined with western blots. Representative images are shown in (A) and the quantitative results are shown in (B–D) (N = 3–5). To prove that EE activated the cascade of IGF-1 signal pathway through IGF-1R, the selective IGF-1R antagonist PPP was included in the treatment. The representative AKT and P70S6K images and their quantitative ratios (phosphorylated/total) are shown in (E,F), respectively (N = 4). All data were expressed as mean ± SD. The symbol * stands for p < 0.05 as compared to CTL or CTL-DMSO; the symbol # stands for p < 0.05 as compared to intra-group DMSO; and the symbol @ stands for p < 0.05 as compared to IGF-1.
Figure 6
Figure 6
ICA equipotently induced myotube hypertrophy. Differentiated C2C12 cells were exposed to various concentrations of EE (100–200 μg/ml), ICA (1–5 μM), or IGF-1 (20 ng/ml) in serum-free medium for 1, 2, 24, or 48 h as indicated. (A) Representative images of bright fields (upper panel) and fluorescence MyHC (green) and DAPI (blue) of cells after 48-h incubation (scale bar, 100 μm). (B,C) Myotube diameter was measured by images captured from the light microscopy (N = 75/group). (D) Fusion index analysis indicated the percentage of nuclei in MyHC-positive myotube was increased after EE100, ICA2, and IGF-1 treatment (N = 12 fields/group). (E–H) Representative western blot images of MyHC isoforms and signaling transducers in cells treated with EE (100, 200 μg/ml) or ICA (1, 2, 5 μM) for the times indicated. Their quantitative results are shown at the lower panels (N = 3–4). In (H), picropodophyllin (PPP, 5 μM) or 0.1% DMSO (served as vehicle control) was applied 2 h prior to CTL (basal), ICA (2 μM), or EE (100 μg/ml) treatment (N = 3–5). All data were expressed as mean ± SD. The symbol * stands for p < 0.05 as compared to CTL or CTL-DMSO; the symbol # stands for p < 0.05 as compared to intra-group DMSO.
Figure 7
Figure 7
Muscle-specific genes related to hypertrophy regulated by EE. Differentiated C2C12 cells were treated with serum free medium (CTL), EE (100 μg/ml), IGF-1 (20 ng/ml), or testosterone (T, 500 nM). The change of indicated gene expression after 24 h treatment with aforementioned regimens was assessed by qPCR or western blot. (A) While IGF-1 significantly down-regulated the expression levels of MRF4, MAFbx and MuRF1 genes, EE could only down-regulate MRF4; and T has no regulatory effect (N = 5). (B,C) The expression of myostatin (MSTN; full-length precursor, 43 kDa) was down-regulated by IGF-1, EE and T (N = 4). The abundance of the PCR amplified fragment of the interested gene was measured and expressed as 2−ΔΔCT after a correction to the simultaneously amplified GAPDH. All data were expressed as mean ± SD. The symbol * stands for p < 0.05 as compared to basal (CTL); the symbol # stands for p < 0.05 as compared to T.
Figure 8
Figure 8
Schematic illustration showing EE and ICA promote myotube hypertrophy via IGF-1 signal pathway. Through triggering IGF-1R autophosphorylation, EE/ ICA activates key components of the IGF-1 signal cascades. As a consequence, the expression of MyHC and AR was up-regulated by the AKT/mTOR axis. In addition, two protein degradation signals, i.e. FoxO and MSTN/Smad are likely simultaneously inhibited by AKT to prevent from nuclear accumulation. Intranuclear FoxO induces atrogenes MAFbx and MuRF1 transcription, extranuclearly translocation of the phosphorylated FoxO induced by IGF-1 deactivates atrogene expression. Although EE and ICA may also reduce FoxO nuclear localization and MAFbx and MuRF1 transcription by activating AKT, the simultaneously activated AMPK/Thr172 reversely enhances FoxO function to result in a neutralizing effect on gene transcription. In contrast, heavier AKT phosphorylation induced by IGF-1 may induce AMPK/Ser485/491 phosphorylation instead, which may reduce the AMPK activity. The MSTN/Smad is another pathway to modulate protein degradation. The restricted function of Smad induced by AKT activation leads to a decrease of MSTN production. EE also suppresses the expression of MRF4 which is highly expressed in mature myotube as a growth repressor. To summarize, EE/ICA induces positive net protein balance by increasing MyHC isoforms and simultaneously suppressing atrogenes expression, which eventually leads to C2C12 myotube hypertrophy.

Similar articles

Cited by

References

    1. Schnyder S, Handschin C. Skeletal muscle as an endocrine organ : PGC-1 α, myokines and exercise. Bone. 2015;80:115–125. doi: 10.1016/j.bone.2015.02.008. - DOI - PMC - PubMed
    1. Little JP, Phillips SM. Resistance exercise and nutrition to counteract muscle wasting. Appl. Physiol. Nutr. Metab. 2009;34:817–828. doi: 10.1139/H09-093. - DOI - PubMed
    1. Cohen S, Nathan JA, Goldberg AL. Muscle wasting in disease: Molecular mechanisms and promising therapies. Nat. Rev. Drug Discov. 2015;14:58–74. doi: 10.1038/nrd4467. - DOI - PubMed
    1. Magne H, Savary-Auzeloux I, Rémond D, Dardevet D. Nutritional strategies to counteract muscle atrophy caused by disuse and to improve recovery. Nutr. Res. Rev. 2013;26:149–165. doi: 10.1017/S0954422413000115. - DOI - PubMed
    1. Engelbrecht AM, et al. Daily brief restraint stress alters signaling pathways and induces atrophy and apoptosis in rat skeletal muscle. Stress. 2010;13:132–141. doi: 10.3109/10253890903089834. - DOI - PubMed

Publication types

MeSH terms

LinkOut - more resources