. 2021 May 24;11(1):10814.
doi: 10.1038/s41598-021-90184-9.

Folliculin haploinsufficiency causes cellular dysfunction of pleural mesothelial cells

Affiliations

Folliculin haploinsufficiency causes cellular dysfunction of pleural mesothelial cells

Shouichi Okamoto et al. Sci Rep. .

Abstract

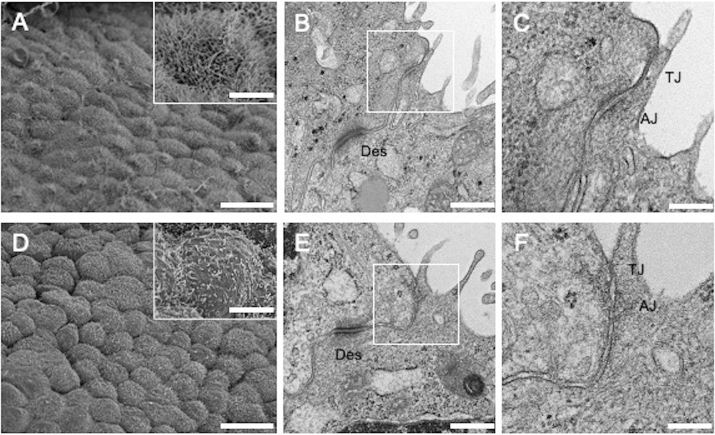
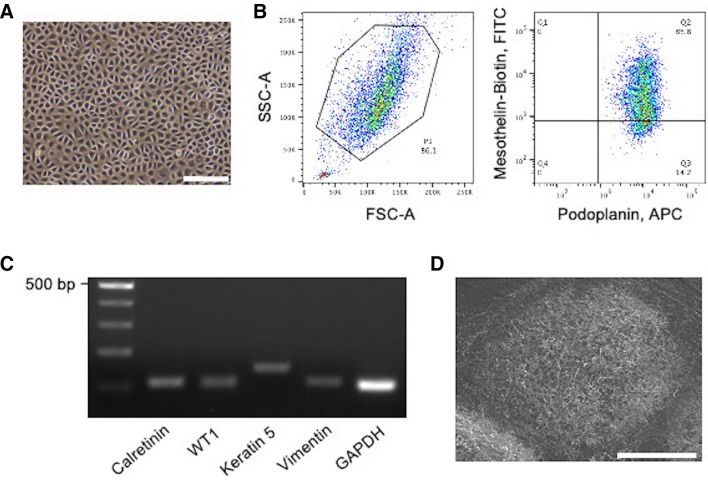
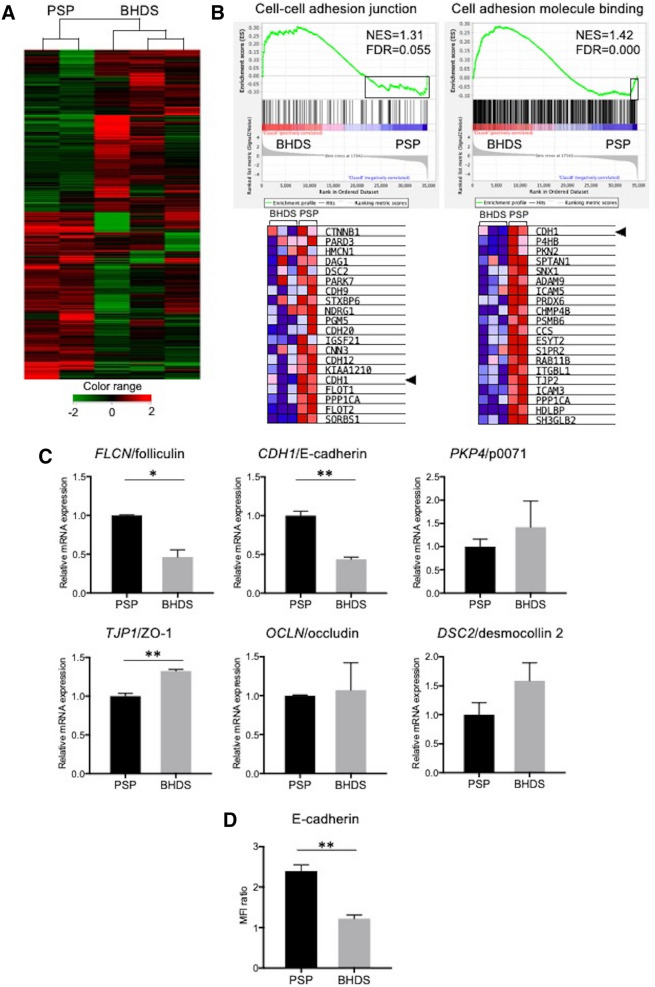
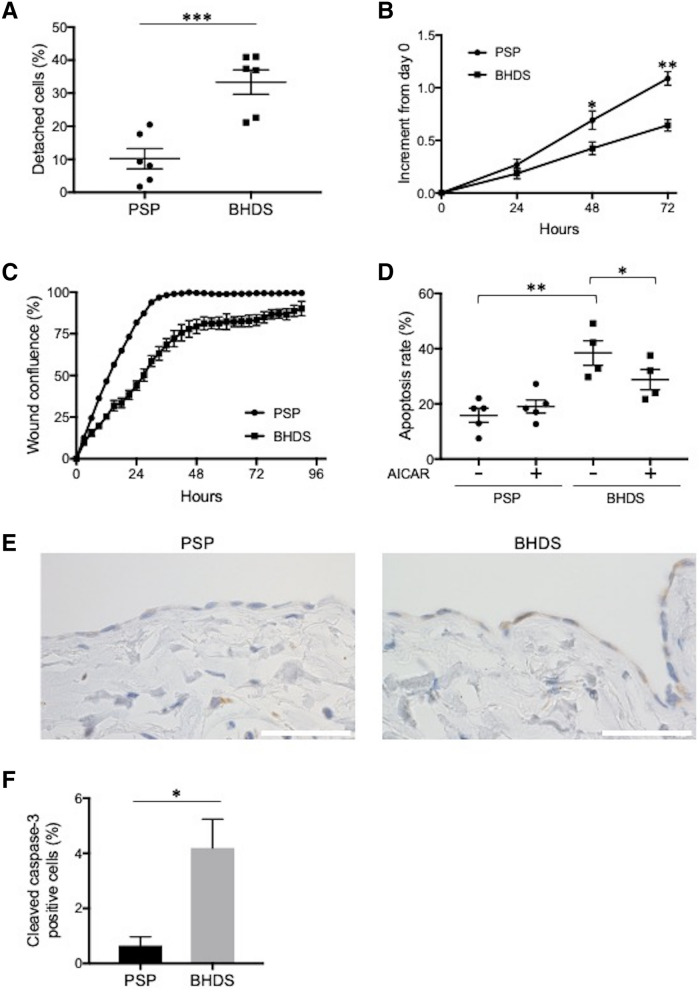
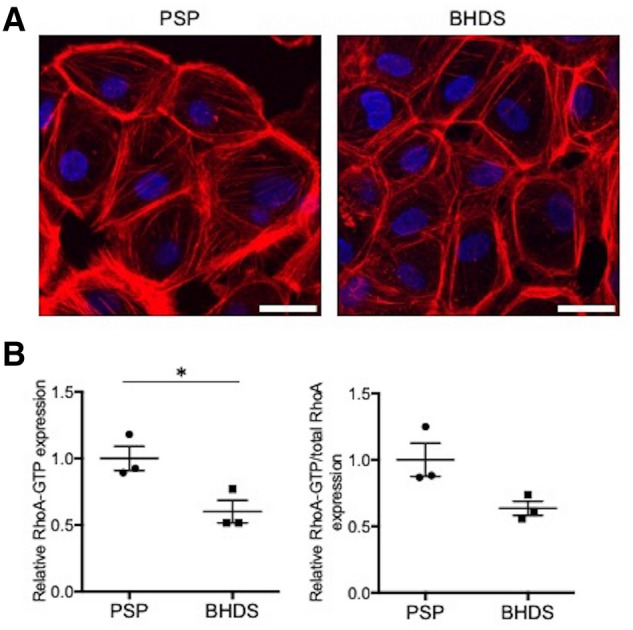
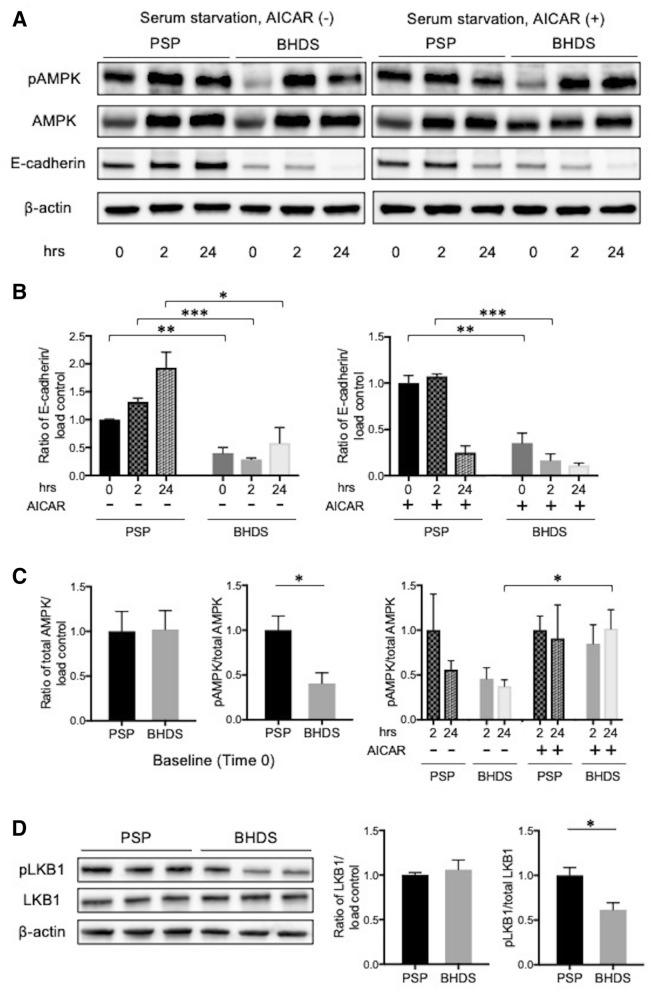
Birt-Hogg-Dubé syndrome (BHDS), an autosomal dominant inheritance disease caused by folliculin (FLCN) mutations, is associated with lung cysts and spontaneous pneumothorax. The possibility of FLCN haploinsufficiency in pleural mesothelial cells (PMCs) contributing to development of pneumothorax has not yet been clarified. Electron microscopy revealed exposed intercellular boundaries between PMCs on visceral pleura and decreased electron density around the adherens junctions in BHDS. To characterize cellular function of PMCs in BHDS patients (BHDS-PMCs), during surgery for pneumothorax, we established the flow cytometry-based methods of isolating high-purity PMCs from pleural lavage fluid. BHDS-PMCs showed impaired cell attachment and a significant decrease in proliferation and migration, but a significant increase in apoptosis compared with PMCs from primary spontaneous pneumothorax (PSP) patients (PSP-PMCs). Microarray analysis using isolated PMCs revealed a significant alteration in the expression of genes belonging to Gene Ontology terms "cell-cell adhesion junction" and "cell adhesion molecule binding". Gene set enrichment analysis demonstrated that CDH1, encoding E-cadherin, was identified in the down-regulated leading edge of a plot in BHDS-PMCs. AMPK and LKB1 activation were significantly impaired in BHDS-PMCs compared with PSP-PMCs. Our findings indicate that FLCN haploinsufficiency may affect the E-cadherin-LKB1-AMPK axis and lead to abnormal cellular function in BHDS-PMCs.


Conflict of interest statement

The authors declare no competing interests.

Figures

Figure 1
Figure 1
Electron microscopic photographs of visceral pleura from PSP and BHDS patients. (AC) Show PSP and Figures (DF) show BHDS (n = 3 for both PSP and BHDS). (A,D) are SEM images. (B,C,E,F) Are TEM images of cell–cell junctions. The insets within (A,D) are magnified views of PMCs. (C,F) Are the magnified views of the areas indicated by white rectangles within (B,E), respectively. Scale bars represent 20 μm (A,D), 5 μm (the insets within A,D), 500 nm (B,E) and 200 nm (C,F). AJ adherens junction, Des desmosome, SEM scanning electron microscope, TEM transmission electron microscope, TJ tight junction.
Figure 2
Figure 2
Isolation and characterization of human PMCs from pleural lavage. (A) Representative photomicrograph of confluently growing cells obtained from pleural lavage in PSP patient. (B) Representative fluorescence-activated cell sorting dot plots of cultured cells. The left panel shows plots of the forward-scattered (horizontal) versus side-scattered (vertical) axes. The right panel represents the fluorescent intensities of APC (conjugated with the anti-podoplanin antibody) and FITC (conjugated with the biotinylated anti-mesothelin antibody), respectively. The Q2 area indicates the gateway for sorting PMCs (podoplanin-positive and mesothelin-positive cells). (C) The expression of MC markers (calretinin, WT1, keratin 5, and vimentin) examined in PSP-PMCs by RT-PCR. GAPDH was amplified as a control gene for RT-PCR. Gel electrophoresis of amplified products showed a discrete band with expected fragment size from each reaction. (D) SEM image of PSP-PMCs showing numerous microvilli characteristic of MCs. Scale bars represent 200 μm (A) and 20 μm (D), respectively. APC allophycocyanin, bp base pair, FITC fluorescein isothiocyanate, FSC-A forward scatter area, GAPDH glyceraldehyde 3-phosphate dehydrogenase, SSC-A side scatter area, WT1 Wilms’ tumor 1.
Figure 3
Figure 3
Gene expression microarray analysis and the validation of microarray data by qRT-PCR. (A) Hierarchical clustering analysis in PSP-PMCs (n = 2) and BHDS-PMCs samples (n = 3). A dendrogram, consisting of 3378 genes with a fold change > 1.5, shows the grouping of genes based on the similarity between them. Increased and decreased gene expression is shown from red to green, respectively. The color-range bar indicates a log2 fold change. The analysis illustrated that PSP-PMCs and BHDS-PMCs separated into 2 different groups. The data were processed and analyzed using GeneSpring14.9.1 (http://genespring-support.com/). (B) Results of GSEA of BHDS-PMCs compared to PSP-PMCs utilizing the GO terms “cell–cell adhesion junction” and “cell adhesion molecule binding” (upper panel). The bar-code plots indicate the position of each gene within the expression data, rank-sorted by its association with BHDS-PMCs, with the red and blue colors representing overexpression and underexpression in the mRNA, respectively. The lower panel displays heat maps of the bottom 20 genes in BHDS-PMCs, which are indicated by black rectangle within the upper panel. CDH1, which encodes E-cadherin (the main constituent of adherens junction), was the 5th and 20th lowest downregulated gene in the 2 gene sets, respectively (arrowheads). (C) Findings from testing of the mRNA expression levels of FLCN and various other genes as measured for cell–cell junction by qRT-PCR. The vertical axes indicate the relative ratios of mRNA expression (BHDS/PSP) normalized against GAPDH. All reactions were conducted in triplicate for each sample (PSP, n = 2; BHDS, n = 3). (D) The expression level of E-cadherin by flow cytometry was tested for group differences (PSP, n = 3; BHDS, n = 3). Data are shown as mean ± SEM. * = p < 0.05; ** = p < 0.01 (unpaired t-test). FDR false discovery rate, GAPDH glyceraldehyde 3-phosphate dehydrogenase, GSEA gene expression microarray analysis, MFI mean fluorescence intensity, NES normalized enrichment score, ZO-1 zonula occludens-1.
Figure 4
Figure 4
Comparison of cellular characteristics between PSP- and BHDS-PMCs. (A) Plot of cell detachment assay findings. PMCs growing nearly confluent on 12-well culture dish were incubated with 1 mM EGTA for 20 min. The percentage of detached cells was computed by dividing the number of detached PMCs by the total number of PMCs. The vertical axis indicates the percentage of detached cells. The circles and squares within the plot depict the mean values of the 3 replicates in each sample (PSP, n = 6; BHDS, n = 6). (B) Plot of proliferation assay results. The vertical axis indicates the increase of absorbance at 450 nm from baseline (increment from day 0). 1 × 104 PMCs at passage 1 were seeded on 96-well culture with triplicate (PSP, n = 4; BHDS, n = 4). (C) Plot of wound cell migration assay findings. 1 × 104 PMCs at passage 1 were seeded on 96-well culture with triplicate. The vertical axis indicates the percentage of wound confluence (PSP, n = 3, BHDS, n = 3). (D) Plot of results from apoptosis assay by flow cytometry. PMCs growing nearly confluent on 12-well culture dish were incubated in complete medium with or without 0.5 mM AICAR for 24 h, then harvested by 0.05% trypsin/0.2 mM EDTA and the percentage of apoptotic cells was determined. The vertical axis indicates the percentage of apoptotic cells. The circles and squares within the plot depict the mean values of the 3 replicates in each sample (PSP, n = 5; BHDS, n = 4). (E) Representative photomicrographs showing the immunostaining of cleaved caspase-3 in paraffin-embedded lung tissues of PSP and BHDS patients. PMCs are lining on the surface of visceral pleura. In BHDS (a right photomicrograph), area where several cleaved caspase-3-positive PMCs is gathering on the visceral pleura. Scale bars represent 50 μm. (F) The ratio of cleaved caspase-3-positive PMCs in the resected lung tissues. At least 300 PMCs on visceral pleura were evaluated in each lung tissue (PSP, n = 3; BHDS, n = 3). All data are shown as mean ± SEM. The central horizontal lines in Figures (A,D) indicate the position of the mean values. * = p < 0.05; ** = p < 0.01; *** = p < 0.001 (unpaired t-test). AICAR 5-aminoimidazole-4-carboxamide ribonucleotide, EDTA ethylenediaminetetraacetic acid, EGTA ethyleneglycol-bis-(β-aminoethyl ether)-N,N,N′,N′-tetraacetic acid.
Figure 5
Figure 5
Comparison of F-actin formation and RhoA activity between PSP- and BHDS-PMCs. (A) Representative confocal photomicrographs of phalloidin staining in PSP- and BHDS-PMCs (PSP, n = 3; BHDS, n = 3). At passage 1, 3 × 105 PMCs were seeded onto a 35 mm glass-bottom dish until the cells became confluent. Scale bars represent 20 μm. (B) Plot of the levels of active RhoA-GTP and total RhoA. The vertical axis in the left plot indicates the relative RhoA-GTP expression when normalized by the mean level of RhoA-GTP in PSP-PMCs. At passage 1, 3 × 105 PMCs were seeded on a collagen-coated 6-well plate, cultured until approximately 70% confluence, and then utilized for the measurement. The vertical axis in the left panel indicates the relative ratio of RhoA-GTP when normalized by the mean level of RhoA-GTP in PSP-PMCs. The vertical axis in the right plot indicates the relative ratio of RhoA-GTP/total RhoA when normalized by the mean level of RhoA-GTP/total RhoA in PSP-PMCs. The circles and squares indicate the measured values of each sample (PSP, n = 3; BHDS, n = 3) and the central horizontal lines indicate the position of mean values. The data are shown as mean ± SEM. * = p < 0.05 (unpaired t-test).
Figure 6
Figure 6
Comparison of status of the E-cadherin-LKB1-AMPK axis between PSP- and BHDS-PMCs. (A) Representative findings from Western blot analysis for phospho-AMPK (pAMPK), total AMPK, E-cadherin, and β-actin (load control)(PSP, n = 3; BHDS, n = 3). PMCs were serum-starved for 24 h without or with 1 mM AICAR and then harvested for analysis. (B) Graphs of results from quantitative analysis of E-cadherin expression on Western blot without (left panel) or with 1 mM AICAR (right panel). The vertical axes represent the ratio of E-cadherin/β-actin when normalized by the mean value of E-cadherin/β-actin at baseline in PSP-PMCs. Data are shown as mean ± SEM from 3 independent experiments. (C) Graphs of results from quantitative analyses of total AMPK and pAMPK/total AMPK ratios on Western blot. The ratios of total AMPK/β-actin (left panel) and pAMPK/total AMPK at baseline (middle panel) in PSP- and BHDS-PMCs are shown. The right panel shows the ratio of pAMPK/total AMPK without and with 1 mM AICAR. Each vertical axis represents the ratio when normalized by the mean value of pAMPK/total AMPK in PSP-PMCs at 2 h after incubation. Data are shown as mean ± SEM. (D) Representative findings from Western blot analyses for phospho-LKB1 (pLKB1), total LKB1, and β-actin (left panel), quantitative analyses of total LKB1 (middle panel), and the ratio of pLKB1/total LKB1 in the complete medium (right panel). All data are shown as mean ± SEM. * = p < 0.05; ** = p < 0.01; *** = p < 0.001 (unpaired t-test). AICAR 5-aminoimidazole-4-carboxamide ribonucleotide.

Similar articles

Cited by

References

    1. Birt AR, Hogg GR, Dube WJ. Hereditary multiple fibrofolliculomas with trichodiscomas and acrochordons. Arch. Dermatol. 1977;113:1674–1677. doi: 10.1001/archderm.1977.01640120042005. - DOI - PubMed
    1. Schmidt LS, et al. Germline BHD-mutation spectrum and phenotype analysis of a large cohort of families with Birt–Hogg–Dube syndrome. Am. J. Hum. Genet. 2005;76:1023–1033. doi: 10.1086/430842. - DOI - PMC - PubMed
    1. Toro JR, et al. BHD mutations, clinical and molecular genetic investigations of Birt–Hogg–Dube syndrome: a new series of 50 families and a review of published reports. J. Med. Genet. 2008;45:321–331. doi: 10.1136/jmg.2007.054304. - DOI - PMC - PubMed
    1. Baba M, et al. Folliculin encoded by the BHD gene interacts with a binding protein, FNIP1, and AMPK, and is involved in AMPK and mTOR signaling. Proc. Natl. Acad. Sci. U. S. A. 2006;103:15552–15557. doi: 10.1073/pnas.0603781103. - DOI - PMC - PubMed
    1. Hasumi H, et al. Identification and characterization of a novel folliculin-interacting protein FNIP2. Gene. 2008;415:60–67. doi: 10.1016/j.gene.2008.02.022. - DOI - PMC - PubMed

Publication types

MeSH terms

LinkOut - more resources