. 2021 May 24;11(1):10738.
doi: 10.1038/s41598-021-90265-9.

COVID-19 diagnosis by routine blood tests using machine learning

Affiliations

COVID-19 diagnosis by routine blood tests using machine learning

Matjaž Kukar et al. Sci Rep. .

Abstract

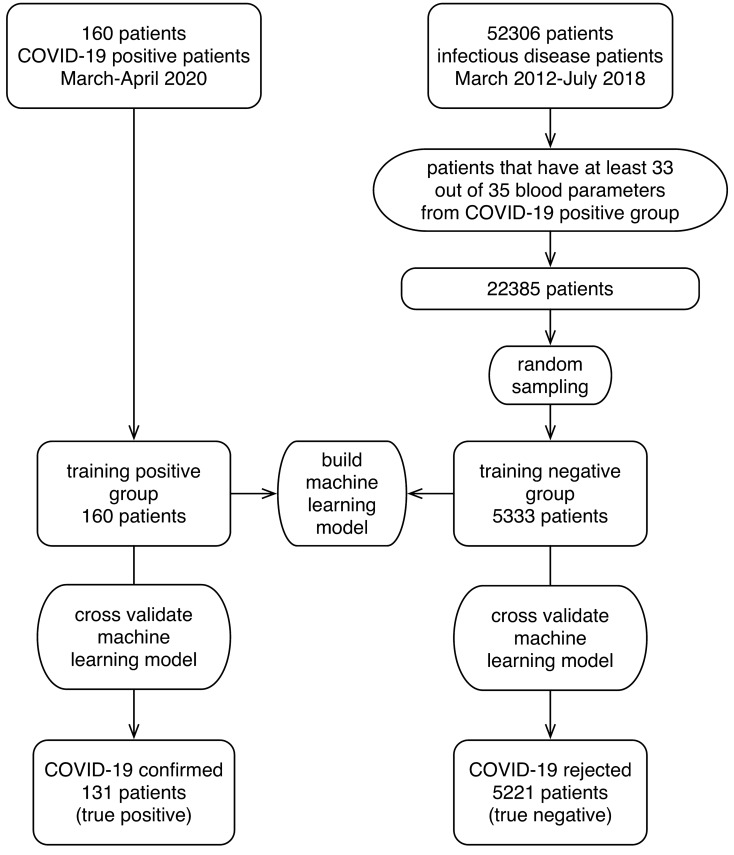
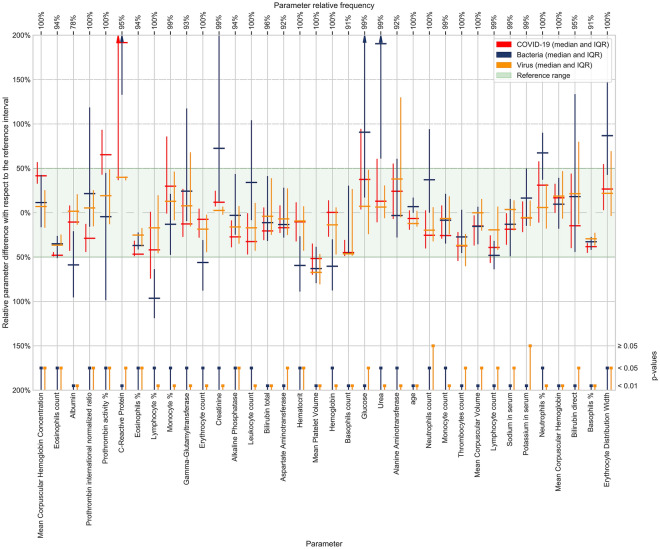
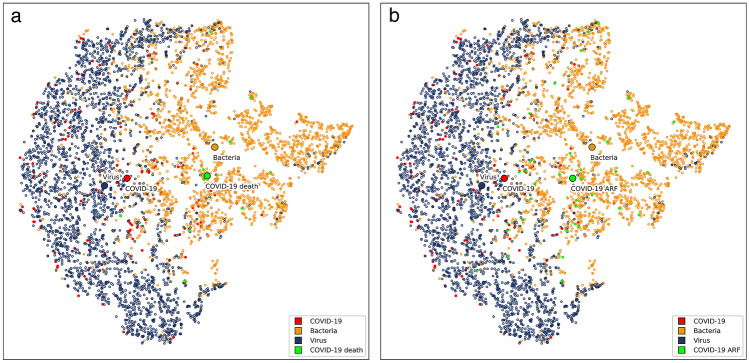
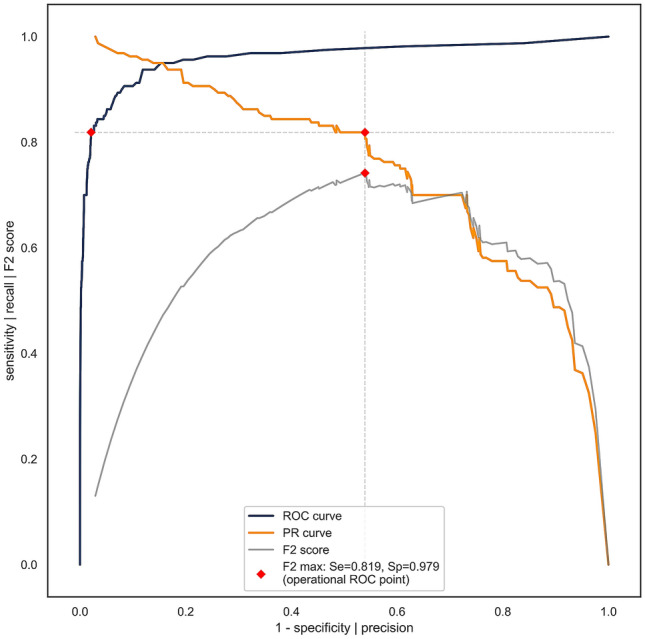
Physicians taking care of patients with COVID-19 have described different changes in routine blood parameters. However, these changes hinder them from performing COVID-19 diagnoses. We constructed a machine learning model for COVID-19 diagnosis that was based and cross-validated on the routine blood tests of 5333 patients with various bacterial and viral infections, and 160 COVID-19-positive patients. We selected the operational ROC point at a sensitivity of 81.9% and a specificity of 97.9%. The cross-validated AUC was 0.97. The five most useful routine blood parameters for COVID-19 diagnosis according to the feature importance scoring of the XGBoost algorithm were: MCHC, eosinophil count, albumin, INR, and prothrombin activity percentage. t-SNE visualization showed that the blood parameters of the patients with a severe COVID-19 course are more like the parameters of a bacterial than a viral infection. The reported diagnostic accuracy is at least comparable and probably complementary to RT-PCR and chest CT studies. Patients with fever, cough, myalgia, and other symptoms can now have initial routine blood tests assessed by our diagnostic tool. All patients with a positive COVID-19 prediction would then undergo standard RT-PCR studies to confirm the diagnosis. We believe that our results represent a significant contribution to improvements in COVID-19 diagnosis.


Conflict of interest statement

Marko Notar is the CEO of Smart Blood Analytics SA. Matjaž Kukar, Gregor Gunčar, and Mateja Notar are Smart Blood Analytics advisors, and other authors declare no competing interests.

Figures

Figure 1
Figure 1
A flow chart of patients included in the model building and validation process.
Figure 2
Figure 2
Blood parameters sorted by their XGBoost importance score. More important parameters are shown on the left. Group median values and IQR of the blood parameters used in model building are shown, centered, and scaled to reference intervals. Median bar for the C-reactive protein in bacterial infections is out of the scale at 38 mg/L. Groups (COVID-19/other virus/bacteria) were evaluated by the Anderson–Darling test. The significance levels (0.05 or 0.01) of the test results are depicted at the bottom of the figure.
Figure 3
Figure 3
Visualization of bacteria/virus/COVID-19 parameter space with t-SNE method. Each dot represents a patient or more specifically, an embedding of his/her blood parameters into a two-dimensional space, and its color represents the group. Blue dots represent patients with viral infections other than COVID-19, orange dots patients with bacterial infections and red dots patients with COVID-19. Green dots in panel (a) represent COVID-19 patients who died (10 patients) and in panel (b) COVID-19 patients diagnosed with acute respiratory failure (38 patients). Medoids of bacteria/virus/COVID-19/”COVID-19 death” groups on panel (a) and bacteria/virus/COVID-19/”COVID-19 ARF” groups on panel (b) are also marked.
Figure 4
Figure 4
ROC, PR (precision-recall), and F2 curves for COVID-19 diagnosis calculated from the training data using ten-fold stratified cross-validation. Vertical and horizontal dashed lines connect the F2 (gray) max point with the PR curve (orange) and the ROC curve (blue) in order to obtain the operational ROC point with sensitivity = 0.819, specificity = 0.979 (depicted with red dots), and AUC = 0.97.

References

    1. Zhu N, Zhang D, Wang W, Li X, Yang B, et al. A novel coronavirus from patients with pneumonia in China, 2019. N. Engl. J. Med. 2020;382:727–733. doi: 10.1056/NEJMoa2001017. - DOI - PMC - PubMed
    1. Gorbalenya A, Baker S, Baric R, de Groot R, Drosten C, et al. The species severe acute respiratory syndrome related coronavirus: Classifying 2019-nCoV and naming it SARS-CoV-2. Nat. Microbiol. 2020;5:536–544. doi: 10.1038/s41564-020-0695-z. - DOI - PMC - PubMed
    1. Sanche S, Lin YT, Xu C, Romero-Severson E, Hengartner N, et al. High contagiousness and rapid spread of severe acute respiratory syndrome coronavirus 2. Emerg. Infect. Dis. 2020;26:1. doi: 10.3201/eid2607.200282. - DOI - PMC - PubMed
    1. World health organization. WHO Director-General’s remarks at the media briefing on 2019-nCoV on 11 February 2020. https://www.who.int/dg/speeches/detail/who-director-general-s-remarks-at... (2020).
    1. Guan WJ, Ni ZY, Hu Y, Liang WH, Ou CQ, et al. Clinical characteristics of coronavirus disease 2019 in China. N. Engl. J. Med. 2020;1:1. - PMC - PubMed