. 2021 May 24;11(1):10741.
doi: 10.1038/s41598-021-90226-2.

Refinement of 16S rRNA gene analysis for low biomass biospecimens

Affiliations

Refinement of 16S rRNA gene analysis for low biomass biospecimens

Remy Villette et al. Sci Rep. .

Abstract

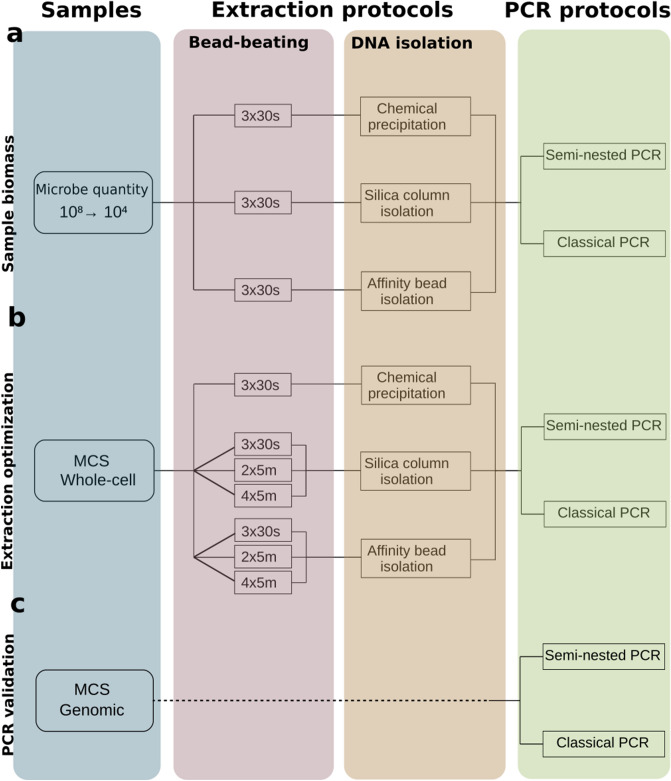
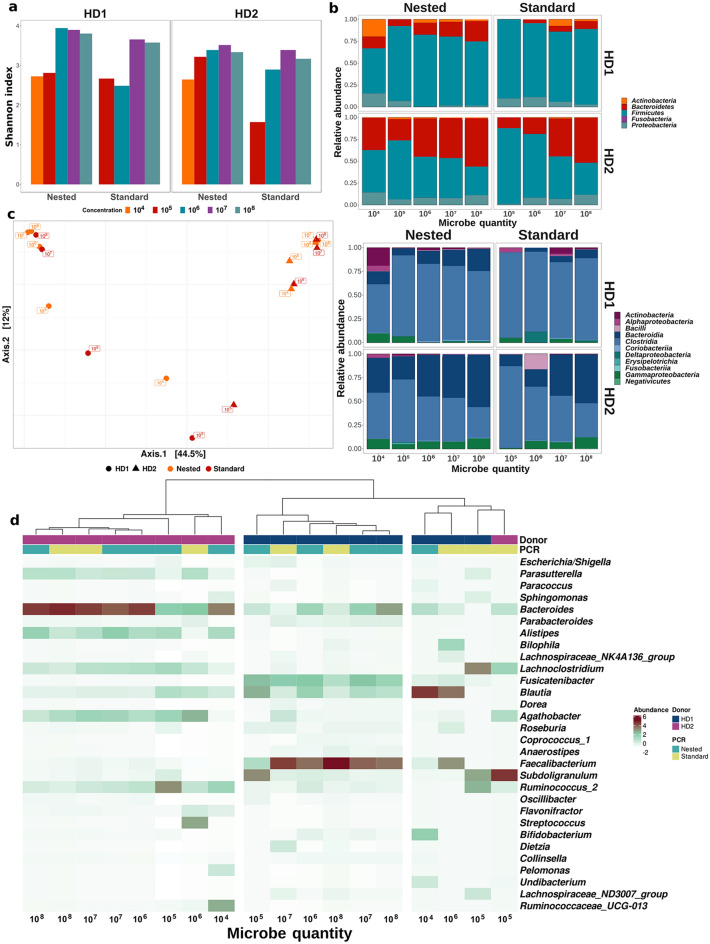
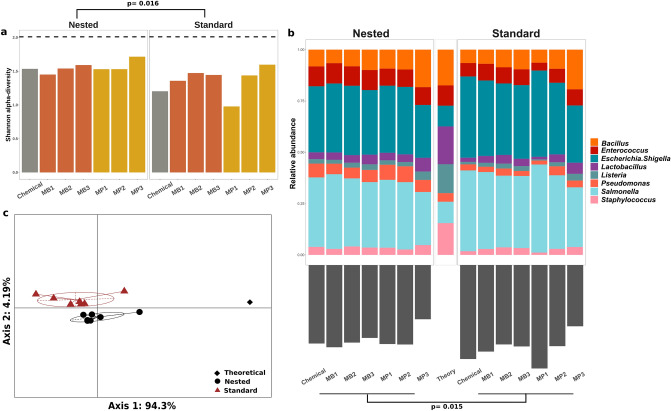
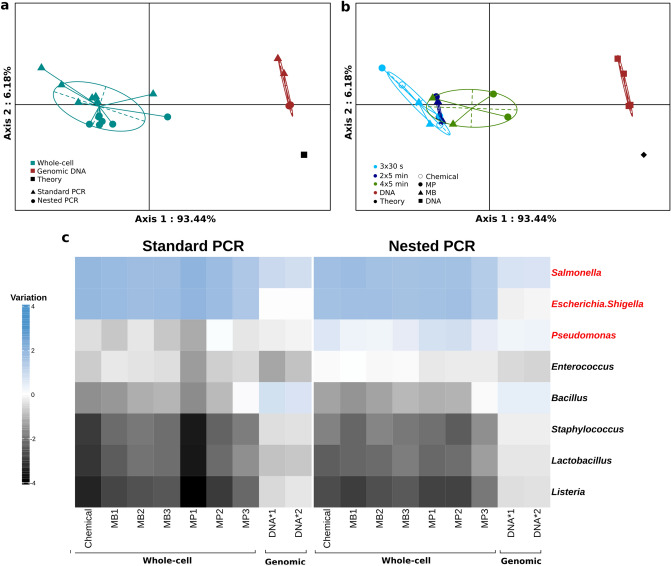
High-throughput phylogenetic 16S rRNA gene analysis has permitted to thoroughly delve into microbial community complexity and to understand host-microbiota interactions in health and disease. The analysis comprises sample collection and storage, genomic DNA extraction, 16S rRNA gene amplification, high-throughput amplicon sequencing and bioinformatic analysis. Low biomass microbiota samples (e.g. biopsies, tissue swabs and lavages) are receiving increasing attention, but optimal standardization for analysis of low biomass samples has yet to be developed. Here we tested the lower bacterial concentration required to perform 16S rRNA gene analysis using three different DNA extraction protocols, three different mechanical lysing series and two different PCR protocols. A mock microbiota community standard and low biomass samples (108, 107, 106, 105 and 104 microbes) from two healthy donor stools were employed to assess optimal sample processing for 16S rRNA gene analysis using paired-end Illumina MiSeq technology. Three DNA extraction protocols tested in our study performed similar with regards to representing microbiota composition, but extraction yield was better for silica columns compared to bead absorption and chemical precipitation. Furthermore, increasing mechanical lysing time and repetition did ameliorate the representation of bacterial composition. The most influential factor enabling appropriate representation of microbiota composition remains sample biomass. Indeed, bacterial densities below 106 cells resulted in loss of sample identity based on cluster analysis for all tested protocols. Finally, we excluded DNA extraction bias using a genomic DNA standard, which revealed that a semi-nested PCR protocol represented microbiota composition better than classical PCR. Based on our results, starting material concentration is an important limiting factor, highlighting the need to adapt protocols for dealing with low biomass samples. Our study suggests that the use of prolonged mechanical lysing, silica membrane DNA isolation and a semi-nested PCR protocol improve the analysis of low biomass samples. Using the improved protocol we report a lower limit of 106 bacteria per sample for robust and reproducible microbiota analysis.


Conflict of interest statement

The authors declare no competing interests.

Figures

Figure 1
Figure 1
Summary of technical approaches presented in this paper. (a) Protocol for low biomass healthy donor stool samples containing 108, 107, 106, 105 and 104 microbes. (b) Protocol tested on whole-cell mock microbial community standard (MCS). (c) PCR protocols used on genomic DNA mock microbial community standard. Figures were generated using R.
Figure 2
Figure 2
Effect of low biomass and PCR protocols on the representation of microbiota composition. (a) Alpha-diversity of low biomass samples. (b) Microbial composition at Phylum (upper panel) and Class (lower panel) phylogenetic level. (c) Principal coordinate analysis (PCoA) of samples using Bray–Curtis distance. Samples are labeled based on their cell content, shape represents donors and colors represent PCR protocols for each sample. (d) Heatmap of the top 30 most abundant genera, clustered using Bray–Curtis distance. Donor origin is represented by the first color layer and PCR protocols are represented by the second color layer. Of note, all samples were exposed to the same DNA extraction protocol (bead-beating for 3 × 30 s and purified on silica filters). Figures were generated using R.
Figure 3
Figure 3
Extraction and PCR protocols effect on the representation of commercial mock microbial community standard composition. Microbial community standard was exposed to three DNA isolation methods (Chemical, Magnetic Beads (MB) and Miniprep kit (MP)), 3 mechanical lysing protocols (3 × 30 s, 2 × 5 min and 4 × 5 min, coined 1, 2 and 3, respectively) and two 16S rRNA gene PCR amplification protocols (Standard and Nested). Bacterial composition stratified according to DNA extraction and PCR was analyzed for (a) alpha-diversity (Dashed-line represents the theoretical Shannon index calculated with the supplier-furnished theoretical abundances), (b) Abundance profiles (upper panel) and Bray–Curtis distance between samples and theoretical composition (lower panel) and (c) Principal coordinate analysis (PCoA) based on Bray–Curtis distance discriminates between the two PCR protocols (colors). Paired statistical analysis was applied to investigate Alpha-diversity and Bray–Curtis distance differences between Standard and Nested PCR protocols (Wilcoxon test). Figures were generated using R.
Figure 4
Figure 4
Extended mechanical lysing improves representation of gram-positive bacteria. (a) PCoA of whole-cell (cyan) and genomic DNA (brown) samples compared to the theoretical abundance profile (black). (b) The same PCoA was subjected to stratification of whole cell standards according to extraction protocol (mechanical lysing and DNA isolation). (c) Heatmap of variation from the theoretical abundance for all microbial community standards (columns) amplified by Standard (left panel) or Nested (right panel) PCR. The 8 bacterial taxa of the mock microbial community standard were ordered according to Gram-status; gram-negative (red) and gram-positive (black). Variation from theoretical abundance is calculated as log10[sample abundance/theoretical abundance] for each genus. Figures were generated using R.

References

    1. Choo JM, Leong LE, Rogers GB. Sample storage conditions significantly influence faecal microbiome profiles. Sci. Rep. 2015;5:16350. doi: 10.1038/srep16350. - DOI - PMC - PubMed
    1. Song SJ, et al. Preservation methods differ in fecal microbiome stability, affecting suitability for field studies. mSystems. 2016;1:e00021–e116. doi: 10.1128/mSystems.00021-16. - DOI - PMC - PubMed
    1. Costea PI, et al. Towards standards for human fecal sample processing in metagenomic studies. Nat. Biotechnol. 2017;35:1069–1076. doi: 10.1038/nbt.3960. - DOI - PubMed
    1. Gerasimidis K, et al. The effect of DNA extraction methodology on gut microbiota research applications. BMC Res. Notes. 2016;9:365. doi: 10.1186/s13104-016-2171-7. - DOI - PMC - PubMed
    1. Walker AW, et al. 16S rRNA gene-based profiling of the human infant gut microbiota is strongly influenced by sample processing and PCR primer choice. Microbiome. 2015;3:26. doi: 10.1186/s40168-015-0087-4. - DOI - PMC - PubMed

Publication types