. 2021 May 24;11(1):10736.
doi: 10.1038/s41598-021-90271-x.

CD13 is a critical regulator of cell-cell fusion in osteoclastogenesis

Affiliations

CD13 is a critical regulator of cell-cell fusion in osteoclastogenesis

Mallika Ghosh et al. Sci Rep. .

Abstract

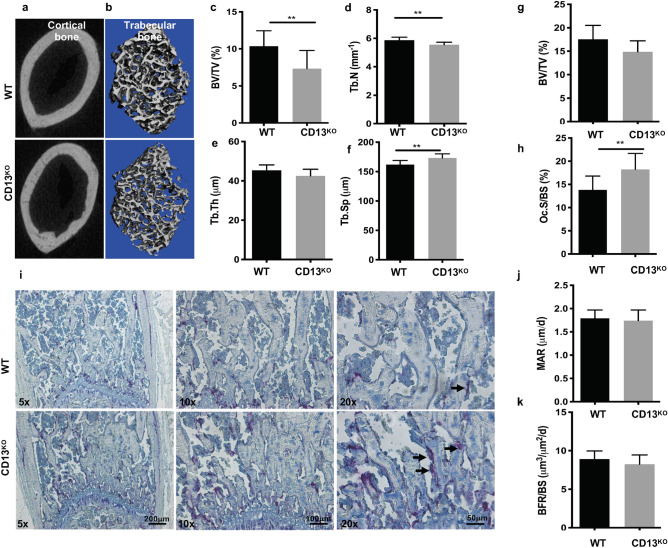
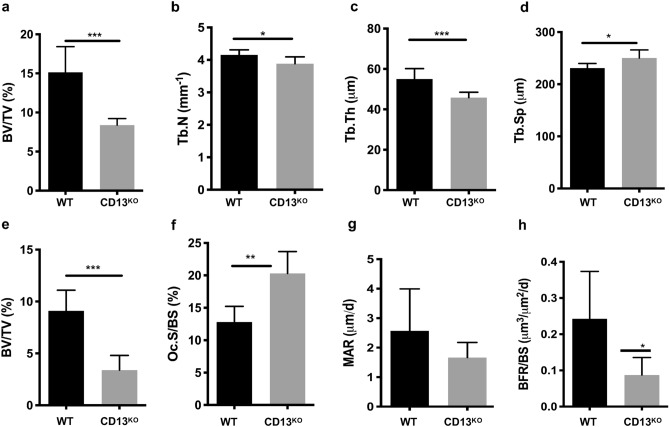
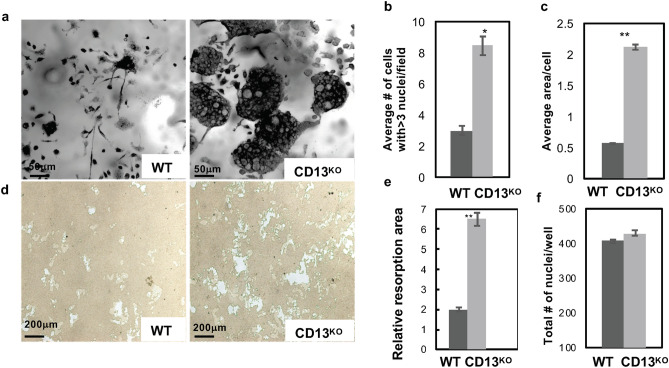
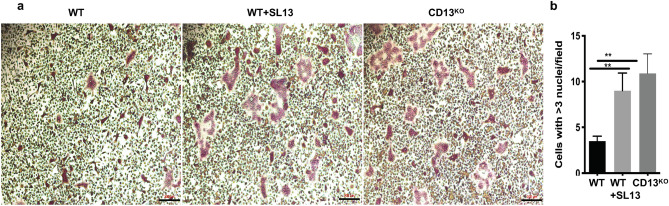
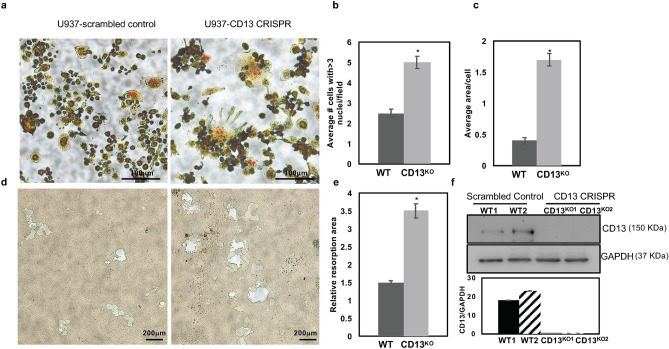
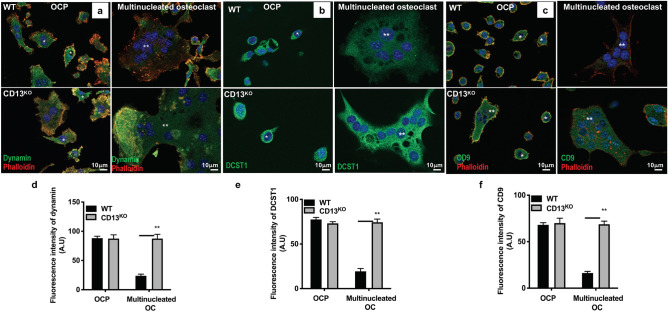
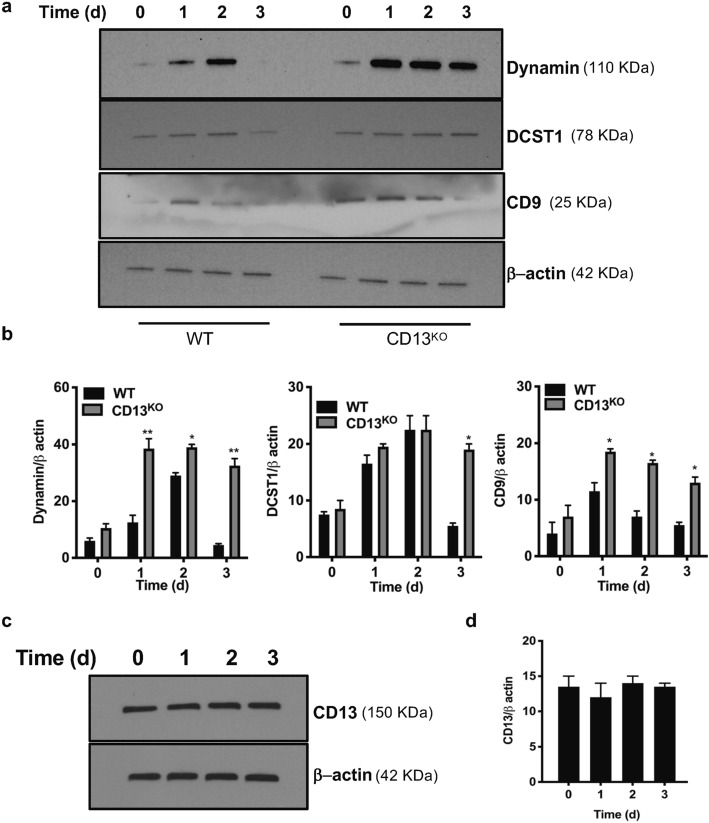
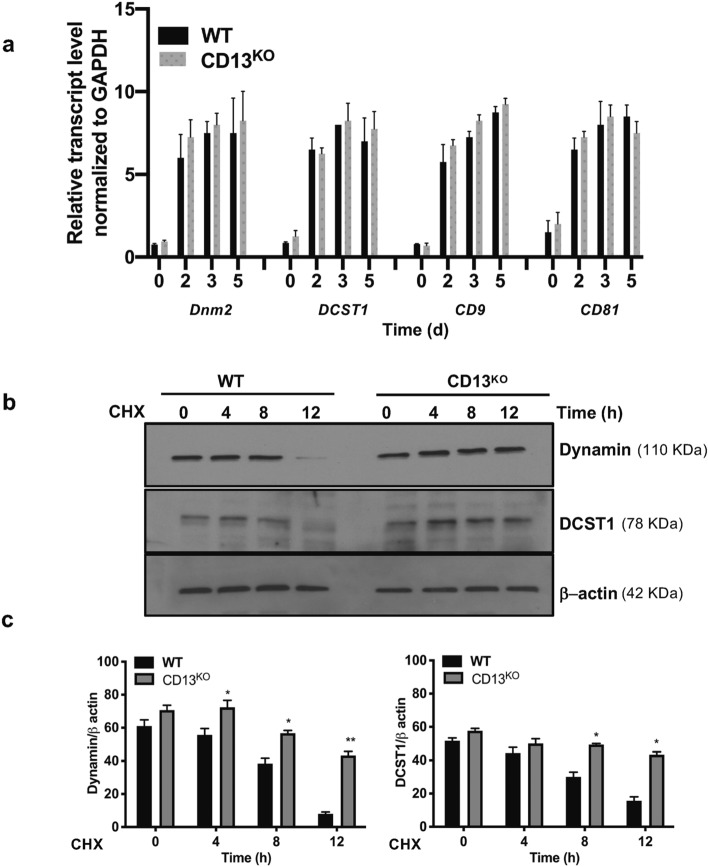
The transmembrane aminopeptidase CD13 is highly expressed in cells of the myeloid lineage, regulates dynamin-dependent receptor endocytosis and recycling and is a necessary component of actin cytoskeletal organization. Here, we show that CD13-deficient mice present a low bone density phenotype with increased numbers of osteoclasts per bone surface, but display a normal distribution of osteoclast progenitor populations in the bone marrow and periphery. In addition, the bone formation and mineral apposition rates are similar between genotypes, indicating a defect in osteoclast-specific function in vivo. Lack of CD13 led to exaggerated in vitro osteoclastogenesis as indicated by significantly enhanced fusion of bone marrow-derived multinucleated osteoclasts in the presence of M-CSF and RANKL, resulting in abnormally large cells containing remarkably high numbers of nuclei. Mechanistically, while expression levels of the fusion-regulatory proteins dynamin and DC-STAMP1 must be downregulated for fusion to proceed, these are aberrantly sustained at high levels even in CD13-deficient mature multi-nucleated osteoclasts. Further, the stability of fusion-promoting proteins is maintained in the absence of CD13, implicating CD13 in protein turnover mechanisms. Together, we conclude that CD13 may regulate cell-cell fusion by controlling the expression and localization of key fusion regulatory proteins that are critical for osteoclast fusion.


Conflict of interest statement

The authors declare no competing interests.

Figures

Figure 1
Figure 1
Loss of CD13 leads to reduced bone volume and increased number of osteoclasts in 8–10 week old CD13-deficient mice. µCT reconstruction of cortical (a) and trabecular bone (b). (cf) Bone morphometry by µCT analysis; (c) BV/TV(%); Bone volume/Tissue volume, (d) Trabecular number, (e) Trabecular Thickness, (f) Trabecular Separation. (gi) Histomorphometric analysis of femurs of WT and CD13KO. Histology of femurs with (g), BV/TV(%), (h) Oc.S/BS; % OCs per bone surface (i), histochemical detection of TRAP+ osteoclasts (purple, indicated by the arrow). (j) Mineral apposition rate (MAR), (k) Bone formation rate (BFR/BS) measured by Osteomeasure software (OsteoMetrics, Decatur, USA) (https://www.osteometrics.com). All samples were scanned, reconstructed, and analyzed in a Scanco µCT40 running Evaluation Program V6.6 (http://www.scanco.ch/en/systems-solutions/software.html). Histochemical analysis of TRAP+ osteoclasts in bone sections were imaged with Zeiss fluorescence inverted microscope and analyzed by using Zeiss Zen 2.0 Pro blue edition software (https://www.zeiss.com/content/dam/Microscopy/Downloads/Pdf/FAQs/zen2-blue-edition_installation-guide.pdf). Scale bars-×5; 200 µm, ×10; 100 µm, ×20; 50 µm. Data represents ± SD. (N = 6; WT, N = 7; CD13KO. **p < 0.01).
Figure 2
Figure 2
CD13 deficiency leads to marked reduction in trabecular bone volume and structure in 18–25 week old aged mice. (ad) Bone morphometry by µCT analysis; (a), BV/TV(%); Bone volume/Tissue volume (b), Trabecular number, (c) Trabecular Thickness (d) Trabecular Separation. (e–h) Histomorphometric analysis (e), BV/TV(%), (f) Oc.S/BS; % OCs per bone surface, (g) Mineral apposition rate (MAR), (h) Bone formation rate (BFR/BS) measured by Osteomeasure software (OsteoMetrics, Decatur, USA) (https://www.osteometrics.com). All samples were scanned, reconstructed, and analyzed in a Scanco µCT40 running Evaluation Program V6.6 (http://www.scanco.ch/en/systems-solutions/software.html). Data represents ± SD. (N = 6; WT and N = 7; CD13KO. ***p < 0.001, **p < 0.01, *p < 0.05).
Figure 3
Figure 3
TRAP + multinucleated OCs are increased in the absence of CD13 in vitro. (a) Primary murine BM- derived osteoclast progenitor cells grown on bovine cortical slices in presence of M-CSF and RANKL led to increased OCs size and number of nuclei/OC in CD13KO cells compared to WT at d5. (b) Average # of cells with > 3 nuclei/field and (c) Average cell area per OCs in CD13KO are significantly larger than the WT cells. (d) Area of resorption is significantly higher in CD13KO than WT OCs grown on osteoplates for d10 by phase contrast imaging. Osteoclasts on cortical slices and cluster of pits formed were imaged using a light microscope (Olympus Scientific), using Olympus cellSens Dimension V0118 software (Olympus Scientific) (https://www.olympus-lifescience.com/en/software/cellsens/) and the area of resorption was quantified by Image J (https://imagej.nih.gov/ij/) (e) and total number of nuclei/well of both genotypes (f) are shown. Scale bars-(a) 50 µm; (d) 200 µm. Data represents ± SEM of three independent experiments. N = 6/genotype, **p < 0.01, *p < 0.05.
Figure 4
Figure 4
Treatment with CD13 blocking Ab leads to increased multinucleated OC formation in WT cells. (a). TRAP staining of WT, WT + SL13 and CD13KO BM-derived osteoclast progenitor cells grown in presence of M-CSF and RANKL after 5d on plastic are shown in “red” color. (b). Quantification of Trap+ OC with > 3 nuclei/cell. TRAP+ osteoclasts were imaged with Zeiss fluorescence inverted microscope and analyzed by using Zeiss Zen 2.0 Pro blue edition software (https://www.zeiss.com/content/dam/Microscopy/Downloads/Pdf/FAQs/zen2-blue-edition_installation-guide.pdf). Scale bar; 200 µm. Data represents ± SEM of three independent experiments. N = 3/genotype, **p < 0.01. Magnification ×5.
Figure 5
Figure 5
Increased Multinucleated OC formation in U937 cells expressing CD13 CRISPR. (a). TRAP staining of U937 expressing scrambled control or CD13 CRISPR grown in presence of PMA for 3 days followed by M-CSF and RANKL for 10 d indicated increased size and number of multinucleated OCs in absence of CD13 compared to WT. (b) Multinucleated OC (**) with greater than 3 nuclei per cell and (c), average area of OC. (d). Phase contrast imaging of area of resorption in U937 cells expressing CD13 CRISPR or scrambled control grown in presence of PMA followed by M-CSF and RANKL for 17 d on osteoplates. TRAP+ osteoclasts were imaged with Zeiss fluorescence inverted microscope and analyzed by using Zeiss Zen 2.0 Pro blue edition software (https://www.zeiss.com/content/dam/Microscopy/Downloads/Pdf/FAQs/zen2-blue-edition_installation-guide.pdf). Area of resorption was imaged using a light microscope (Olympus Scientific), using Olympus cellSens Dimension V0118 software (Olympus Scientific) (https://www.olympus-lifescience.com/en/software/cellsens/) quantified by Image J (https://imagej.nih.gov/ij/) (e). (f). Immunoblot analysis of CD13 expression in U937 cells expressing CD13 CRISPR or scrambled control clones. Blots were imaged by ChemiDoc Imaging system version 3.0.1 (https://www.bio-rad.com/en-us/category/chemidoc-imaging-systems?ID=NINJ0Z15) (Biorad). A cropped image is shown, see Supplementary Fig. S6 for full-length blots and cropped replicates. Scale bar-(a) 100 µm; (d) 200 µm. Data represents ± SEM of three independent experiments. N = 3/genotype, *p < 0.05. Magnification ×10.
Figure 6
Figure 6
Immunofluorescence analysis of persistent expression of fusion-regulatory proteins in CD13-deficient multinucleated OC. Expression of the fusion regulatory proteins dynamin (a,d), DCST1 (b,e) and CD9 (c,f) is maintained in CD13KO multinucleated osteoclasts but not in WT cells (**). High levels of dynamin co-localize with actin and DCST1 in OCPs (*), imaged using Zeiss LSM 880 confocal fluorescence microscope and analyzed by Zeiss Zen 2.0 Pro blue edition software (https://www.zeiss.com/content/dam/Microscopy/Downloads/Pdf/FAQs/zen2-blue-edition_installation-guide.pdf). Scale bar; 10 µm. Data represents average of three independent experiments. N = 3/genotype. Dynamin, CD9, DCST1; green. Phalloidin; red. Magnification ×63 oil.
Figure 7
Figure 7
Immunoblot analysis of sustained expression of fusion-regulatory proteins in CD13-deficient OC over time. Expression of the fusion-promoting proteins dynamin, DC-STAMP (DCST1) and CD9 is aberrantly sustained in CD13KO but not in WT multinucleated osteoclasts (a,b) in presence of M-CSF and RANKL. A cropped image is presented, see Supplementary Fig. S7 for full-length blots and Supplementary Fig. S8 for cropped replicates. (c,d). CD13 expression is unaltered in BM-derived OCs in response to M-CSF and RANKL stimulation over time. Blots were imaged by ChemiDoc Imaging system version 3.0.1 (https://www.bio-rad.com/en-us/category/chemidoc-imaging-systems?ID=NINJ0Z15) (Biorad). A cropped image is presented, see Supplementary Fig. S9 for full-length blots and cropped replicates. Data represents average of two isolates. N = 3/genotype. **p < 0.01, *p < 0.05.
Figure 8
Figure 8
Fusion-regulatory proteins, dynamin and DCST1 are regulated by a CD13-dependent post transcriptional mechanism. (a) Quantitative RT-PCR analysis of fusion regulatory transcripts normalized to GAPDH in flow sorted mouse BM cells stimulated with M-CSF and RANKL over indicated time. Expression of the genes regulating osteoclast fusion -dynamin 2 (DNM2), DCST1, CD9 and CD81 are highly induced upon M-CSF and RANKL over time but was equivalent between genotypes. All data was analyzed using CFX Manager version 3.1 ((https://www.bio-rad.com/en-us/sku/1845000-cfx-manager-software?ID=1845000) (Biorad). Data represents average of two independent experiments. N = 3/genotype. (bc) Dynamin and DCST1 protein stability are enhanced in absence of CD13. Immunoblot analysis of dynamin and DCST1 of WT and CD13KO BM-derived OC treated with cycloheximide (CHX) for indicated time. Blots were imaged by ChemiDoc Imaging system version 3.0.1 (https://www.bio-rad.com/en-us/category/chemidoc-imaging-systems?ID=NINJ0Z15) (Biorad). A cropped image is presented, see Supplementary Fig. S10 for full-length blots and cropped replicates. Data represents average of two isolates. N = 3/genotype. **p < 0.01, *p < 0.05.

Similar articles

Cited by

References

    1. Teitelbaum SL. Bone resorption by osteoclasts. Science. 2000;289:1504–1508. doi: 10.1126/science.289.5484.1504. - DOI - PubMed
    1. Tsukasaki M, Takayanagi H. Osteoimmunology: Evolving concepts in bone-immune interactions in health and disease. Nat. Rev. Immunol. 2019;19:626–642. doi: 10.1038/s41577-019-0178-8. - DOI - PubMed
    1. Madel MB, et al. Immune function and diversity of osteoclasts in normal and pathological conditions. Front. Immunol. 2019;10:1408. doi: 10.3389/fimmu.2019.01408. - DOI - PMC - PubMed
    1. Boudin E, Fijalkowski I, Hendrickx G, Van Hul W. Genetic control of bone mass. Mol. Cell Endocrinol. 2016;432:3–13. doi: 10.1016/j.mce.2015.12.021. - DOI - PubMed
    1. Krakow D. Skeletal dysplasias. Clin. Perinatol. 2015;42:301–319. doi: 10.1016/j.clp.2015.03.003. - DOI - PMC - PubMed

Publication types