. 2021 Sep;101(9):1197-1209.
doi: 10.1038/s41374-021-00610-9. Epub 2021 May 24.

Advanced oxidation protein products downregulate CYP1A2 and CYP3A4 expression and activity via the NF-κB-mediated signaling pathway in vitro and in vivo

Affiliations

Advanced oxidation protein products downregulate CYP1A2 and CYP3A4 expression and activity via the NF-κB-mediated signaling pathway in vitro and in vivo

Tianrong Xun et al. Lab Invest. 2021 Sep.

Abstract

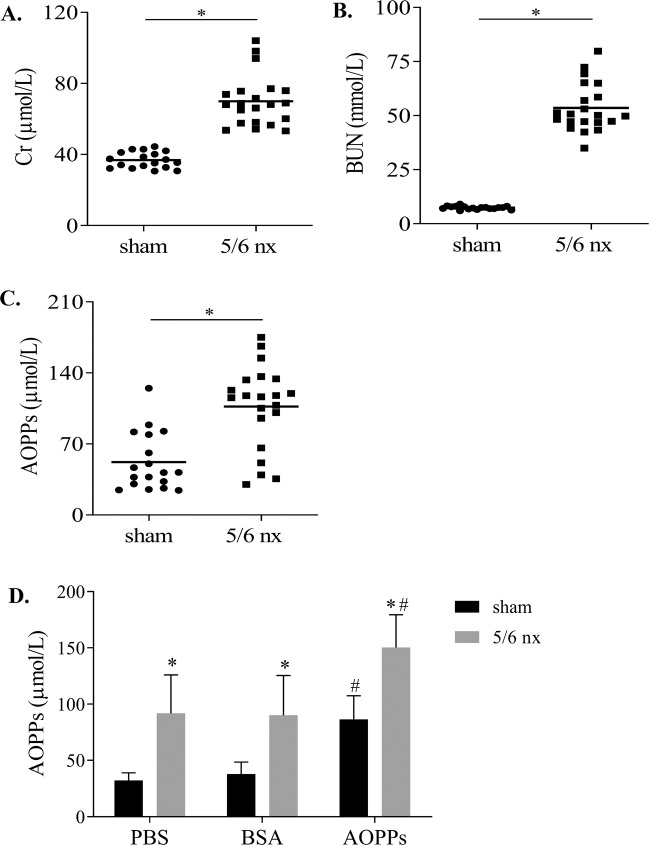
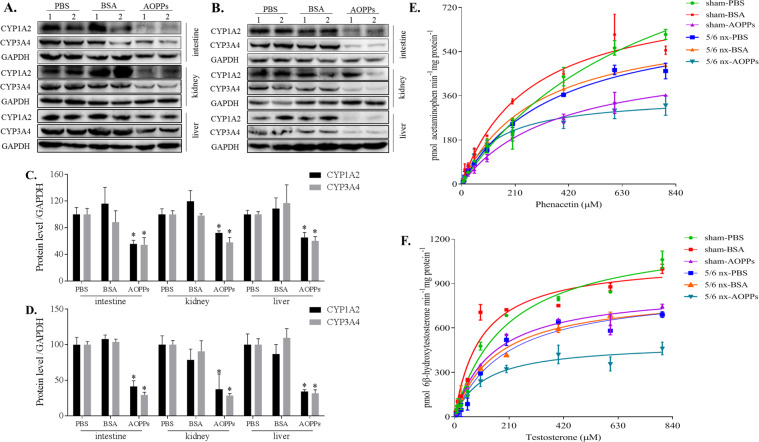
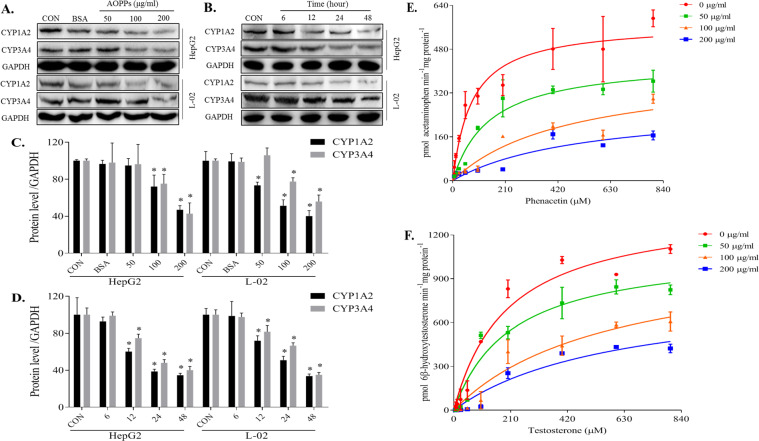
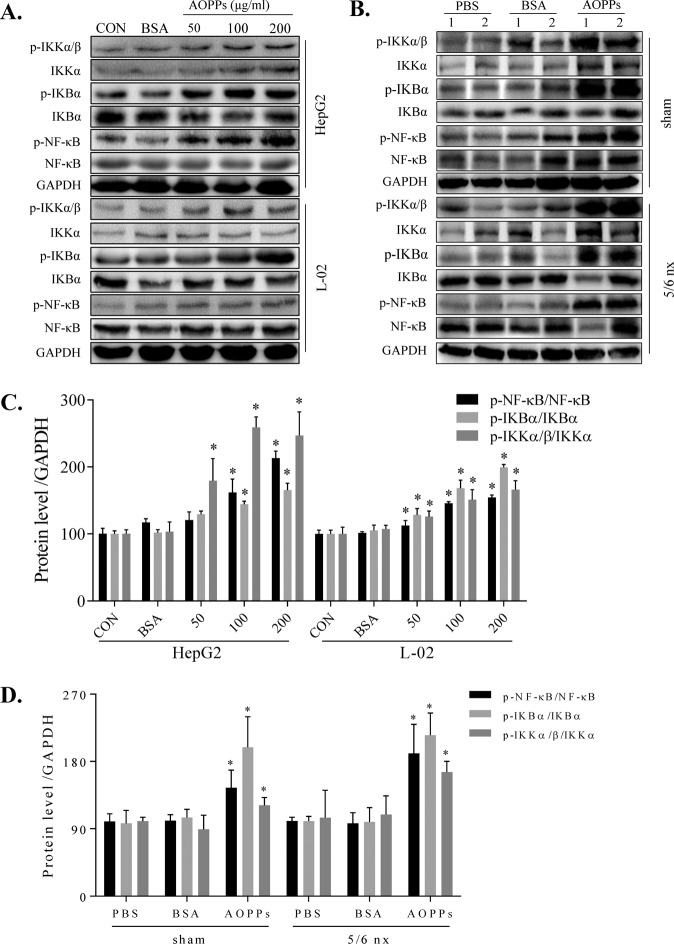
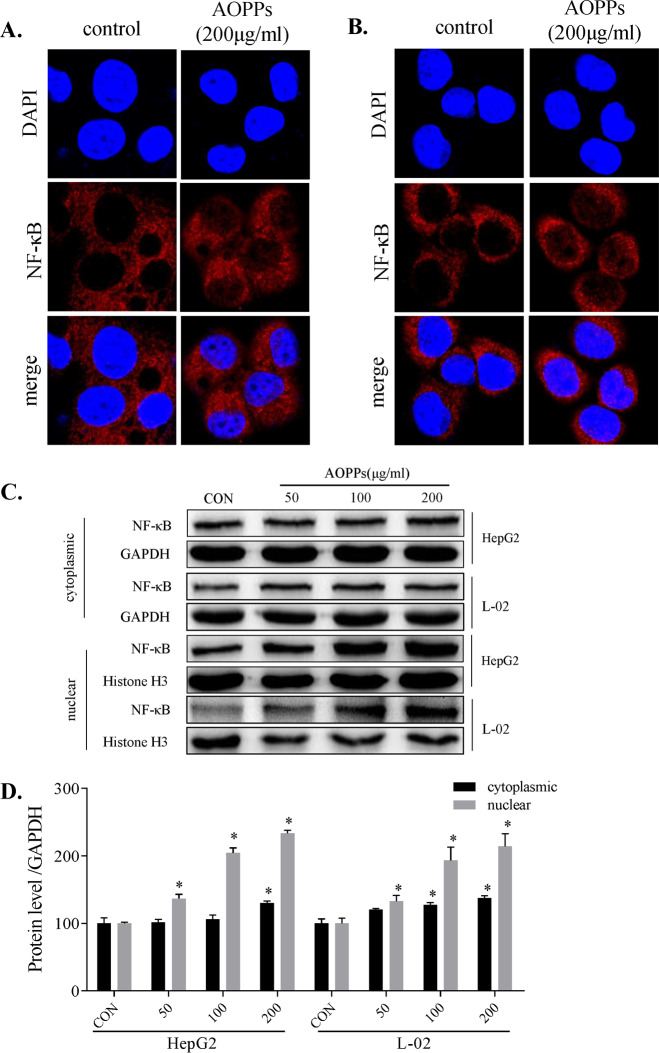
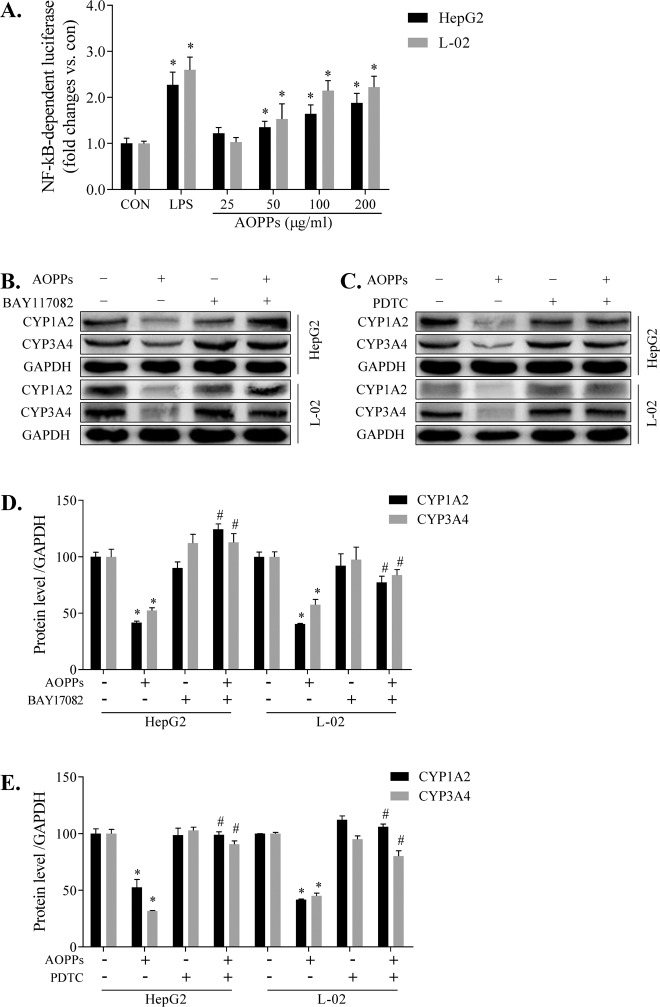
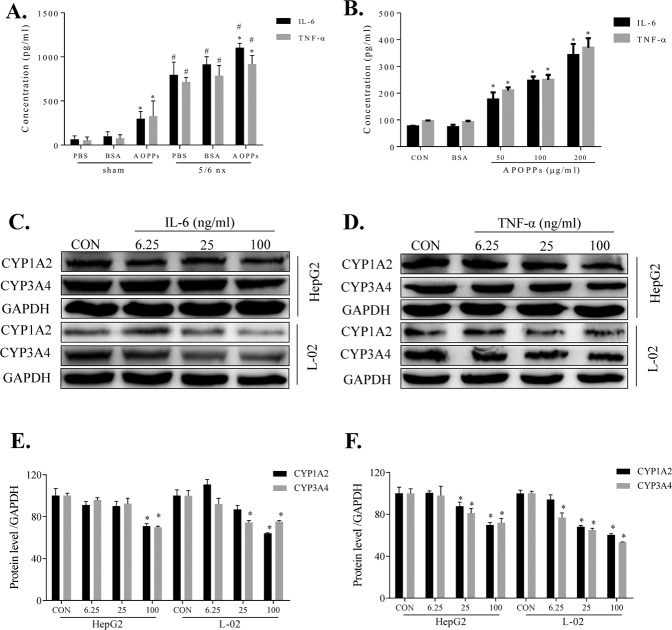
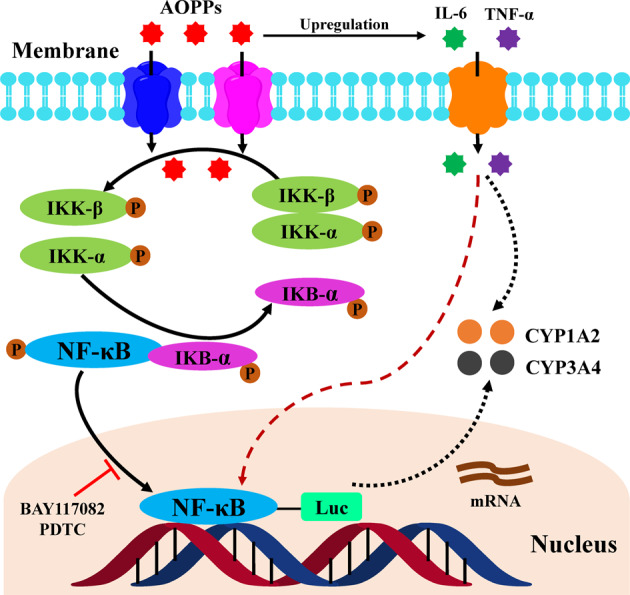
Uremic toxin accumulation is one possible reason for alterations in hepatic drug metabolism in patients with chronic kidney disease (CKD). However, the types of uremic toxins and underlying mechanisms are poorly understood. In this study, we report the role of advanced oxidation protein products (AOPPs), a modified protein uremic toxin, in the downregulation of cytochromes P450 1A2 (CYP1A2) and P450 3A4 (CYP3A4) expression levels and activities. We found that AOPP accumulation in plasma in a rat CKD model was associated with decreased protein levels of CYP1A2 and CYP3A4. CYP1A2 and CYP3A4 metabolites (acetaminophen and 6β-hydroxytestosterone, respectively,) in liver microsomes were also significantly decreased. In human hepatocytes, AOPPs significantly decreased CYP1A2 and CYP3A4 protein levels in a dose- and time-dependent manner and downregulated their activities; however, bovine serum albumin (BSA), a synthetic precursor of AOPPs, had no effect on these parameters. The effect of AOPPs was associated with upregulation of p-IKKα/β, p-IκBα, p-NF-κB, and inflammatory cytokines protein levels and increases in p-IKKα/β/IKKα, p-IκBα/IκBα, and p-NF-κB/NF-κB phosphorylation ratios. Further, NF-kB pathway inhibitors BAY-117082 and PDTC abolished the downregulatory effects of AOPPs. These findings suggest that AOPPs downregulate CYP1A2 and CYP3A4 expression and activities by increasing inflammatory cytokine production and stimulating NF-κB-mediated signaling. Protein uremic toxins, such as AOPPs, may modify the nonrenal clearance of drugs in patients with CKD by influencing metabolic enzymes.


Conflict of interest statement

The authors declare no competing interests.

Figures

Fig. 1
Fig. 1. AOPPs administration increased AOPPs accumulation in the plasma.
Kidney function of 5/6 nx rats was assessed based on Cr (A) and BUN (B), which indicated reduced renal function. Plasma AOPPs concentration was increased in 5/6 nx rats (C). After AOPPs administration, the plasma AOPPs concentration in the sham and 5/6 nx rats increased (D). The results are shown as a scatter plot and each point represents one rat. *p < 0.05 compared with the sham group; #p < 0.05 compared with the PBS group.
Fig. 2
Fig. 2. AOPPs downregulated the protein expression and activities of CYP1A2 and CYP3A4 in vivo.
Total protein was extracted from the intestine, kidney, and liver in the sham (A) and 5/6 nx groups (B), and the protein expression of CYP1A2 and CYP3A4 in a whole-cell lysate was evaluated by western blotting. Proteins expression levels were quantified by ImageJ software (C, D). Each experiment was performed with a different isolate. Michaelis–Menten plots of acetaminophen (E) and 6β-hydroxytestosterone (F) were constructed after incubation of liver microsomes (extracted from the liver tissues in the sham and 5/6 nx groups) with NADPH and various concentrations of phenacetin or testosterone, respectively, which were used to evaluate the activities of CYP1A2 and CYP3A4, respectively. Each data point represents the mean of three replicates and the error bars represent standard error of the mean (n = 3). Data are presented as mean ± SD; *p < 0.05 compared with the PBS group. Data were normalized to GAPDH.
Fig. 3
Fig. 3. AOPPs downregulated the protein expression and activities of CYP1A2 and CYP3A4 in vitro.
HepG2 and L-02 cells were treated with the control medium (CON), BSA, or the indicated AOPPs concentration. AOPPs treatment decreased the protein expression of CYP1A2 and CYP3A4 in a dose- (A) and time-dependent manner (B). Protein expression levels were quantified by ImageJ software (C, D). Each experiment was performed with a different isolate. Microsomes were treated with indicated concentration of AOPPs and the substrate. AOPPs dose-dependently decreased the activities of CYP1A2 (E) and CYP3A4 (F). Each data point represents the mean of three replicates and the error bars represent standard error of the mean (n = 3). Data are presented as mean ± SD; *p < 0.05 compared with the CON group. Data were normalized to GAPDH.
Fig. 4
Fig. 4. AOPPs activated the IKK/IκB/NF-κB pathway in vitro and in vivo.
AOPPs increased the expression of p-NF-κB, p-IKBα, and p-IKKα/β in the total protein fraction of HepG2 and L-02 cells (A). AOPPs increased the expression of p-NF-κB, p-IKBα, and p-IKKα/β in the liver tissues of the sham and 5/6 nx groups (B). Protein expression levels were quantified by ImageJ software (C, D). Each experiment was performed with a different isolate. Data are presented as mean ± SD; *p < 0.05 compared with the CON or PBS groups. Data were normalized to GAPDH.
Fig. 5
Fig. 5. AOPPs-induced nuclear translocation of NF-κB.
AOPPs increased nuclear translocation of NF-κB detected in the nuclear protein by laser confocal microscopy (400×) in HepG2 (A) and L-02 cells (B). Cytoplasmic and nuclear protein expression levels of NF-κB were detected by western blotting (C). Protein expression levels were quantified by ImageJ software (D). Each experiment was performed with a different isolate. Data are presented as mean ± SD; *p < 0.05 compared with the CON group. Data were normalized to GAPDH.
Fig. 6
Fig. 6. AOPPs downregulated CYP1A2 and CYP3A4 expression via the NF-κB pathway.
NF-κB-dependent firefly luciferase reporter gene was transfected into HepG2 or L-02 cells, and the reporter gene expression (A). HepG2 or L-02 cells were treated with AOPPs (200 µg/ml) for 48 h and cocultured with BAY-117082 (B) and PDTC (C) to restore the downregulated expression levels of CYP1A2 and CYP3A4. Protein expression levels of CYP1A2 and CYP3A4 were quantified by ImageJ software (D, E). Each experiment was performed with a different isolate. Data are presented as mean ± SD; *p < 0.05 compared with the CON group; #p < 0.05 compared with the group without BAY-117082 or PDTC. Data were normalized to GAPDH.
Fig. 7
Fig. 7. AOPPs downregulated CYP1A2 and CYP3A4 expression via the inflammatory cytokine pathway.
AOPPs increased the plasma concentrations of IL-6 and TNF-α in the sham and 5/6 nx groups (A). AOPPs increased the IL-6 and TNF-α concentrations in rat macrophages (B). HepG2 and L-02 cells treated with various concentrations of IL-6 (C) or TNF-α (D) for 48 h exhibited dose-dependent decreases in the protein expression levels of CYP1A2 and CYP3A4, as evaluated by western blotting. Protein expression levels of CYP1A2 and CYP3A4 levels were quantified by ImageJ software (E, F). Each experiment was performed with a different isolate. Data are presented as mean ± SD; *p < 0.05 compared with the CON group, #p < 0.05 compared with the sham group. Data were normalized to GAPDH.
Fig. 8
Fig. 8. Possible mechanism underlying the AOPPs-induced CYP1A2 and CYP3A4 downregulation.
This study demonstrates that AOPPs significantly decrease the CYP1A2 and CYP3A4 expression and activities via direct activation of the NF-κB pathway and induction of nuclear translocation of NF-κB to inhibit the transcription and translation of CYP1A2 and CYP3A4. As inflammatory cytokines, IL-6 and/or TNF-α may mediate this process.

References

    1. Tonelli M, Wiebe N, Manns BJ, Klarenbach SW, James MT, Ravani P, et al. Comparison of the complexity of patients seen by different medical subspecialists in a Universal Health Care System. JAMA Netw Open. 2018. 10.1001/jamanetworkopen.2018.4852. - PMC - PubMed
    1. Lalande L, Charpiat B, Leboucher G, Tod M. Consequences of renal failure on non-renal clearance of drugs. Clin Pharmacokinet. 2014;53:521–32. doi: 10.1007/s40262-014-0146-1. - DOI - PubMed
    1. Ladda MA, Goralski KB. The effects of CKD on cytochrome P450-mediated drug metabolism. Adv Chronic Kidney Dis. 2016;23:67–75. doi: 10.1053/j.ackd.2015.10.002. - DOI - PubMed
    1. Leblond F, Guévin C, Demers C, Pellerin I, Gascon-Barré M, Pichette V. Downregulation of hepatic cytochrome P450 in chronic renal failure. J Am Soc Nephrol. 2001;12:326–32. doi: 10.1681/ASN.V122326. - DOI - PubMed
    1. Dowling TC, Briglia AE, Fink JC, Hanes DS, Light PD, Stackiewicz L, et al. Characterization of hepatic cytochrome p4503A activity in patients with end-stage renal disease. Clin Pharmacol Ther. 2003;73:427–34. doi: 10.1016/S0009-9236(03)00056-0. - DOI - PubMed

Publication types