. 2021 Dec;5(12):1457-1471.
doi: 10.1038/s41551-021-00716-x. Epub 2021 May 24.

Shear-stress sensing by PIEZO1 regulates tendon stiffness in rodents and influences jumping performance in humans

Affiliations

Shear-stress sensing by PIEZO1 regulates tendon stiffness in rodents and influences jumping performance in humans

Fabian S Passini et al. Nat Biomed Eng. 2021 Dec.

Abstract

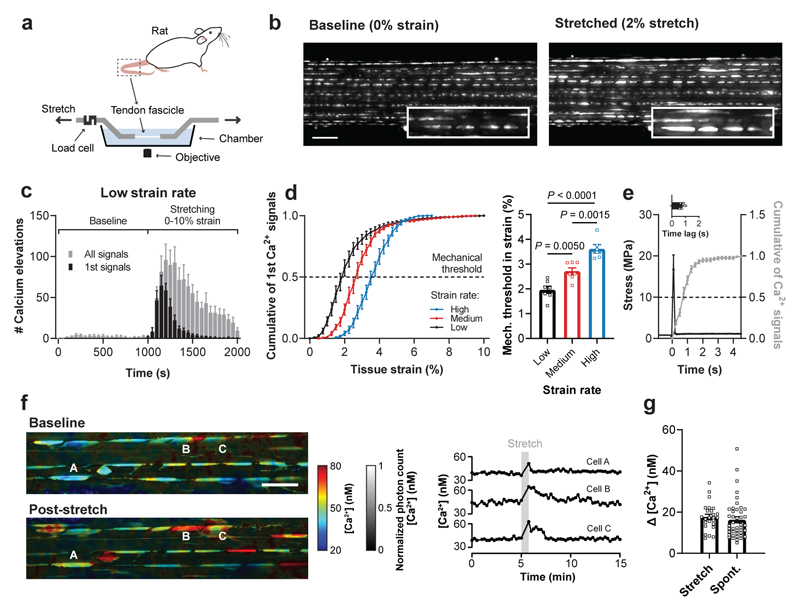
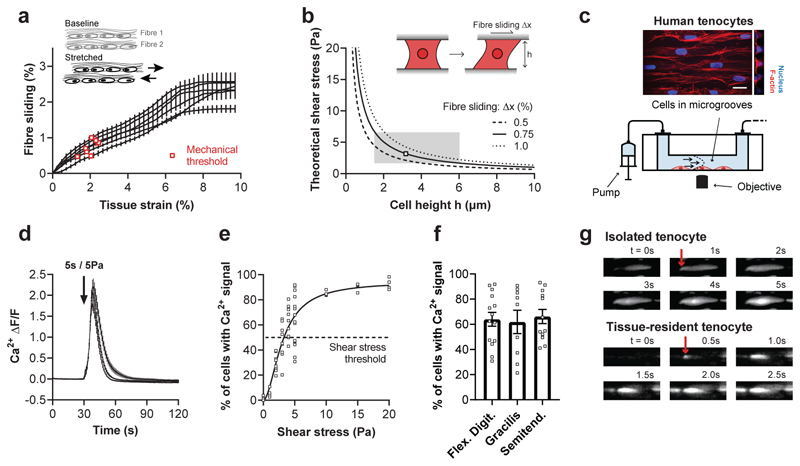
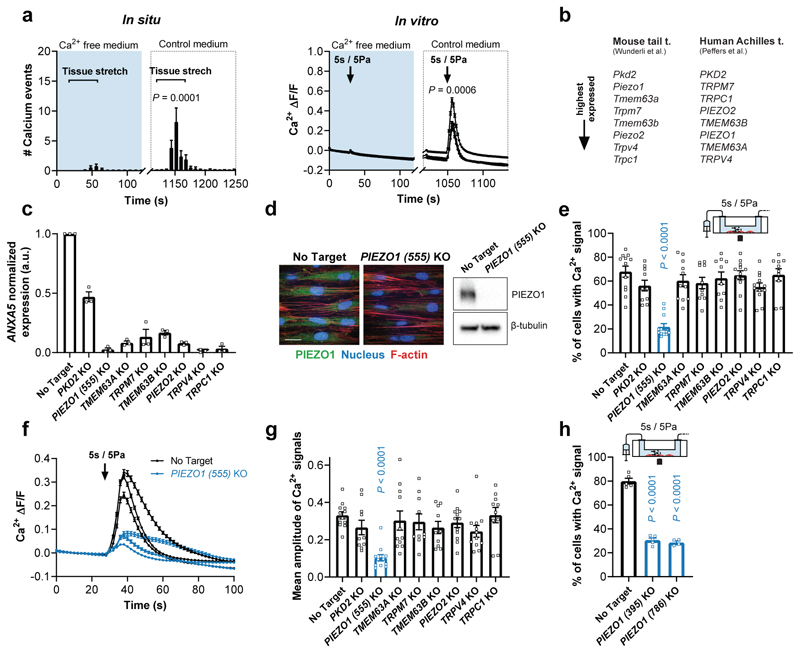
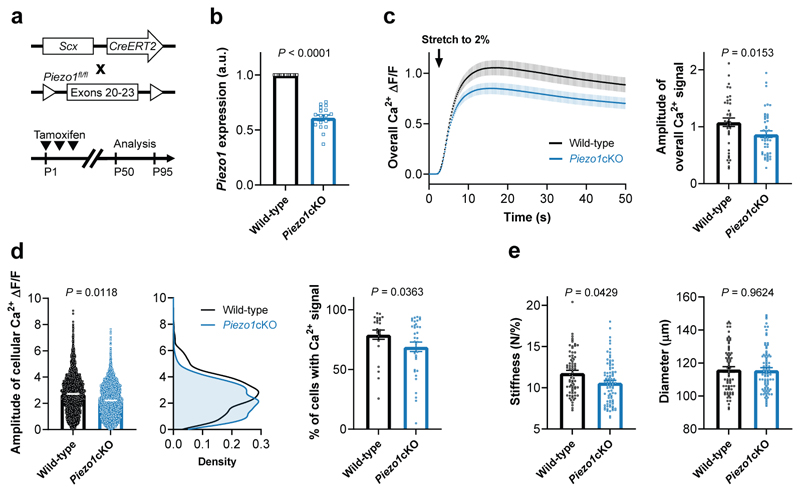
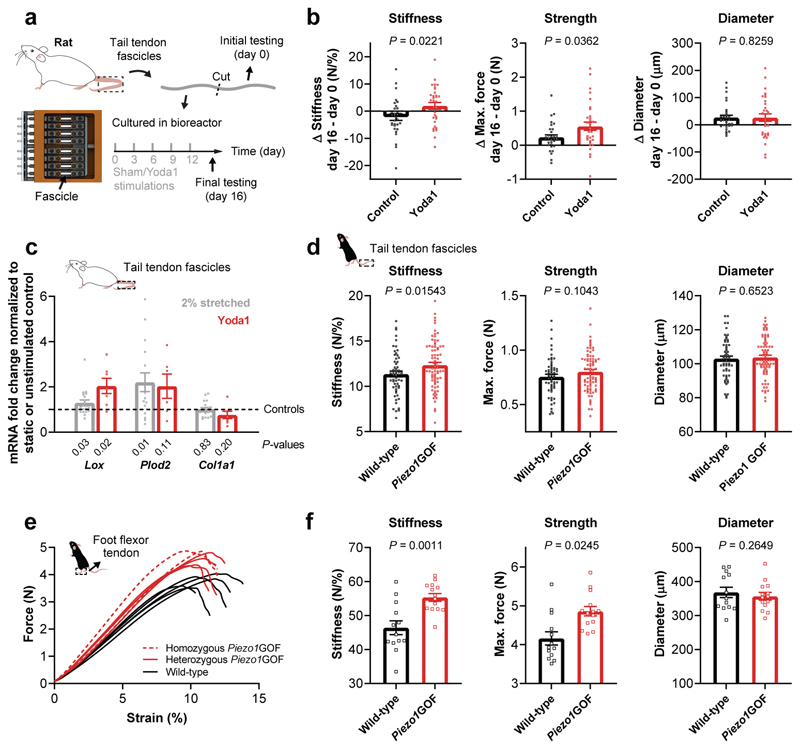
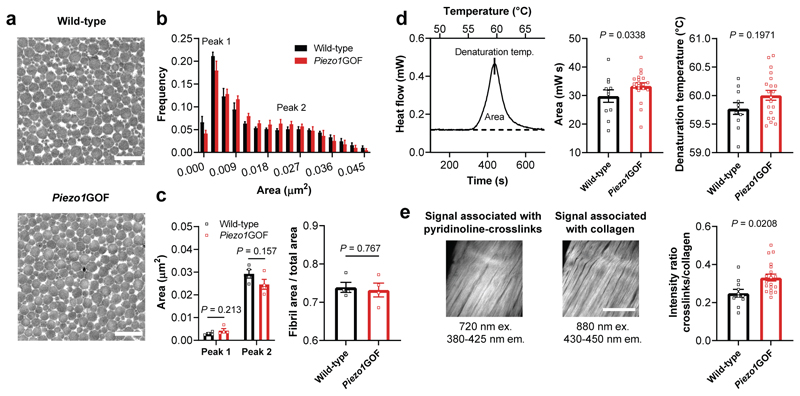
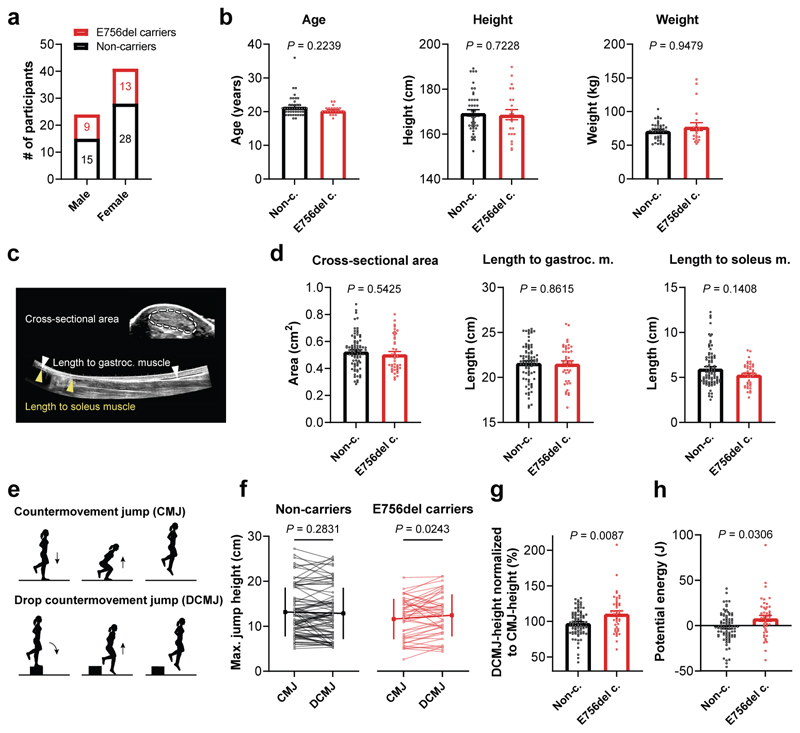
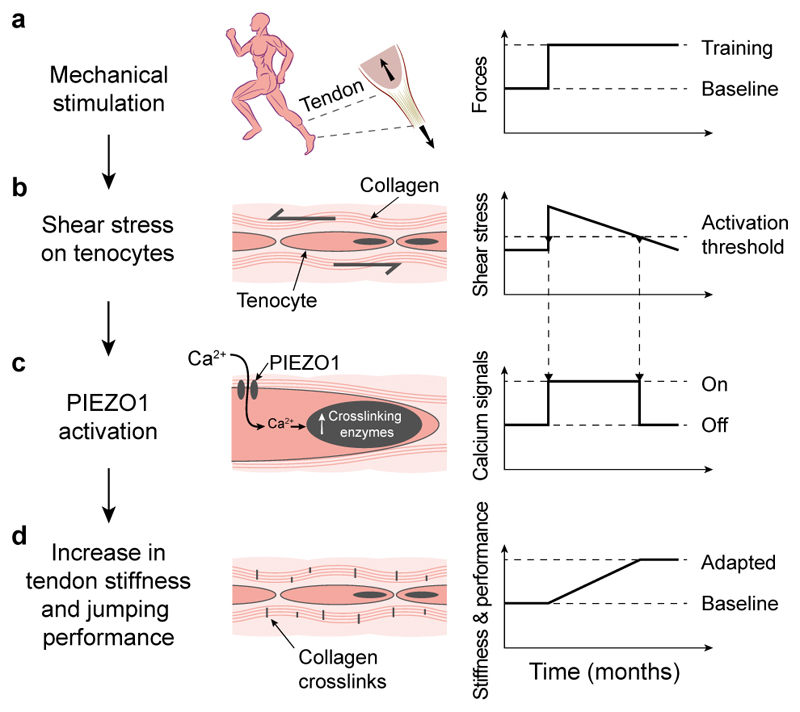
Athletic performance relies on tendons, which enable movement by transferring forces from muscles to the skeleton. Yet, how load-bearing structures in tendons sense and adapt to physical demands is not understood. Here, by performing calcium (Ca2+) imaging in mechanically loaded tendon explants from rats and in primary tendon cells from rats and humans, we show that tenocytes detect mechanical forces through the mechanosensitive ion channel PIEZO1, which senses shear stresses induced by collagen-fibre sliding. Through tenocyte-targeted loss-of-function and gain-of-function experiments in rodents, we show that reduced PIEZO1 activity decreased tendon stiffness and that elevated PIEZO1 mechanosignalling increased tendon stiffness and strength, seemingly through upregulated collagen cross-linking. We also show that humans carrying the PIEZO1 E756del gain-of-function mutation display a 13.2% average increase in normalized jumping height, presumably due to a higher rate of force generation or to the release of a larger amount of stored elastic energy. Further understanding of the PIEZO1-mediated mechanoregulation of tendon stiffness should aid research on musculoskeletal medicine and on sports performance.


Conflict of interest statement

Competing interests

The authors declare no competing interests.

Figures

Fig. 1
Fig. 1. Mechanically-induced Ca2+ elevations in tissue-resident tenocytes.
a, Schematic of the setup used for simultaneous stretching and Ca2+ imaging of tissue-resident tenocytes labeled with Fluo-4. b, Ca2+ images of a rat tail tendon fascicle at baseline and during the stretching protocol at low strain rate (0.01% strain/s) showing stretch-induced Ca2+ signals (scale bar, 100 μm). c, Quantification of the Ca2+ signals at baseline and during the stretching protocol at low strain rate (n=7 fascicles). d, The cumulative sum of the first Ca2+ signals for three different strain rates (low 0.01% strain/s, medium 0.1% strain/s and high 1.0% strain/s) showing a right-shift with increasing strain rate. The mechanical threshold was defined at 50% of the cumulative curve and corresponds to the tissue strain at which 50% of the cells showed a first Ca2+ signal. Mechanical thresholds were found at (from low to high strain rate): 1.96±0.35% strain (n=7 fascicles), 2.72±0.33% strain (n=7 fascicles) and 3.62±0.38% strain (n=6 fascicles), one-way ANOVA with multiple comparisons (Tukey’s test). e, Quantification of the time lag between mechanical stimulus and Ca2+ elevation (n=5 fascicles). f, FLIM acquired images of OGB-1-labelled tenocytes in a rat tail tendon fascicle showing [Ca2+] landscapes at baseline and post-stretch (scale bar, 50 μm). Corresponding time traces of [Ca2+] for three cells (indicated with letters in the images). g, Quantification of the increases in [Ca2+], represented as Δ [Ca2+], between baseline and active state for stretch-induced Ca2+ signals (n=25 cells from 6 fascicles) and spontaneous Ca2+ signals (n=43 cells from 13 fascicles). Replicates are biological. Data are means±SEM.
Fig. 2
Fig. 2. Shear stress as a key stimulus driving Ca2+ signals in isolated tenocytes.
a, Fibre sliding quantified from the images of rat fascicles stretched at low strain rate (Fig. 1c and d) by measuring the relative displacements between adjacent fibres (means±SEM for each of the n=7 fascicles). Corresponding mechanical thresholds are indicated with red squares and were defined as the tissue strain at which 50% of the cells showed a first Ca2+ signal (see Fig. 1d). b, Theoretical shear stresses that act on tenocytes due to fibre sliding. Shear stresses were calculated for three different levels of fibre sliding (0.5, 0.75 and 1.0%). The predicted mechanosensitive zone of tenocytes is shown as a grey box. c, Schematic of the flow chamber used for Ca2+ imaging of isolated tenocytes during shear stress stimulations. Flow chamber included aligned micro-channels to promote a native cell morphology (scale bar, 20 μm). d, Shear stress (5 Pa for 5 s, onset indicated by arrow) induces Ca2+ signals in human tenocytes (n≥12 chambers, cells from flexor digitorum tendons, 3 human donors). e, Tenocytes display an increased response rate with increasing shear stress (for each condition n=4 chambers, cells from flexor digitorum tendons, 2-3 human donors). A nonlinear fit with Hill slope (y=94.42*xh3.08h+xh; h = 1.854 ; R2 = 0.862) was performed to identify the shear stress threshold, that was defined at 50% of the fit and corresponds to the shear stress at which 50% of the cells show a Ca2+ signal. f, No difference in the Ca2+ response to shear stress (5 Pa for 5 s) in tenocytes from different anatomical locations (for each condition n≥9 chambers, cells from 2-3 human donors), one-way ANOVA with multiple comparisons (Tukey’s test). g, Representative images of Ca2+ signals originating at the cell periphery (indicated by arrow) observed in hundreds of cells, both in vitro (shear stress, cell from a human flexor digitorum tendon) and in situ (tissue stretch, cell in a rat tail tendon fascicle). Replicates are biological. Data are means±SEM.
Fig. 3
Fig. 3. PIEZO1-mediated shear stress response in human tenocytes.
a, Mechanically-induced Ca2+ signals are nearly absent in Ca2+-free medium (containing 2 mM EGTA and 2 mM MgCl2 instead of CaCl2) but are restored in control medium, both in situ (one cycle stretch to 2.7% strain at 0.1% strain/s, n=7 fascicles from rat tails) and in vitro (shear stress stimulation, n=12 chambers, cells from semitendinosus tendons of 3 human donors), paired Student’s t-test. b, Highest expressed candidate genes associated with mechanosensitive ion channel characteristics selected from RNA sequencing experiments with mouse tail tendons and human Achilles tendons. c, CRISPR/Cas9-mediated knockout efficiency of candidate genes. Normalization to gene expression in no target control cells using 2–ddCT method (cells from n=3 human donors), significant reduction (P < 0.0001) for all candidates compared to no target control, one-way ANOVA with multiple comparisons (Dunnett’s test). d, Immunofluorescence images and Western blot analysis (full scan in Supplementary Fig. 5) showing efficient PIEZO1 knockout in human PIEZO1 knockout tenocytes compared to no target control tenocytes (scale bar, 20 μm). e-g, Ca2+ response of the candidate knockouts to a shear stress stimulus of 5 Pa for 5 s. PIEZO1 depleted cells show a reduced % of responsive cells and a reduced amplitude of the Ca2+ signals (averaged over all single segmented cells). For each candidate n≥10 chambers were tested with cells from 3 human donors (semitendinosus tendons), one-way ANOVA with multiple comparisons (Dunnett’s test). h, Two additional PIEZO1 knockouts generated with different CRISPR-guide-RNAs confirm the reduced shear stress response (n≥4 chambers, cells from a human semitendinosus tendon), one-way ANOVA with multiple comparisons (Dunnett’s test). Replicates are biological. Data are means±SEM.
Fig. 4
Fig. 4. Decreased stretch-induced Ca2+ response and stiffness in fascicles from tenocyte-targeted Piezo1 knockout mice.
a, Generation of Scx-creERT2;Piezo1fl/fl mice expressing CreERT2 under the Scleraxis promoter. Tamoxifen injections were performed at P1-P3 and the analysis was carried out between P50 and P95. b, Reduced Piezo1 expression in tail tendon fascicles from Piezo1cKO mice (Scx-creERT2;Piezo1fl/fl, n=17 mice) compared to their wild-type littermates (Piezo1fl/fl, n=15 mice). Anxa5 was used as reference gene. Unpaired Student’s t-test. c, The overall stretch-induced Ca2+ response is reduced in fascicles from 7-11-week-old Piezo1cKO mice (n=9 mice) compared to wild-type littermate controls (n=6 mice), 6 fascicles were tested per mouse. d, Corresponding single cell analysis shows that tenocytes in fascicles from Piezo1cKO mice exhibit a reduced amplitude of the stretch-induced Ca2+ signals and a reduced % of responsive cells. e, Ramp-to-failure tests show a decreased stiffness of fascicles from 10-13-week-old Piezo1cKO mice (n=14 mice) compared to wild-type littermate controls (n=12 mice, 6 fascicles tested per mouse). Unless indicated otherwise, statistics was performed with linear mixed effects models (mouse ID as random effect and litter as fixed effect). Replicates are biological. Data are means±SEM.
Fig. 5
Fig. 5. Stiffness and strength regulation of murine tendons by PIEZO1.
a, Schematic of our in vitro experiment with tendon explants subjected to recurrent sham (control) or 5 μM Yoda1 stimulations. To investigate the changes over time, each tendon fascicle was cut in two, the first half was tested at day 0 and the second half after the stimulation paradigm at day 16. b, Comparison of the ramp-to-failure tests between day 0 and day 16 shows higher Δ stiffness (control -2.22 N/%, Yoda1 +1.94 N/%) and Δ strength (control +0.23 N, Yoda1 +0.55 N) after Yoda1-treatment, with no difference in Δ diameter (n=32 fascicles, 4 rats), Mann-Whitney test. c, mRNA expression of genes encoding collagen crosslinking enzymes (Lox and Plod2) and type I collagen (Col1a1) in tendon explants 48 h after four-times stretching to 2% (normalized to static control using the 2–ddCT method, n=20, 7 rats) or 5 μM Yoda1 stimulation (normalized to sham control using the 2–ddCT method, n=8, 4 rats), one sample t-test. d, Positional tendons: ramp-to-failure tests with tail tendon fascicles show an increased stiffness but unaffected diameter in Piezo1GOF mice (n=13 mice, 10 heterozygous and 3 homozygous, 6 fascicles tested per mouse) compared to wild-type littermate controls (n=9 mice, 6 fascicles tested per mouse) from 6 litters in total. e, Load-bearing tendons: ramp-to-failure curves of plantaris tendons from littermates demonstrate a tendon phenotype in Piezo1GOF mice with (f) increased stiffness and strength but unaffected diameter. n=8 Piezo1GOF mice (6 heterozygous and 2 homozygous) and n=7 wild-type littermate controls were analysed from 3 litters in total. Unless indicated otherwise, statistics was performed with linear mixed effects models (mouse ID as random effect and litter as fixed effect, Bonferroni-Holm correction). Replicates are biological. Data are means±SEM.
Fig. 6
Fig. 6. Unchanged collagen fibrils but increased crosslink-associated thermal stability and autofluorescence in load-bearing tendons from Piezo1GOF mice.
a, Transmission electron microscopy (TEM) images showing the collagen fibrils in plantaris tendons from a Piezo1GOF mouse and a wild-type littermate (scale bar, 500 nm). b, Quantification of the collagen fibril area from TEM images of plantaris tendons shows a similar frequency distribution between Piezo1GOF mice and wild-type littermates. An average of around 23’600 collagen fibrils were analyzed per tendon (one tendon per mouse, n=4 mice per genotype). c, No differences were observed in the two local peaks determined with a fit of the frequency distribution (n=4 mice per genotype, multiple t-tests). Also the tissue compactness, measured as the ratio between fibril area and total area, was similar between plantaris tendons from Piezo1GOF mice and wild-type littermates (n=4 mice per genotype, unpaired Student’s t-test). d, Differential scanning calorimetry measurements with Achilles tendons demonstrate an increased transition enthalpy, corresponding to the area between the denaturation curve and baseline (shown as a dashed line), in Piezo1GOF mice (n=10 mice, 8 heterozygous and 2 homozygous) compared to wild-type littermate controls (n=6 mice). e, Two-photon imaging of Achilles tendons was used to assess the autofluorescence associated with the collagen crosslinks pyridinoline, and the second harmonic generation signal associated with the collagen matrix, n=11 Piezo1GOF mice (8 heterozygous and 3 homozygous) and n=7 wild-type littermate mice, (scale bar, 100 μm). Unless indicated otherwise, statistics was performed with linear mixed effects models (mouse ID as random effect and litter as fixed effect). Replicates are biological. Data are means±SEM.
Fig. 7
Fig. 7. Human jumping performance influenced by PIEZO1GOF E756 mutation with no effect on Achilles tendon morphology.
a, Genotyping identified n=22 E756del carriers and n=43 non-carriers in the 65 African American participants with (b) no differences in age, height and weight between the two groups, Mann-Whitney test. c, Ultrasound imaging was used to assess the morphology (length and cross-sectional area) of the Achilles tendon. d, The cross-sectional area, length to the gastrocnemius muscle and to the soleus muscle of the Achilles tendon were unaffected by the E756del mutation. e, Schematic of single leg CMJ and single leg DCMJ used to assess the jumping performance. CMJ and DCMJ differ solely by the initial drop (from 20 cm) in DCMJ, which leads to greater Achilles tendon loading. For each leg and jump the average of 3 trials was used for analysis. f, The average jumping heights between non-carriers and E756del carries were similar (CMJ: 13.1±5.4 vs 11.6±4.4 cm (P = 0.25) and DCMJ: 12.8±5.7 vs 12.4±4.6 cm (P = 0.77), mean±SD represented on the sides). However, intra-subject analysis within non-carriers revealed a similar performance in both jumps (P = 0.28), whereas, within E756del carriers the performance was significantly better in DCMJ compared to CMJ (P = 0.02, paired analysis). Performances corresponding to the same leg are connected with a line. g, Normalization of the DCMJ-height to the CMJ-height, to isolate the effect of greater tendon loading, shows a significant increase in normalized jumping height in E756del carriers compared to non-carriers. h, Conversion of jump height difference (between DCMJ and CMJ) into potential energy demonstrates that E756del carriers more effectively transformed the drop energy into jump height. Statistics was performed with linear mixed effects models unless indicated otherwise (subject ID as random effect and leg as fixed effect), both legs of n=22 E756del carriers and n=43 non-carriers were analysed. Replicates are biological. Unless indicated otherwise, data are means±SEM.
Fig. 8
Fig. 8. Proposed mechanism of tendon mechanotransduction that adapts the tissue and influences physical performance.
a, Mechanical loading of tendons during, for instance, training (b) causes shear stress on tissue-resident tenocytes. c, Such stimulus is sensed by PIEZO1 – a mechanosensitive ion channel – that triggers intracellular Ca2+ signals and leads to an upregulation of collagen crosslinking enzymes. d, As a consequence, the stiffness of tendons increases, affecting the physical performance.

Comment in

References

    1. Magnusson SP, Langberg H, Kjaer M. The pathogenesis of tendinopathy: balancing the response to loading. Nat Rev Rheumatol. 2010;6:262–268. - PubMed
    1. Dickinson MH, et al. How animals move: an integrative view. Science. 2000;288:100–106. - PubMed
    1. Roberts TJ, Marsh RL, Weyand PG, Taylor CR. Muscular force in running turkeys: the economy of minimizing work. Science. 1997;275:1113–1115. - PubMed
    1. Wilson AM, Watson JC, Lichtwark GA. Biomechanics: A catapult action for rapid limb protraction. Nature. 2003;421:35–36. - PubMed
    1. Arampatzis A, Karamanidis K, Albracht K. Adaptational responses of the human Achilles tendon by modulation of the applied cyclic strain magnitude. J Exp Biol. 2007;210:2743–2753. - PubMed

Publication types