. 2021 Jul;13(7):651-659.
doi: 10.1038/s41557-021-00707-0. Epub 2021 May 24.

SARS-CoV-2 simulations go exascale to predict dramatic spike opening and cryptic pockets across the proteome

Affiliations

SARS-CoV-2 simulations go exascale to predict dramatic spike opening and cryptic pockets across the proteome

Maxwell I Zimmerman et al. Nat Chem. 2021 Jul.

Abstract

SARS-CoV-2 has intricate mechanisms for initiating infection, immune evasion/suppression and replication that depend on the structure and dynamics of its constituent proteins. Many protein structures have been solved, but far less is known about their relevant conformational changes. To address this challenge, over a million citizen scientists banded together through the Folding@home distributed computing project to create the first exascale computer and simulate 0.1 seconds of the viral proteome. Our adaptive sampling simulations predict dramatic opening of the apo spike complex, far beyond that seen experimentally, explaining and predicting the existence of 'cryptic' epitopes. Different spike variants modulate the probabilities of open versus closed structures, balancing receptor binding and immune evasion. We also discover dramatic conformational changes across the proteome, which reveal over 50 'cryptic' pockets that expand targeting options for the design of antivirals. All data and models are freely available online, providing a quantitative structural atlas.


Figures

Figure 1:
Figure 1:. Summary of Folding@home’s computational power.
A) The growth of Folding@home (F@H) in response to COVID-19. The cumulative number of users is shown in blue and COVID-19 cases are shown in orange. B) Global distribution of Folding@home users. Each yellow dot represents a unique IP address contributing to Folding@home. C) The processing speed of Folding@home and the next 10 fastest supercomputers, in exaFLOPS.
Figure 2:
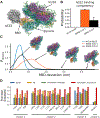
Figure 2:. Structural characterization of Spike opening and conformational masking for three Spike homologues.
A) An example structure of SARS-CoV-2 Spike protein from our simulations that is fully compatible with receptor binding, as shown by superimposing ACE2 (gray). The three chains of Spike are illustrated with a cartoon and transparent surface representation (orange, teal, and purple), and glycans are shown as sticks (green). B) Three Spike homologues have very different probabilities of adopting ACE2 binding competent conformations, likely modulating their affinities for both ACE2 and antibodies that engage the ACE2-binding interface. HCoV-NL63, SARS-CoV-1, and SARS-CoV-2 are shown as light-blue, orange, and black, respectively. C) The probability distribution of Spike opening for each homologue. Opening is quantified in terms of how far the center of mass of an RBD deviates from its position in the closed (or down) state. The cryptic epitope for the antibody CR3022 (red) is only accessible to antibody binding in extremely open conformations. D) Our simulations capture exposure of cryptic epitopes that are buried in the up and down cryoEM structures. The fraction of residues within different epitopes that are exposed to a 0.5 nm radius probe for the down structure (blue), up structure (yellow), the ensemble average from our simulations (green), and the maximum value we observe in our simulations (red). Epitopes are determined as the residues that contact the specified antibody, and are clustered by their binding location on the RBD.
Figure 3:
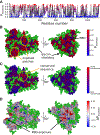
Figure 3:. Effects of glycan shielding and conformational masking on the accessibility of different parts of the Spike to potential therapeutics.
A) The probability that a residue is exposed to potential therapeutics, as determined from our structural ensemble. Red indicates a high probability of being exposed and blue indicates a low probability of being exposed. B) Exposure probabilities colored on the surface of the Spike protein. Exposed patches are circled in orange. Red residues have a higher probability of being exposed, whereas blue residues have a lower probability of being exposed. Green atoms denote glycans. C) Sequence conservation score colored onto the Spike protein. A conserved patch on the protein is circled in orange. Red residues have higher conservation, whereas blue residues have lower conservation. D) The difference in the probability that each residue is exposed between the ACE2-binding competent conformations and the entire ensemble. Red residues have a higher probability of being exposed upon opening, whereas blue residues have a lower probability of being exposed.
Figure 4:
Figure 4:. Examples of cryptic pockets and functionally-relevant dynamics.
A-B) Conformational ensemble of Mpro (monomeric) highlighting cryptic pockets near the active site (AS) and domain interface (DI). Conformational states (black circles) are projected onto the solvent accessible surface areas (SASAs) of residues surrounding either the active-site or dimerization interface. The starting structure for simulations (6Y2E) is shown as a red dot. Representative structures are depicted with cartoon and transparent surface. Domains I and II are colored cyan and domain III is colored gray. The loop of domain III, which covers the active-site residues and is seen to be highly dynamic, is colored red. C-D) The conformational ensemble from our simulations of nucleoprotein is similar to the distribution of structures seen experimentally. Conformational states are projected onto the distance and angle between the positive finger and a nearby loop. Angles were calculated between vectors that point along each red segment in panel D and distances were calculated between their centers of mass. Cluster centers are represented as black circles, the starting structure for simulations (6VYO) is shown as a red dot, and NMR structures are shown with solid blue dots. Representative structures are shown as cartoons.
Figure 5:
Figure 5:. NSP10/NSP14 (complex) transition from closed to open state.
Backbone is represented as a cartoon and sidechains are represented with a transparent surface. The residues that undergo a large conformational change to expose a cryptic pocket are highlighted in pink.
Figure 6:
Figure 6:. Human IL6-R transition from expanded to closed state.
Backbone is represented as a cartoon and sidechains are represented with a transparent surface. The residues that undergo a large conformational change to reveal a potential druggable site are highlighted in red.

Update of

References

    1. Zhou P et al. A pneumonia outbreak associated with a new coronavirus of probable bat origin. Nature 579, 270–273 (2020). - PMC - PubMed
    1. Liu Y, Gayle AA, Wilder-Smith A & Rocklöv J The reproductive number of COVID-19 is higher compared to SARS coronavirus. J Travel Med 27, (2020). - PMC - PubMed
    1. Sorci G, Faivre B & Morand S Why Does COVID-19 Case Fatality Rate Vary Among Countries? SSRN Journal (2020). doi: 10.2139/ssrn.3576892 - DOI
    1. Morteza Abdullatif Khafaie FR Cross-Country Comparison of Case Fatality Rates of COVID-19/SARS-COV-2. Osong Public Health and Research Perspectives 11, 74–80 (2020). - PMC - PubMed
    1. Mahase E Coronavirus: covid-19 has killed more people than SARS and MERS combined, despite lower case fatality rate. BMJ 368, m641 (2020). - PubMed

Publication types