. 2021 Jul;24(7):1020-1034.
doi: 10.1038/s41593-021-00862-0. Epub 2021 May 24.

Genome-wide CRISPRi/a screens in human neurons link lysosomal failure to ferroptosis

Affiliations

Genome-wide CRISPRi/a screens in human neurons link lysosomal failure to ferroptosis

Ruilin Tian et al. Nat Neurosci. 2021 Jul.

Abstract

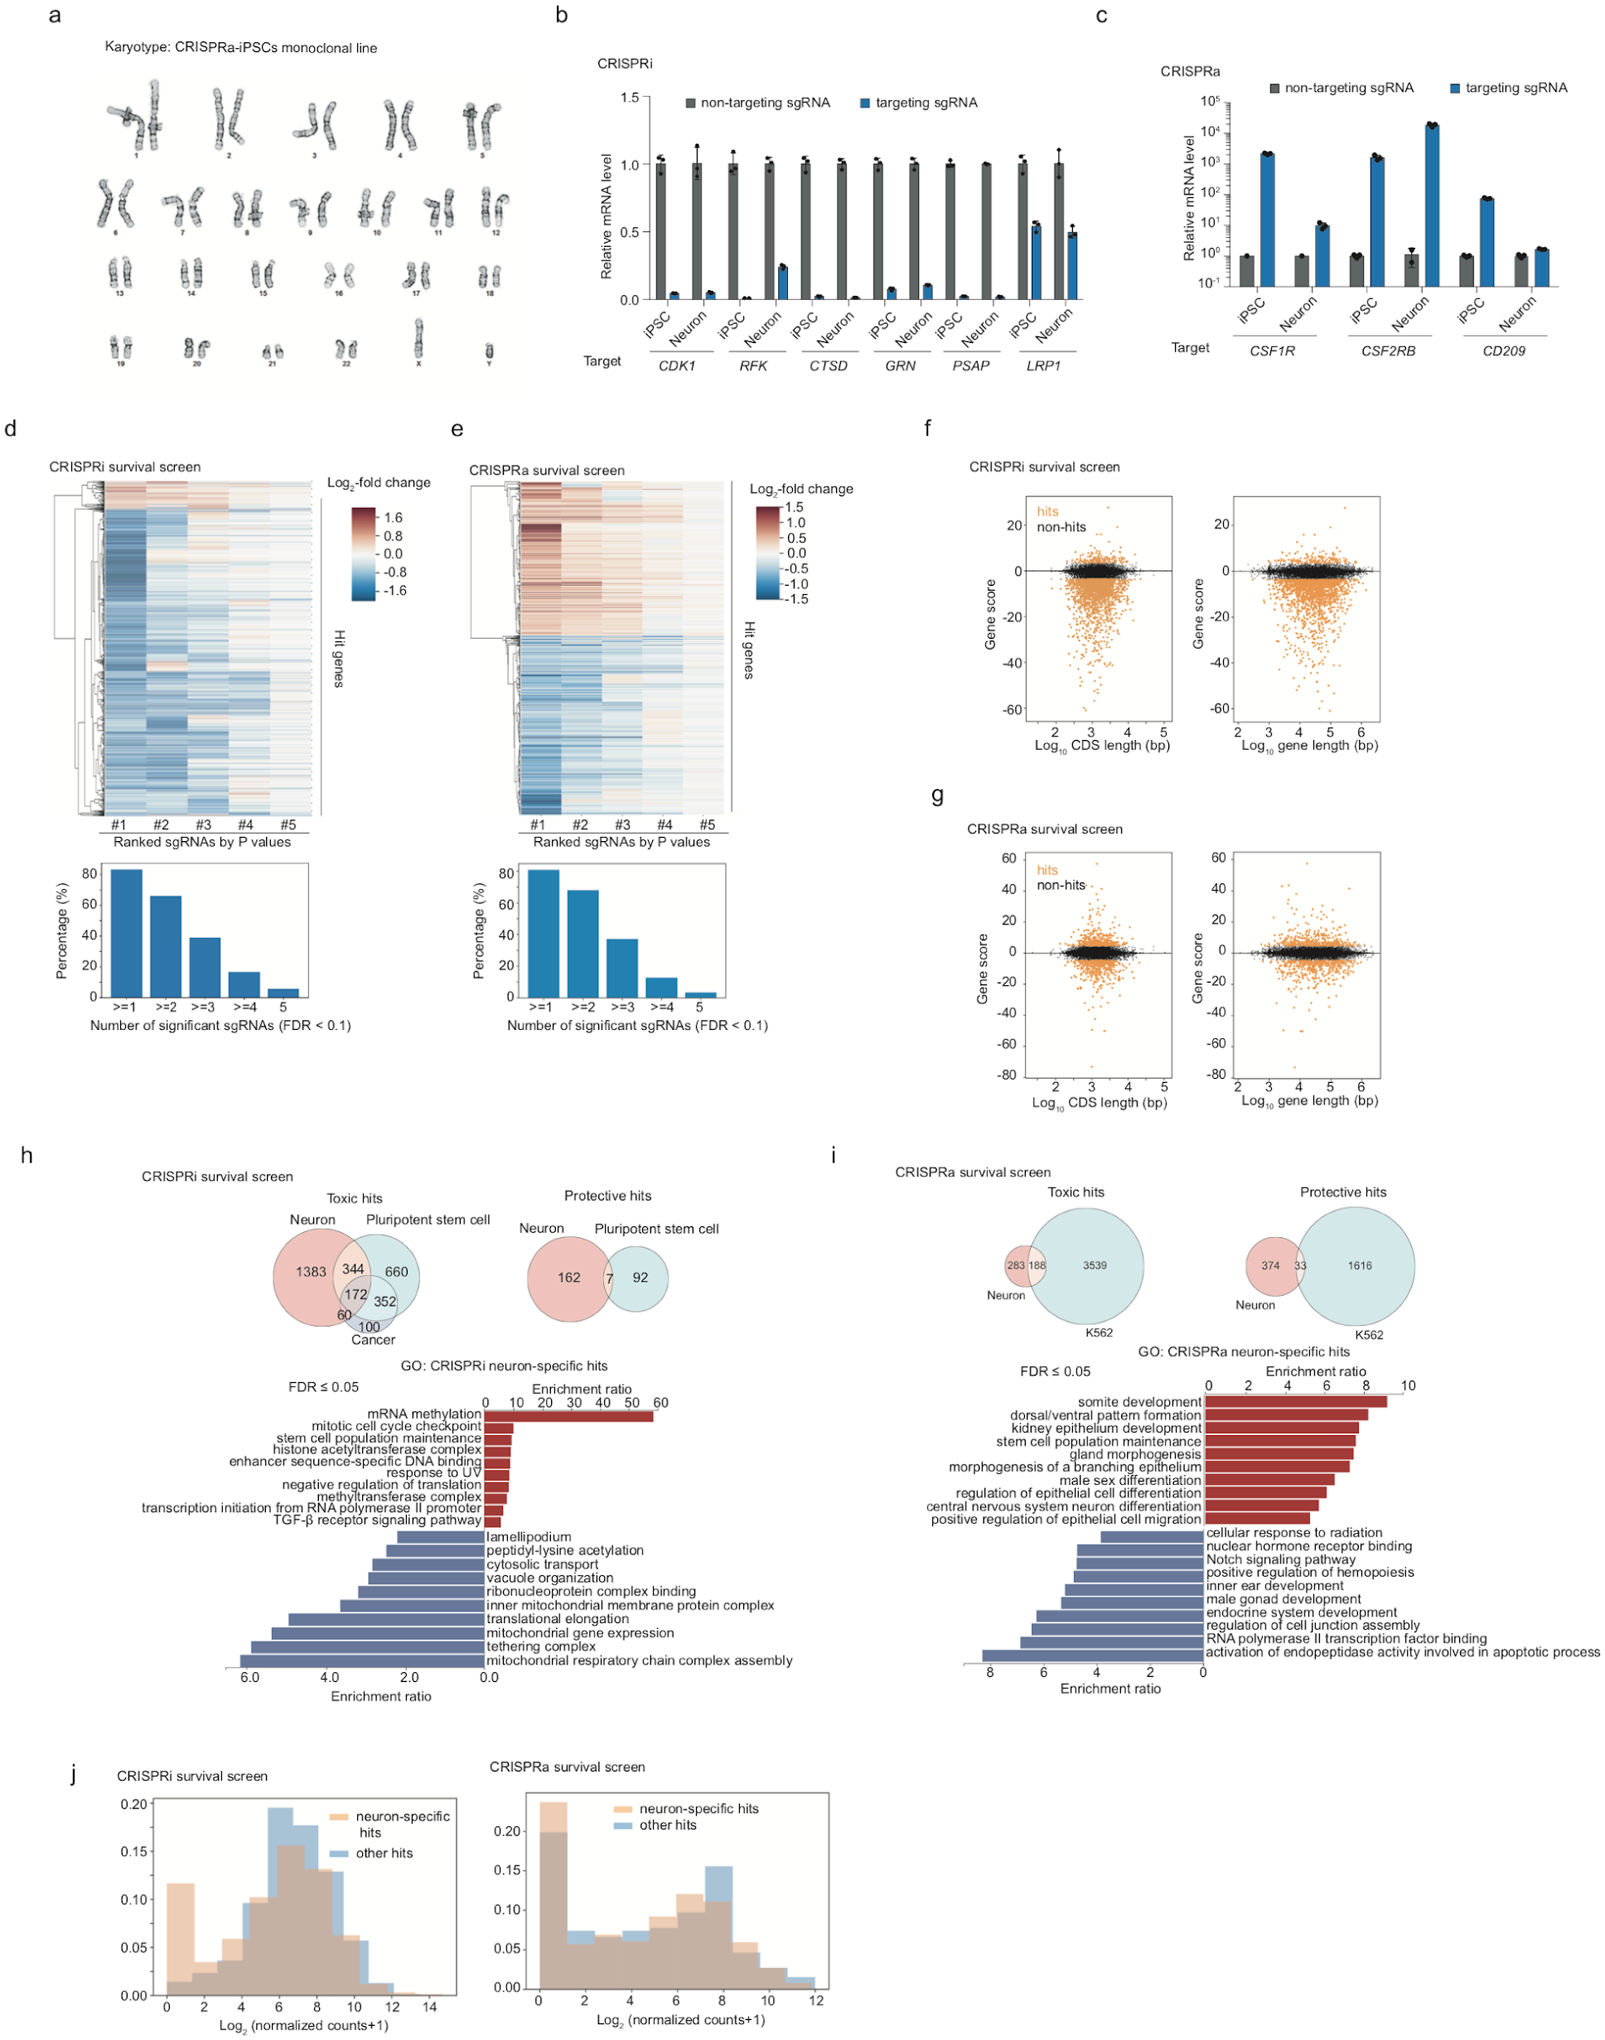
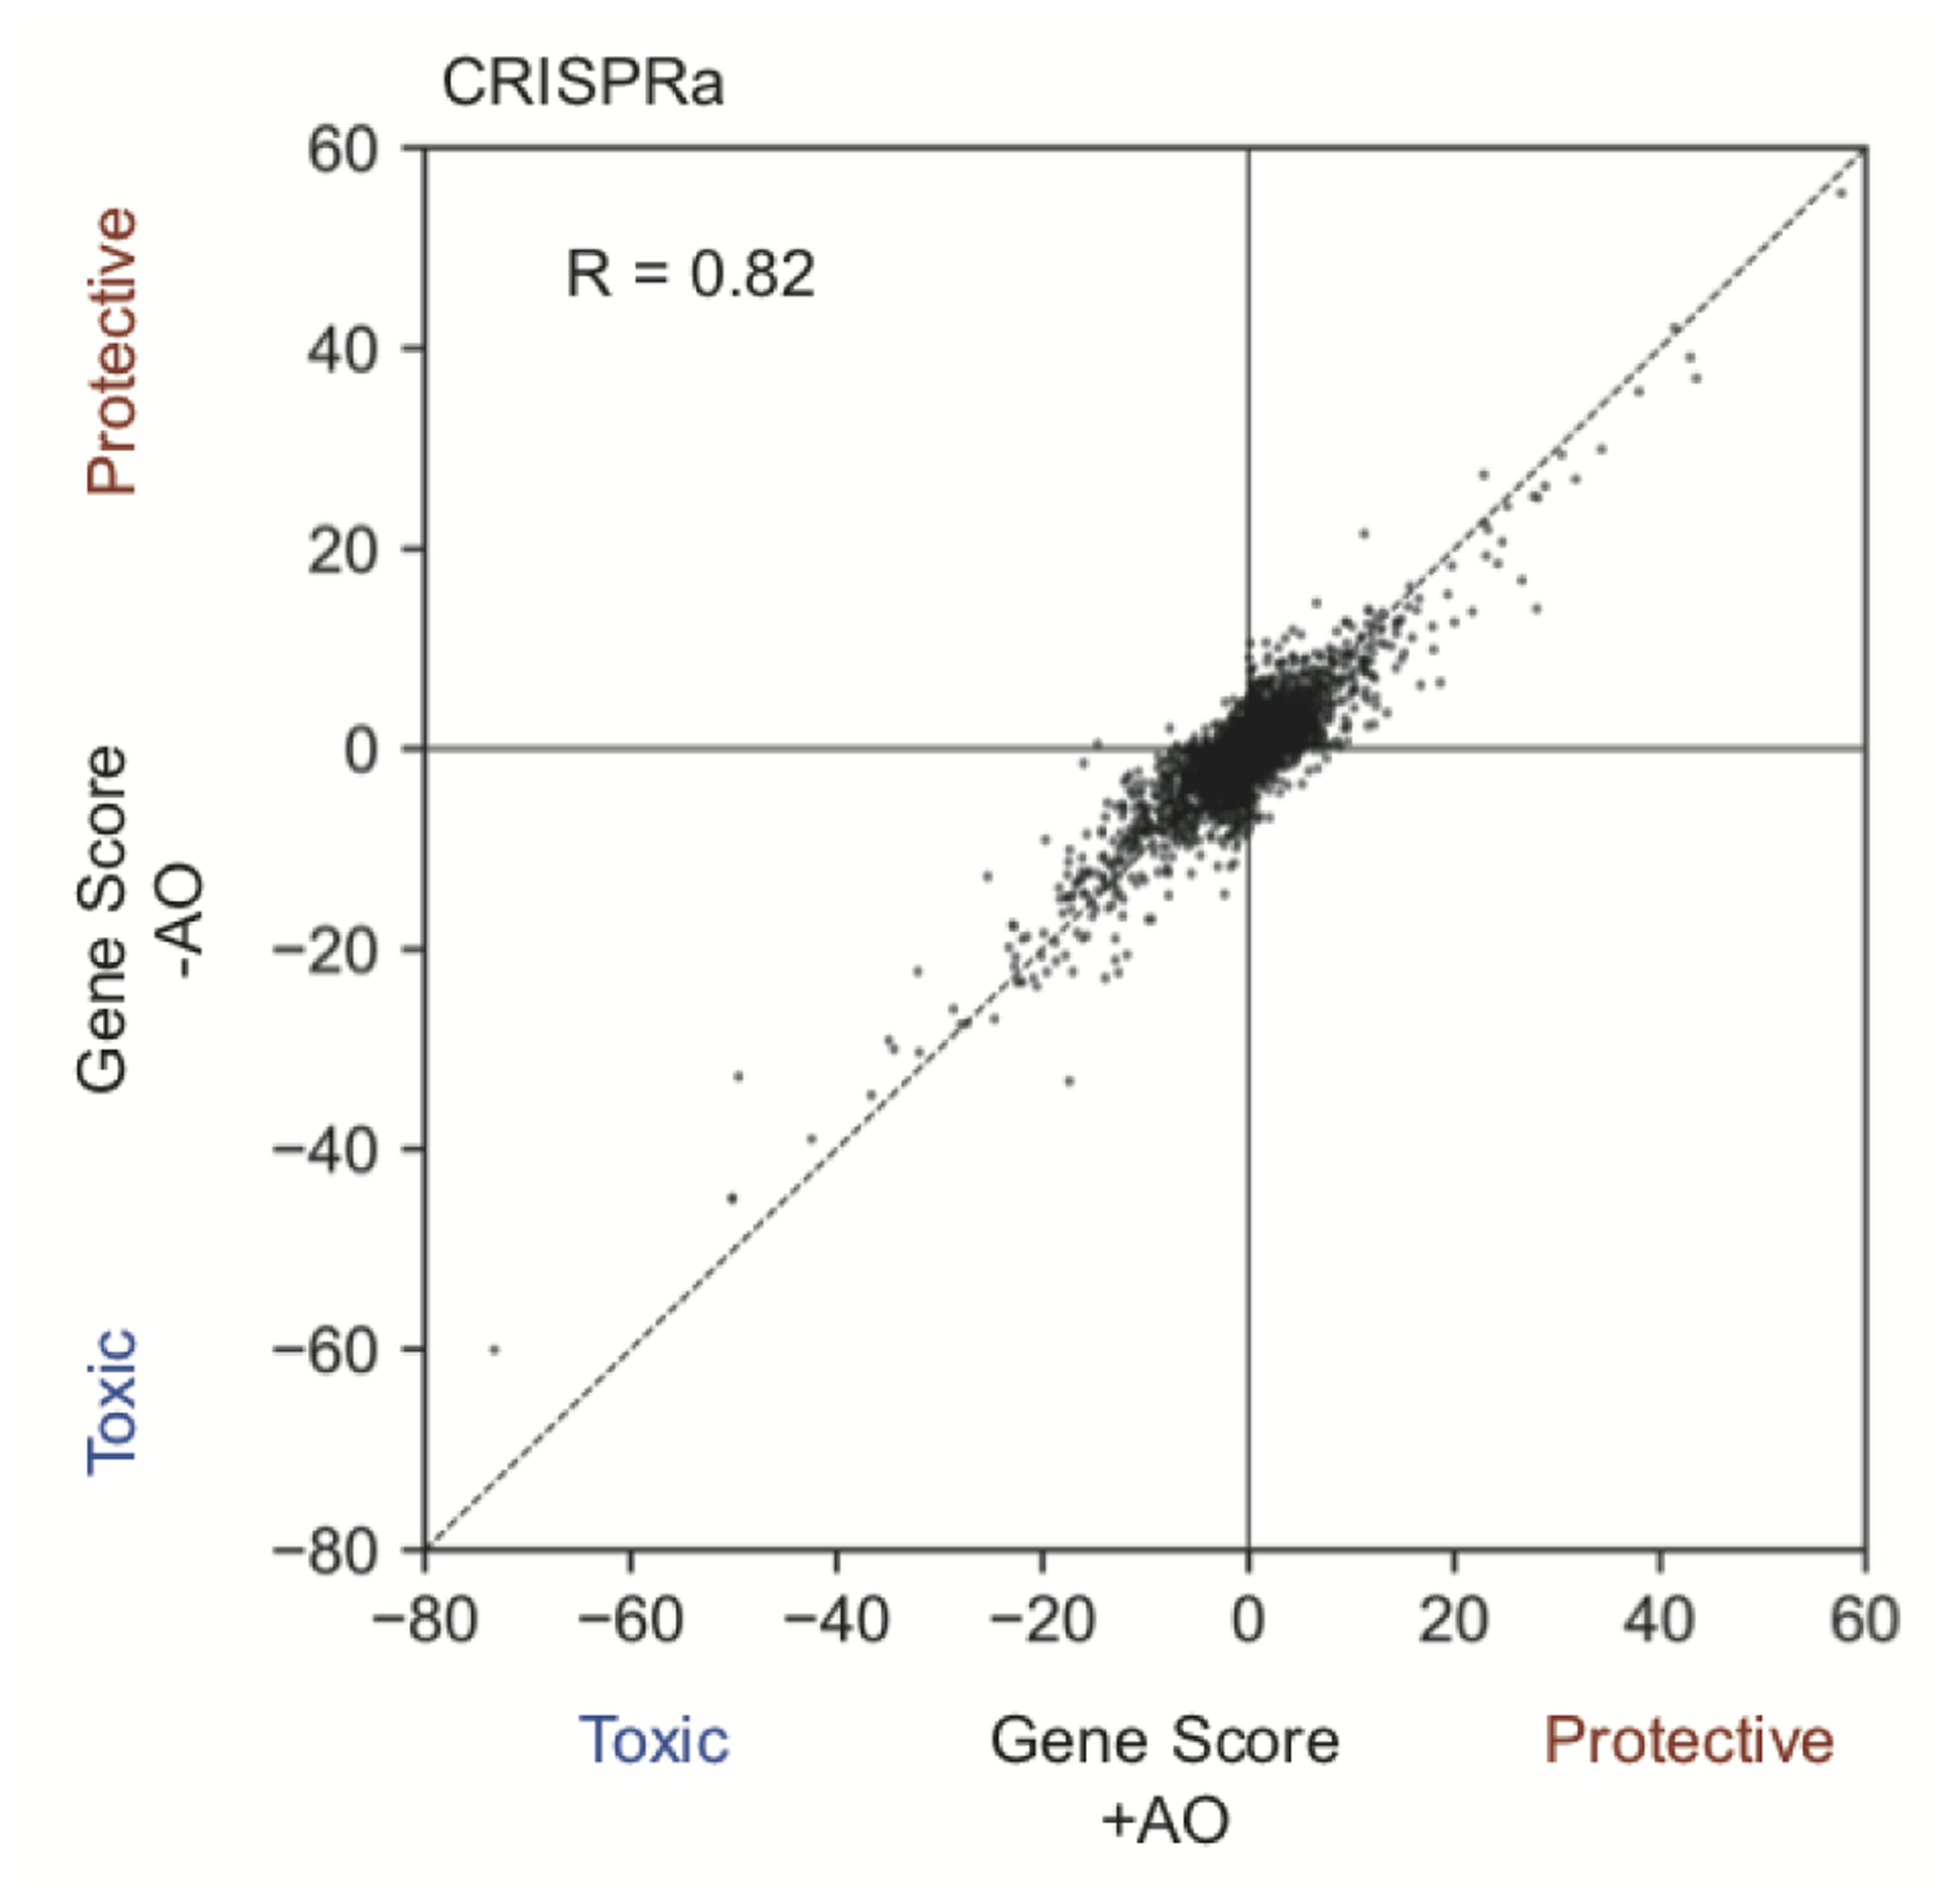
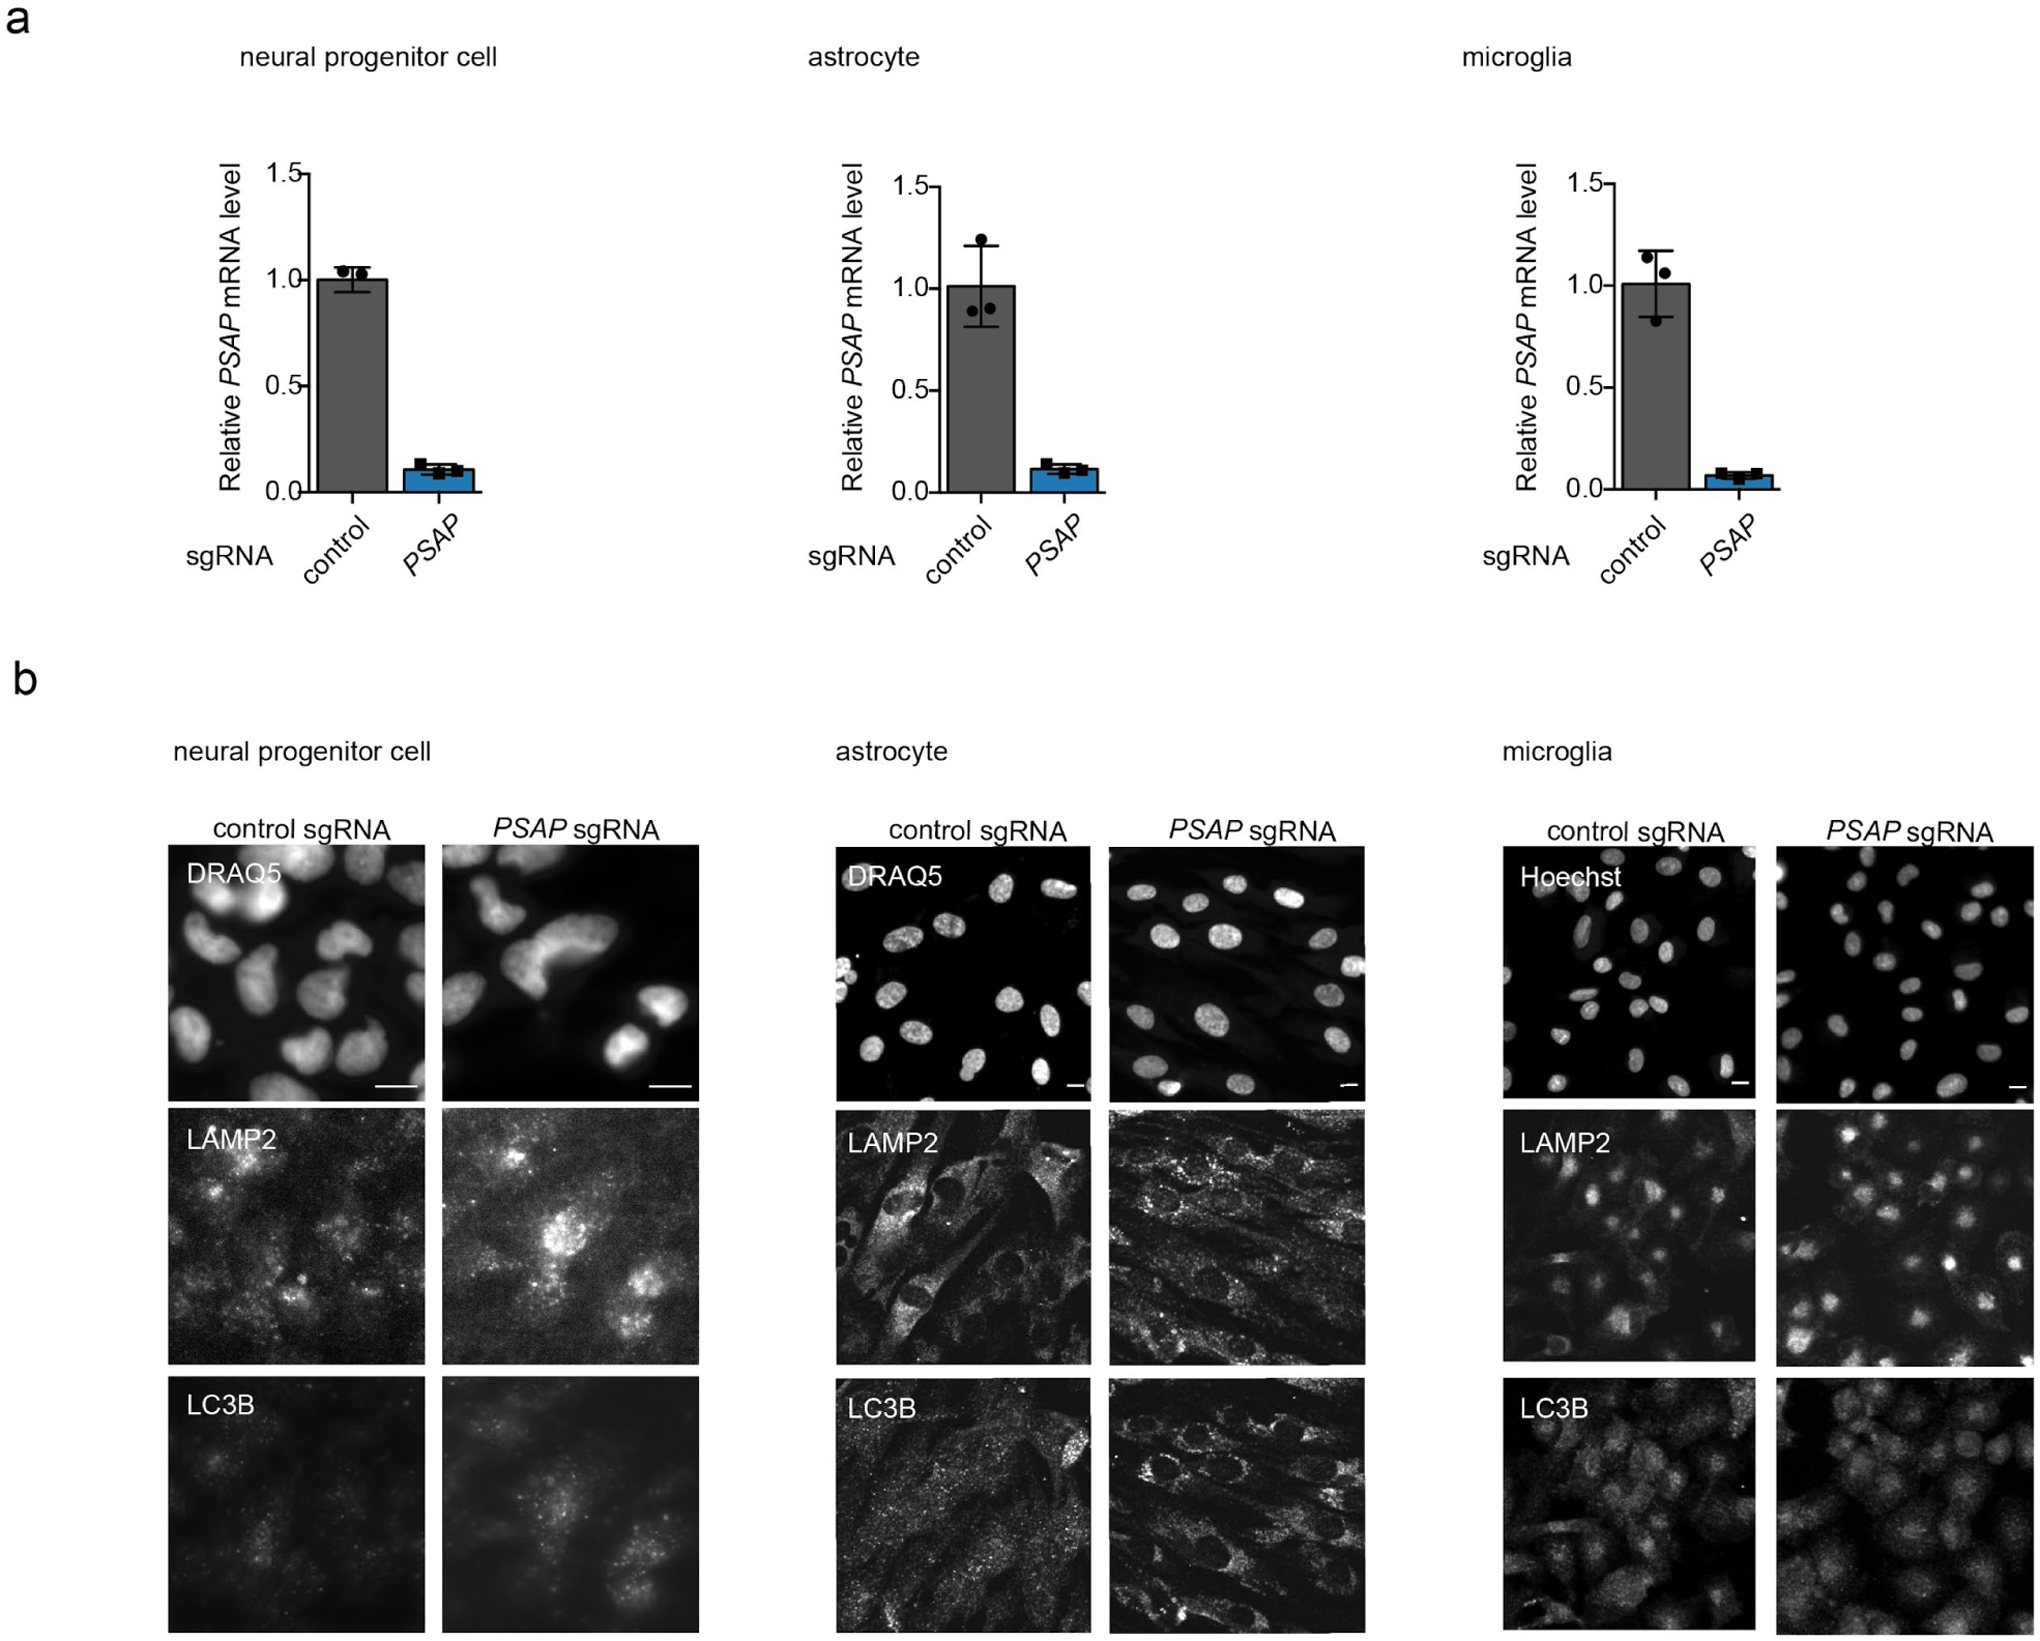
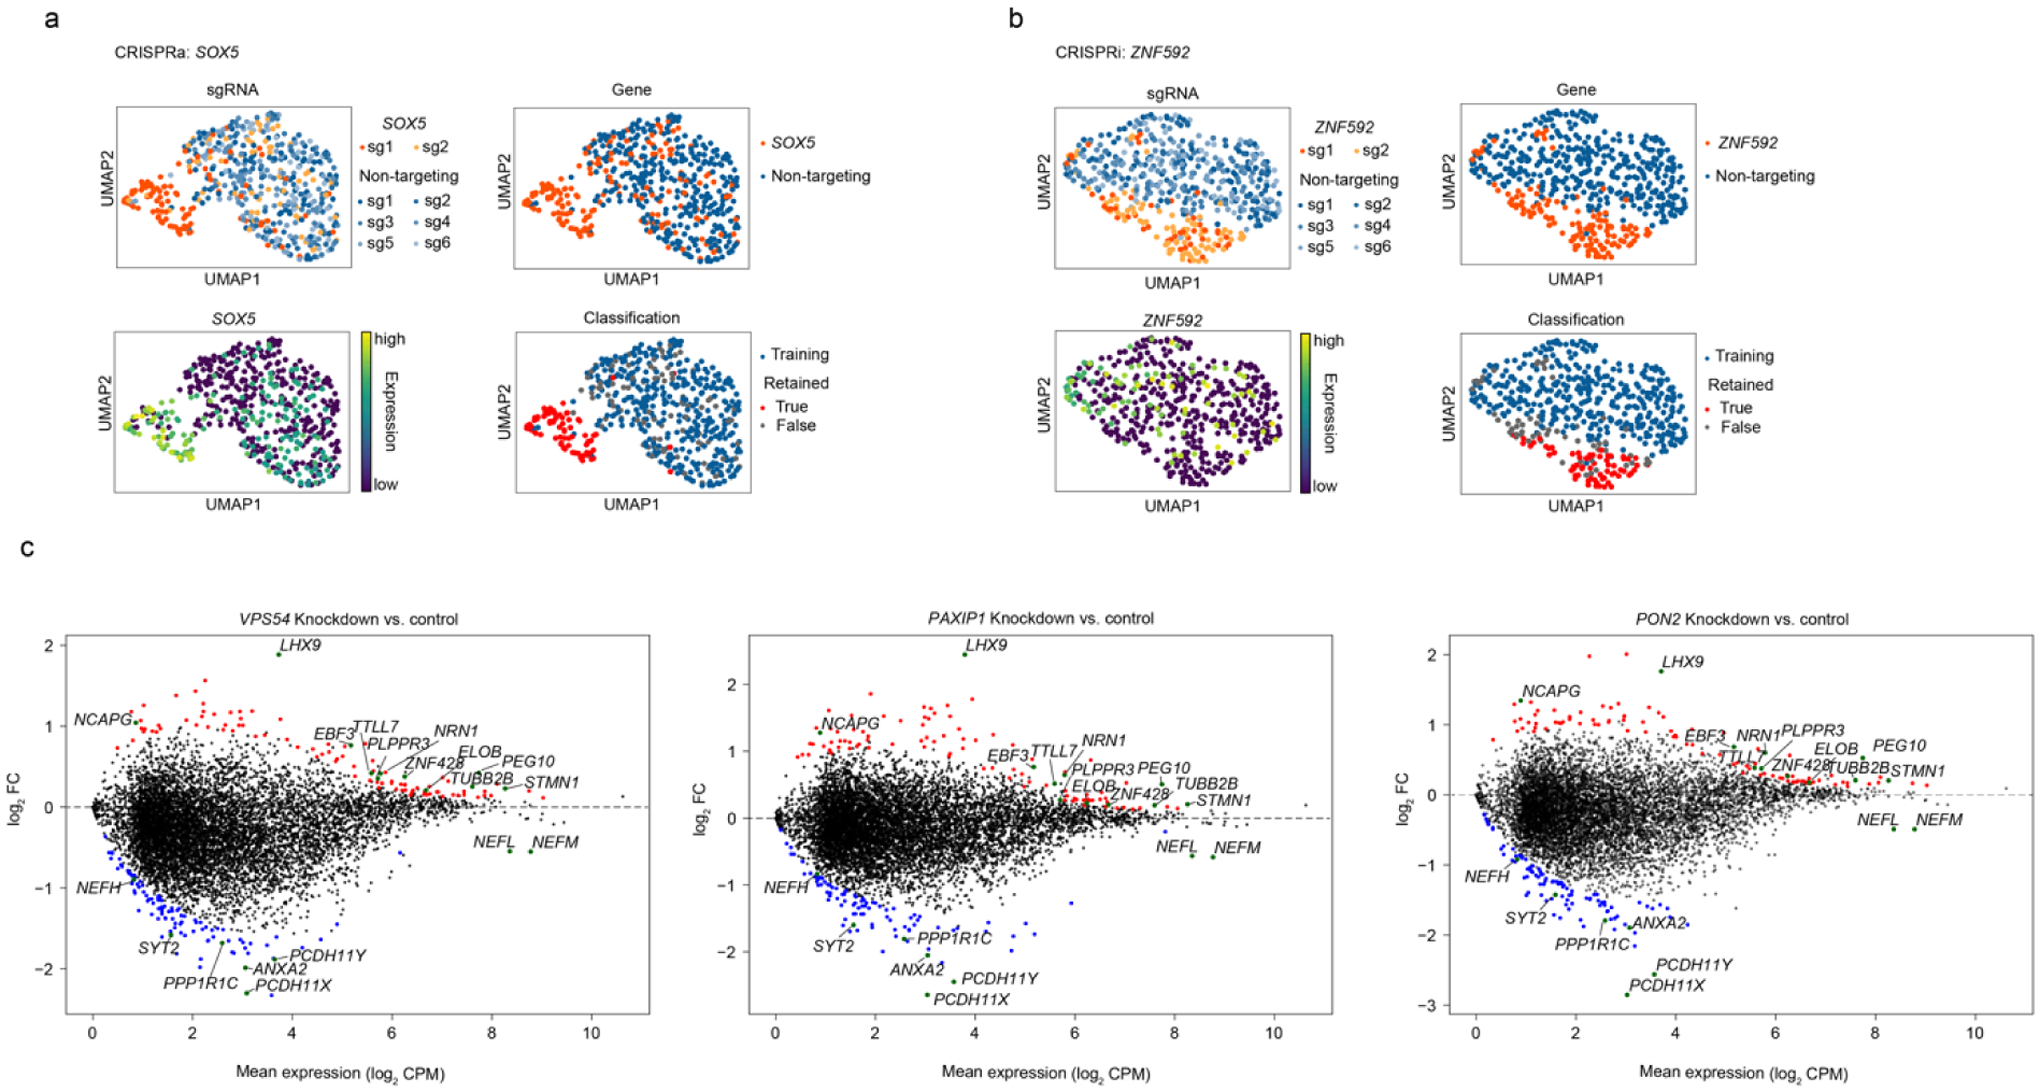
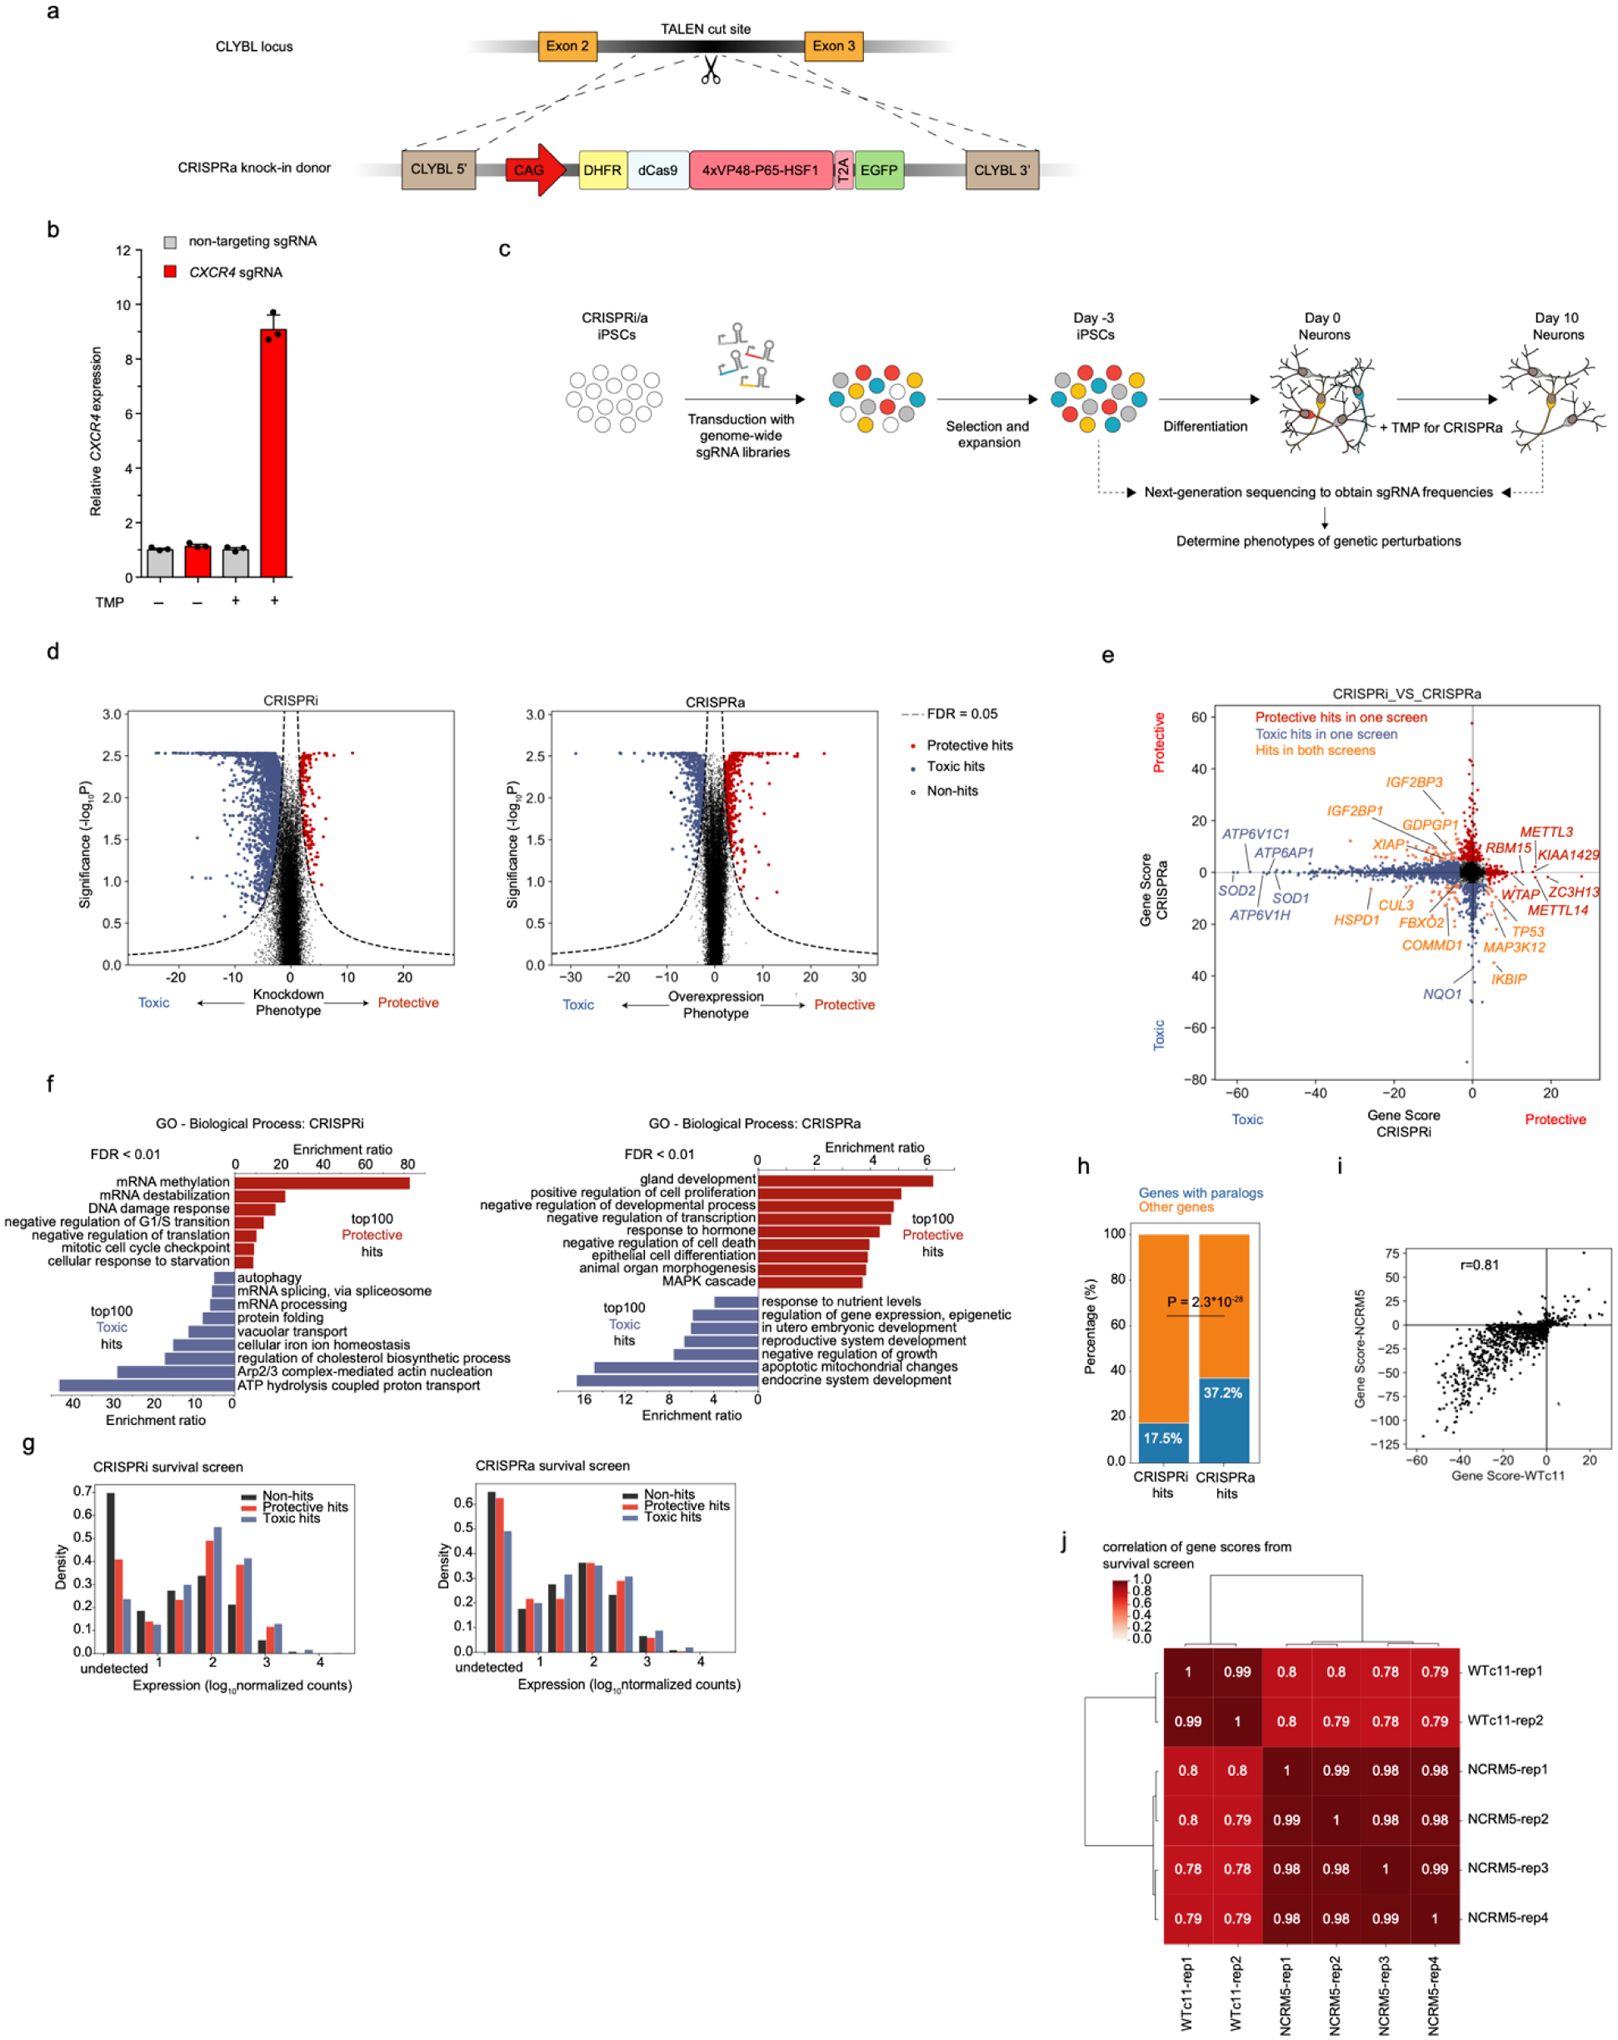
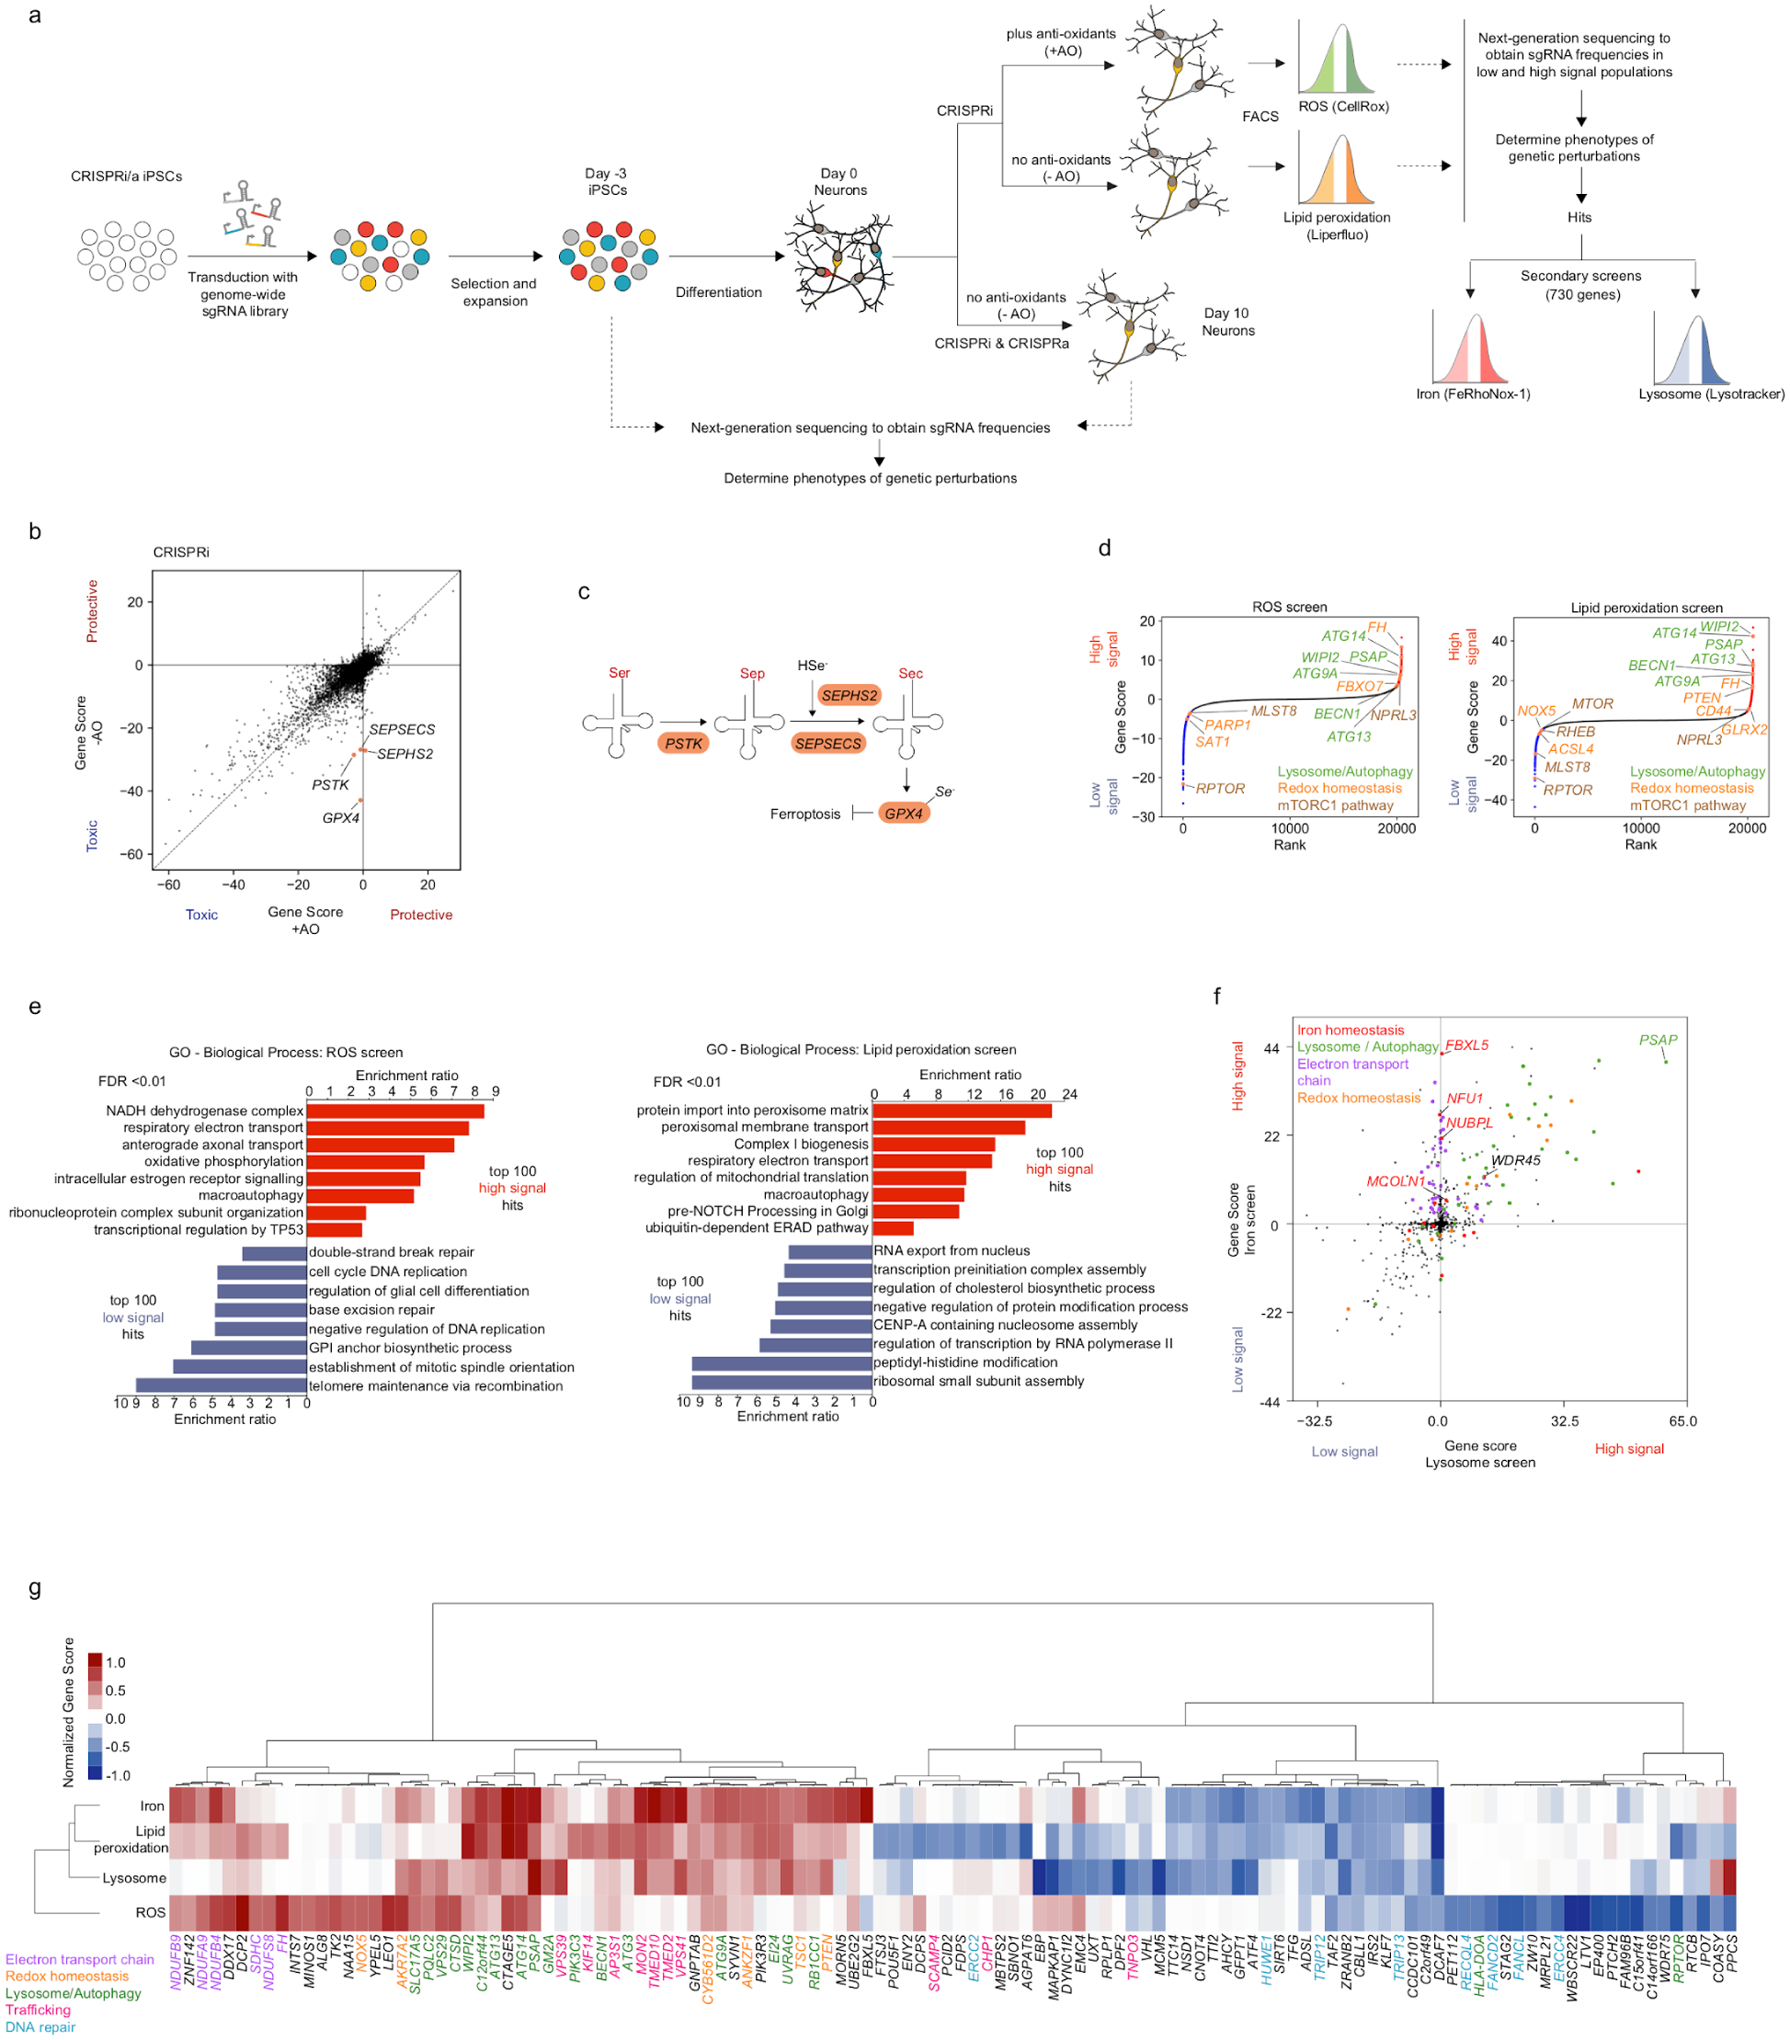
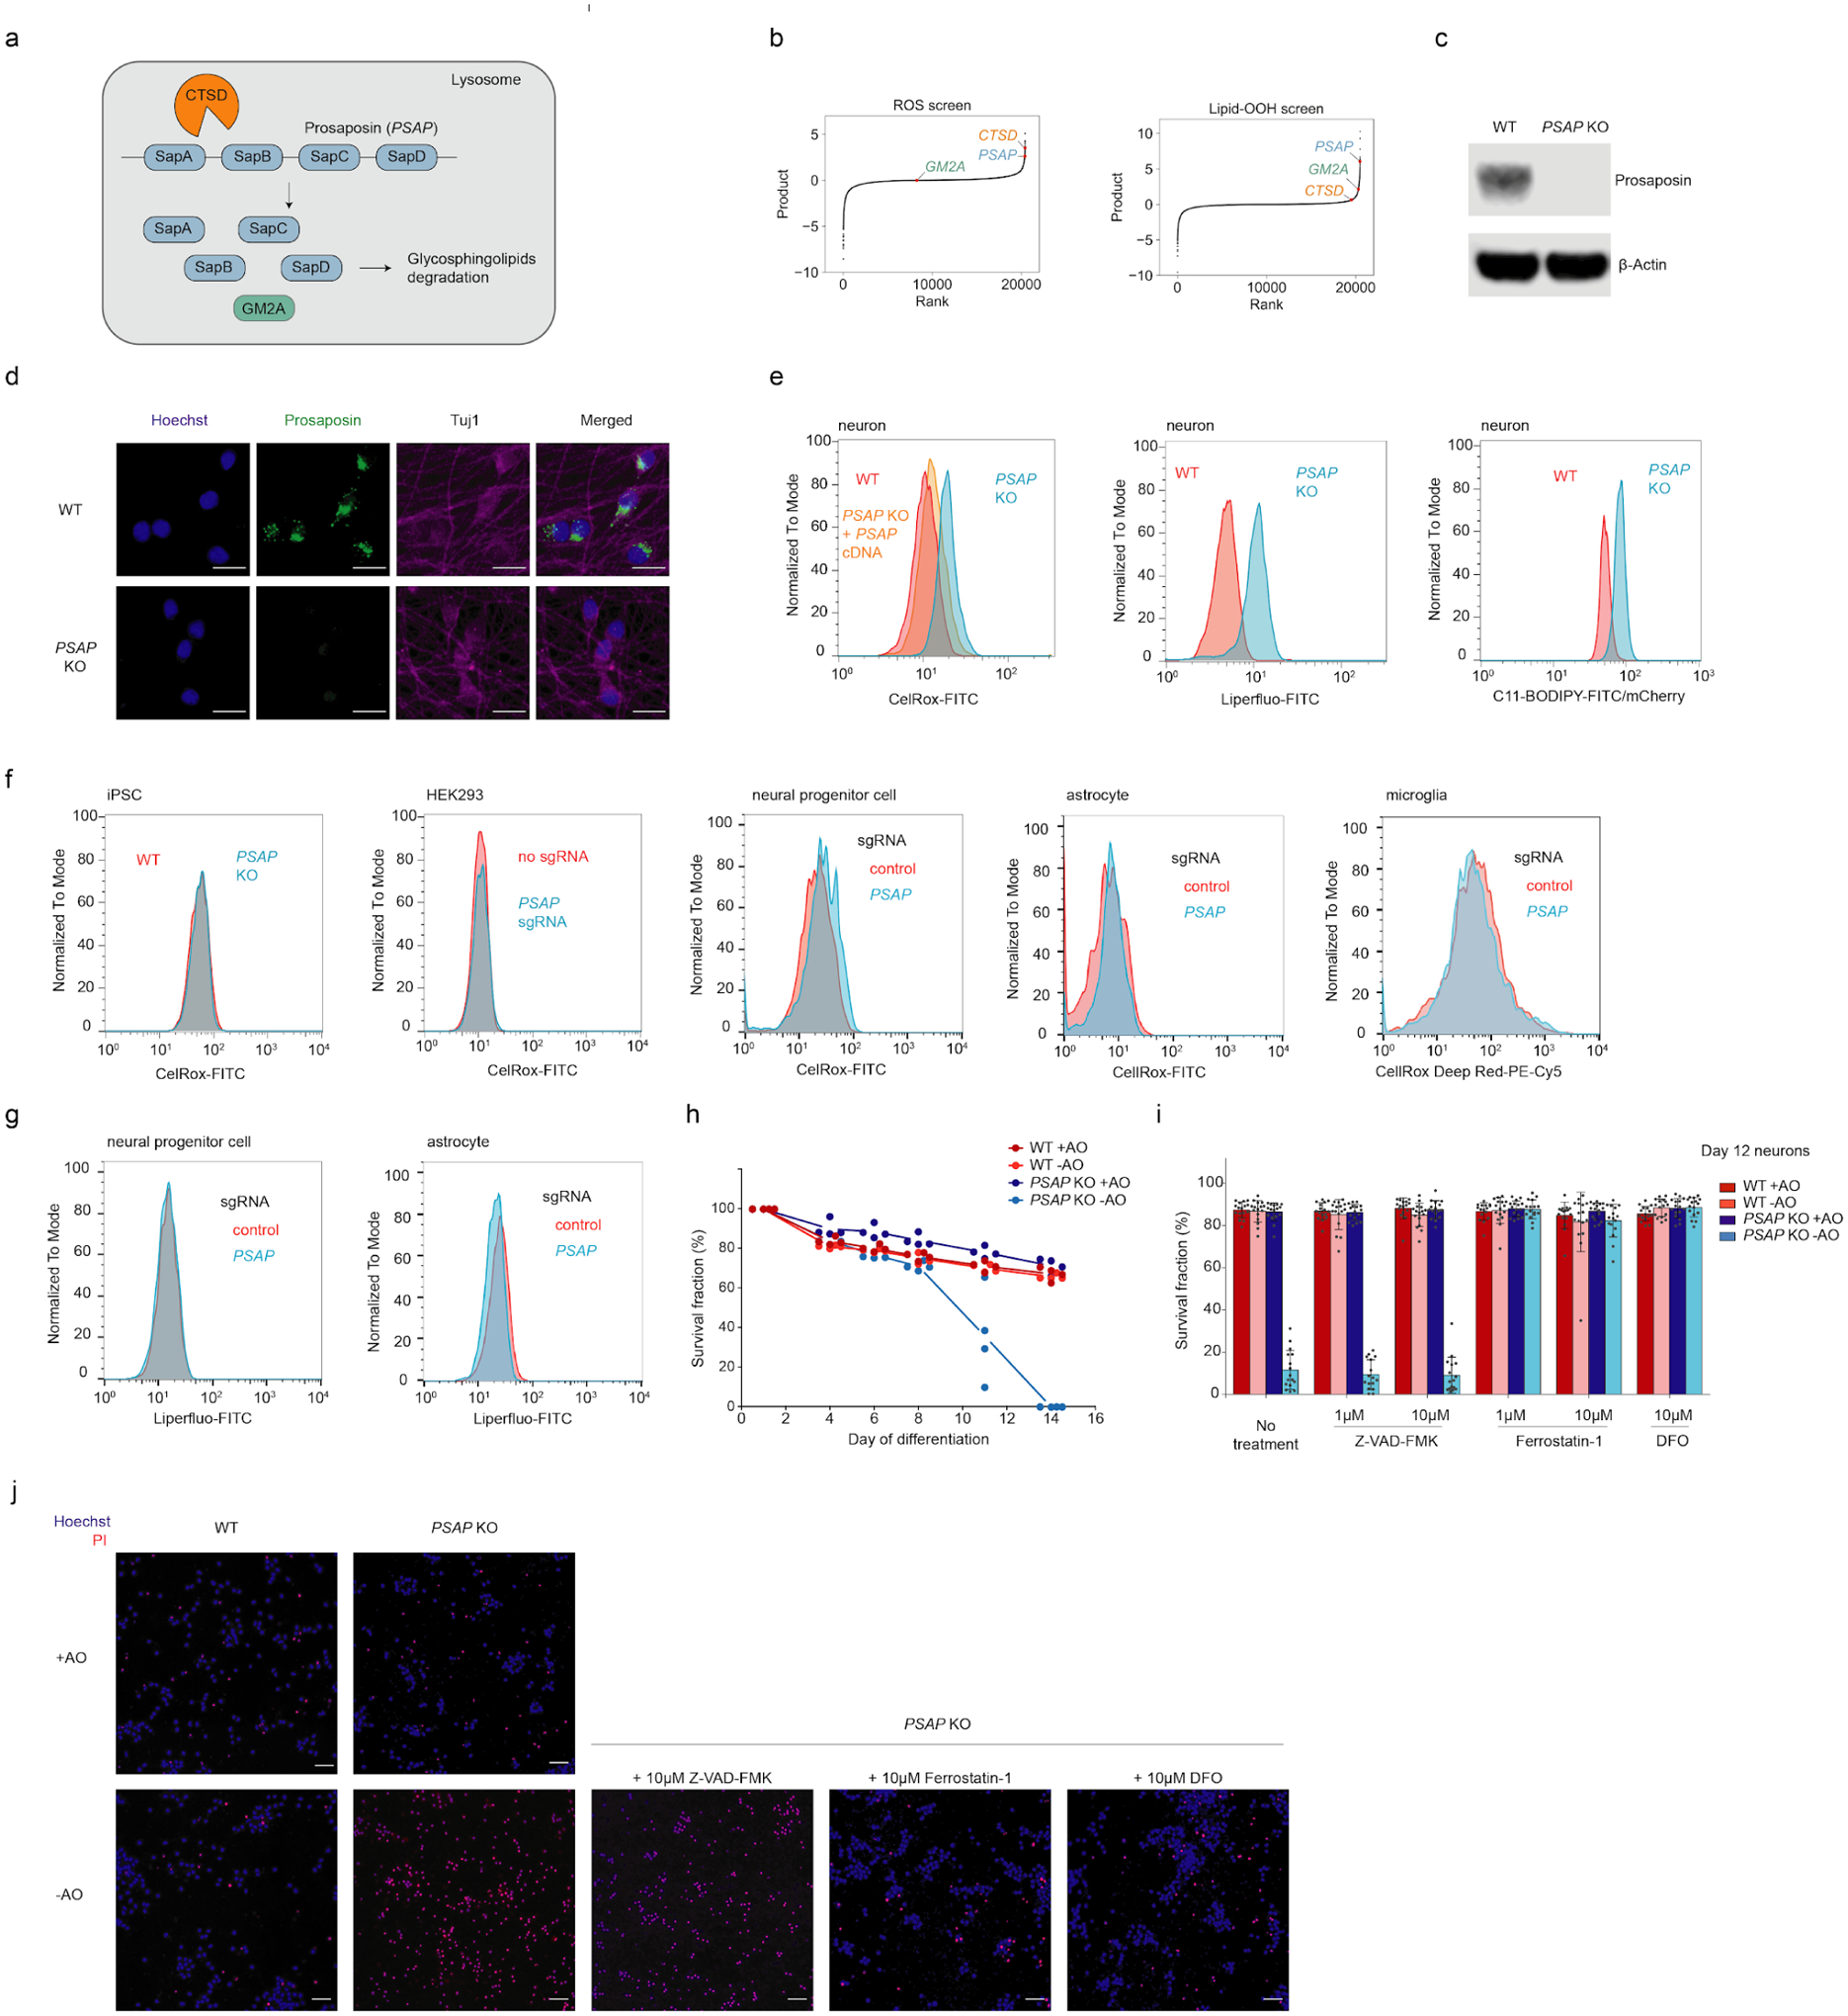
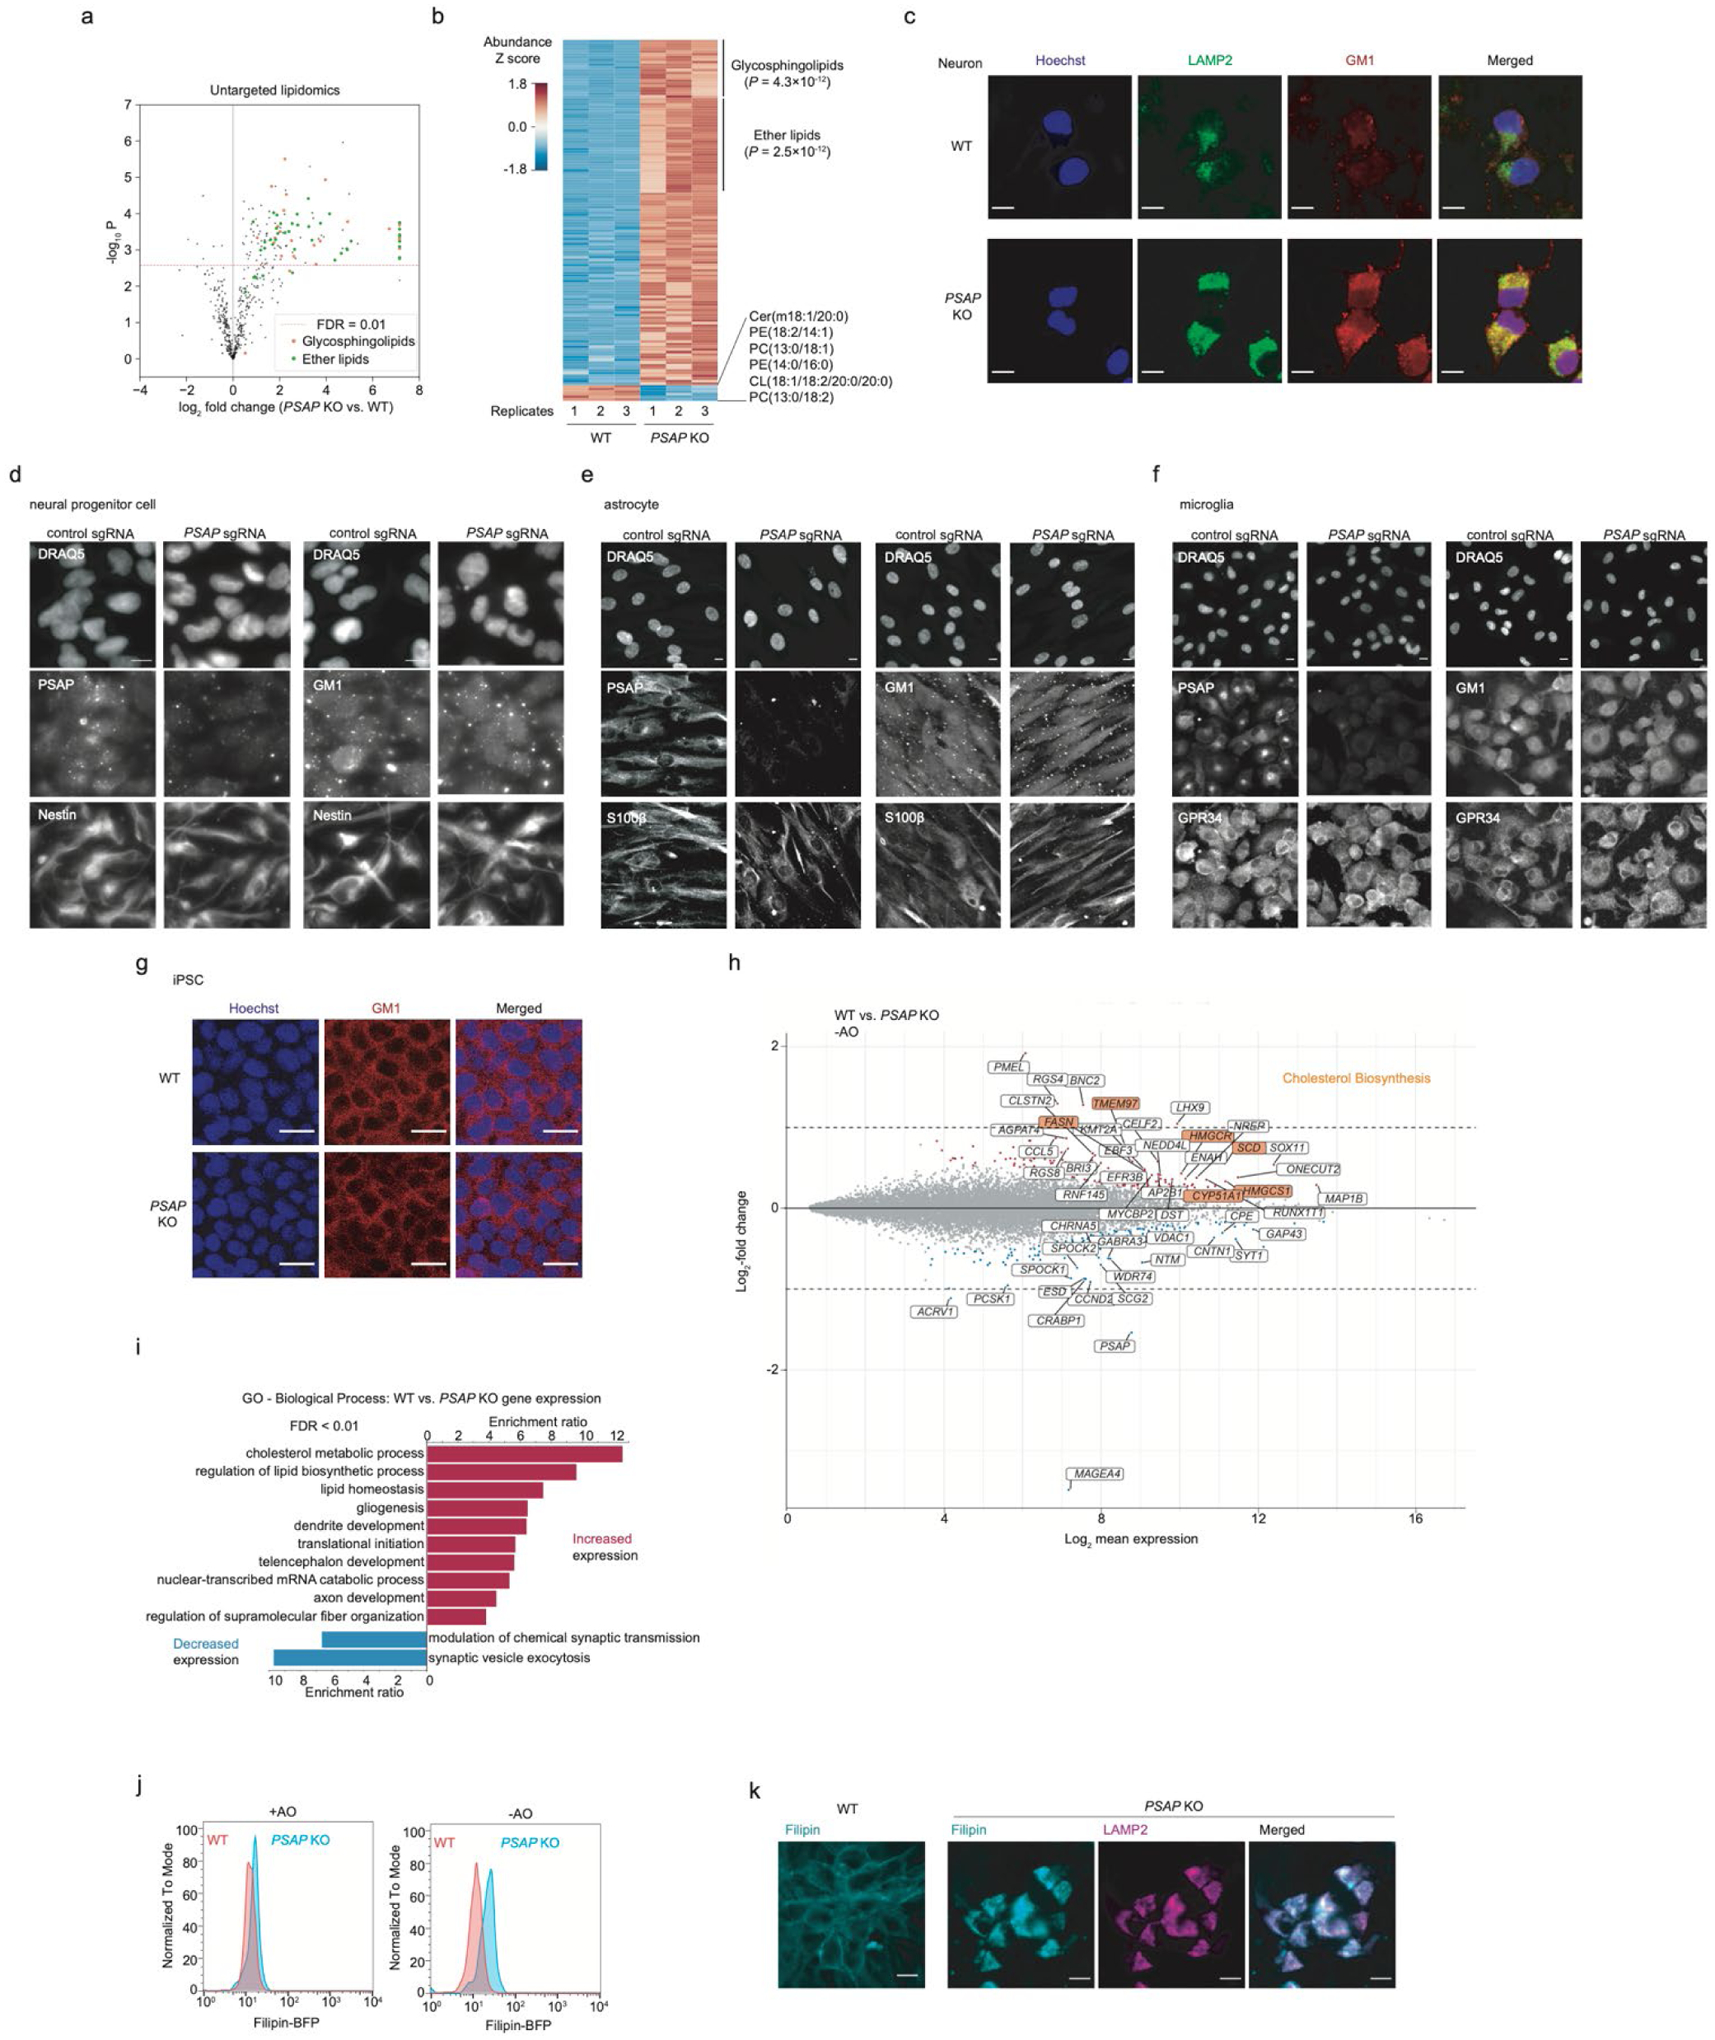
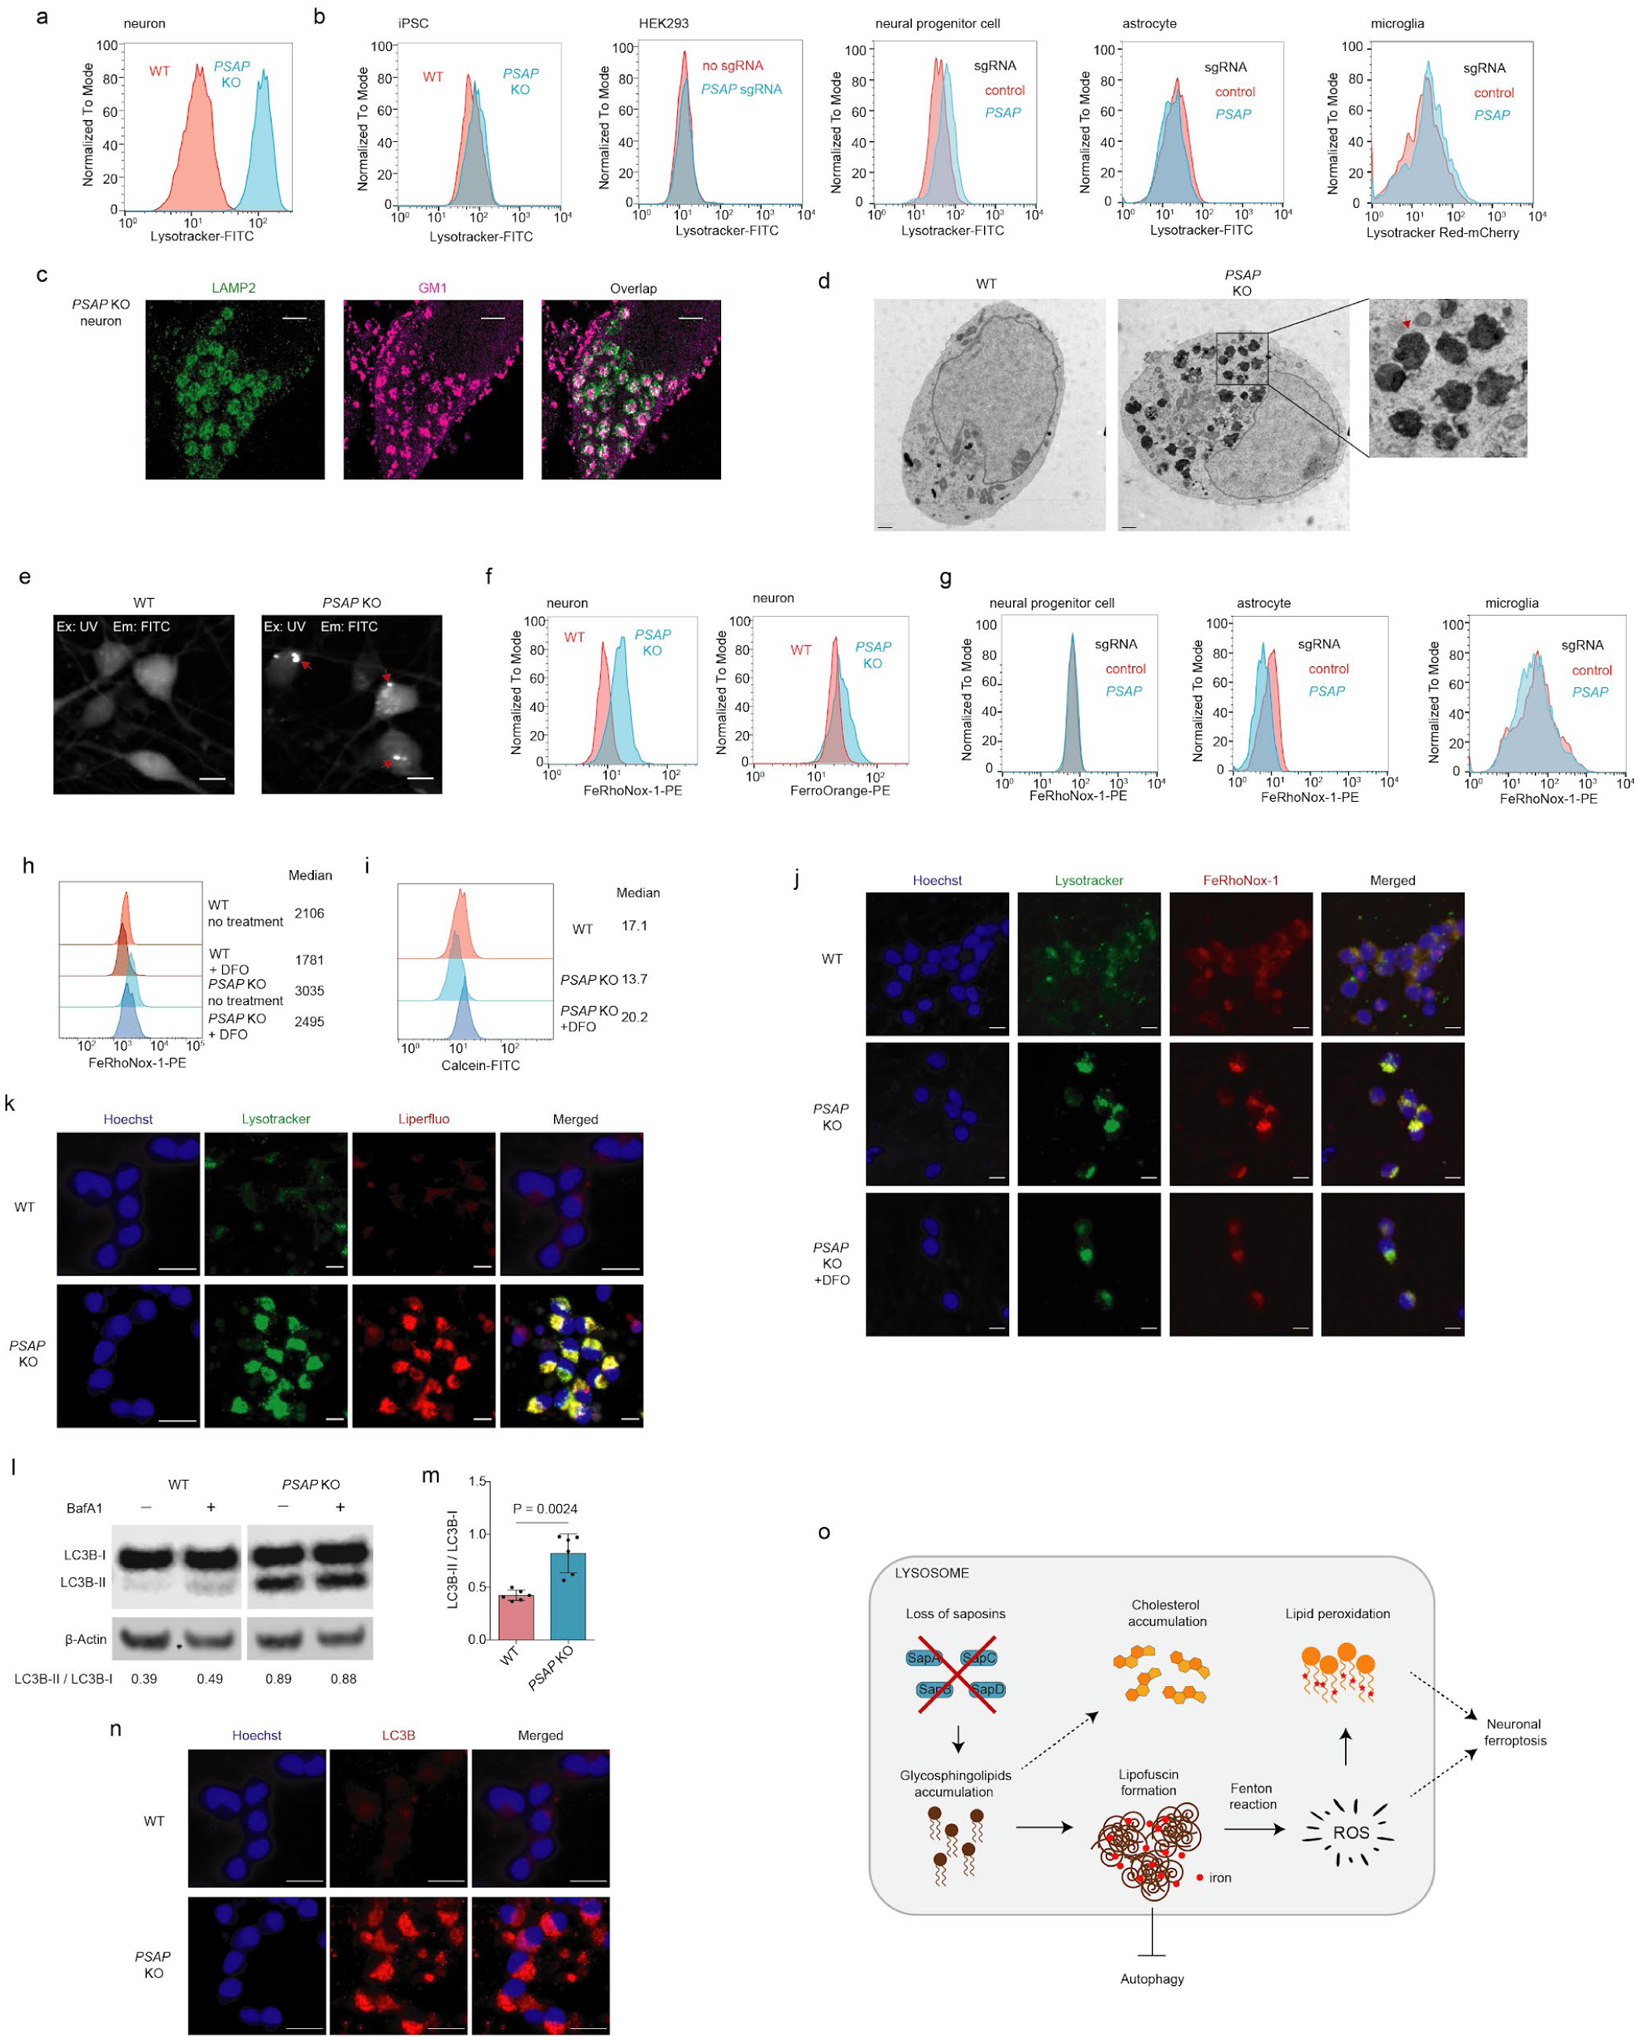
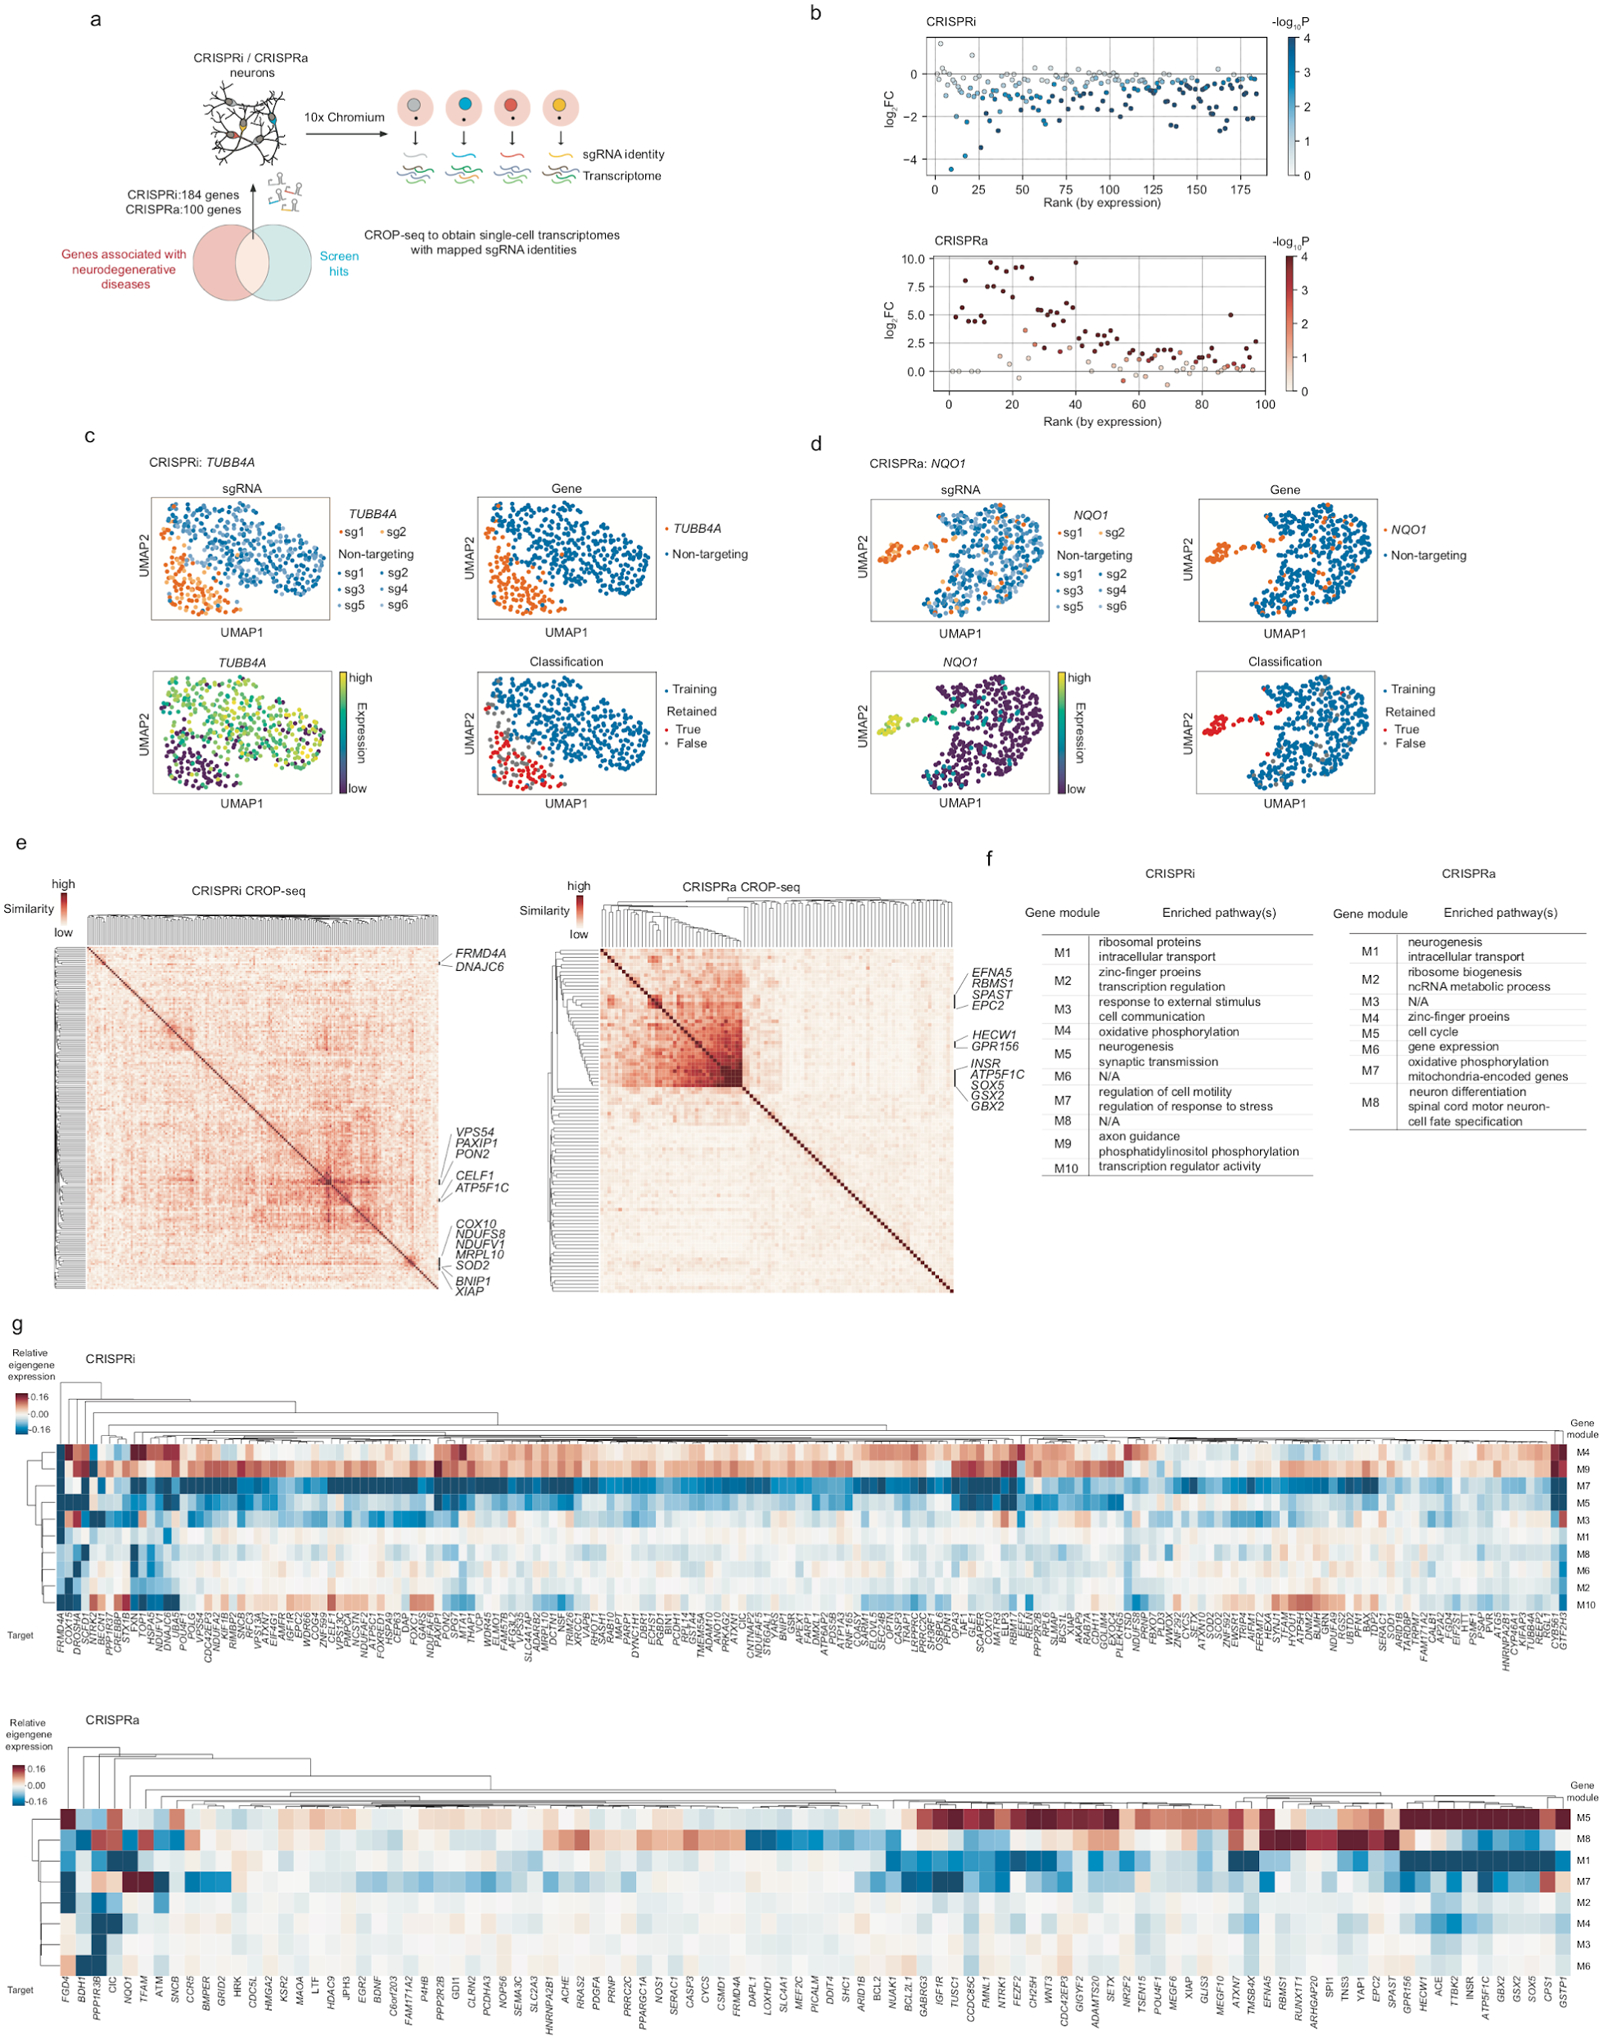
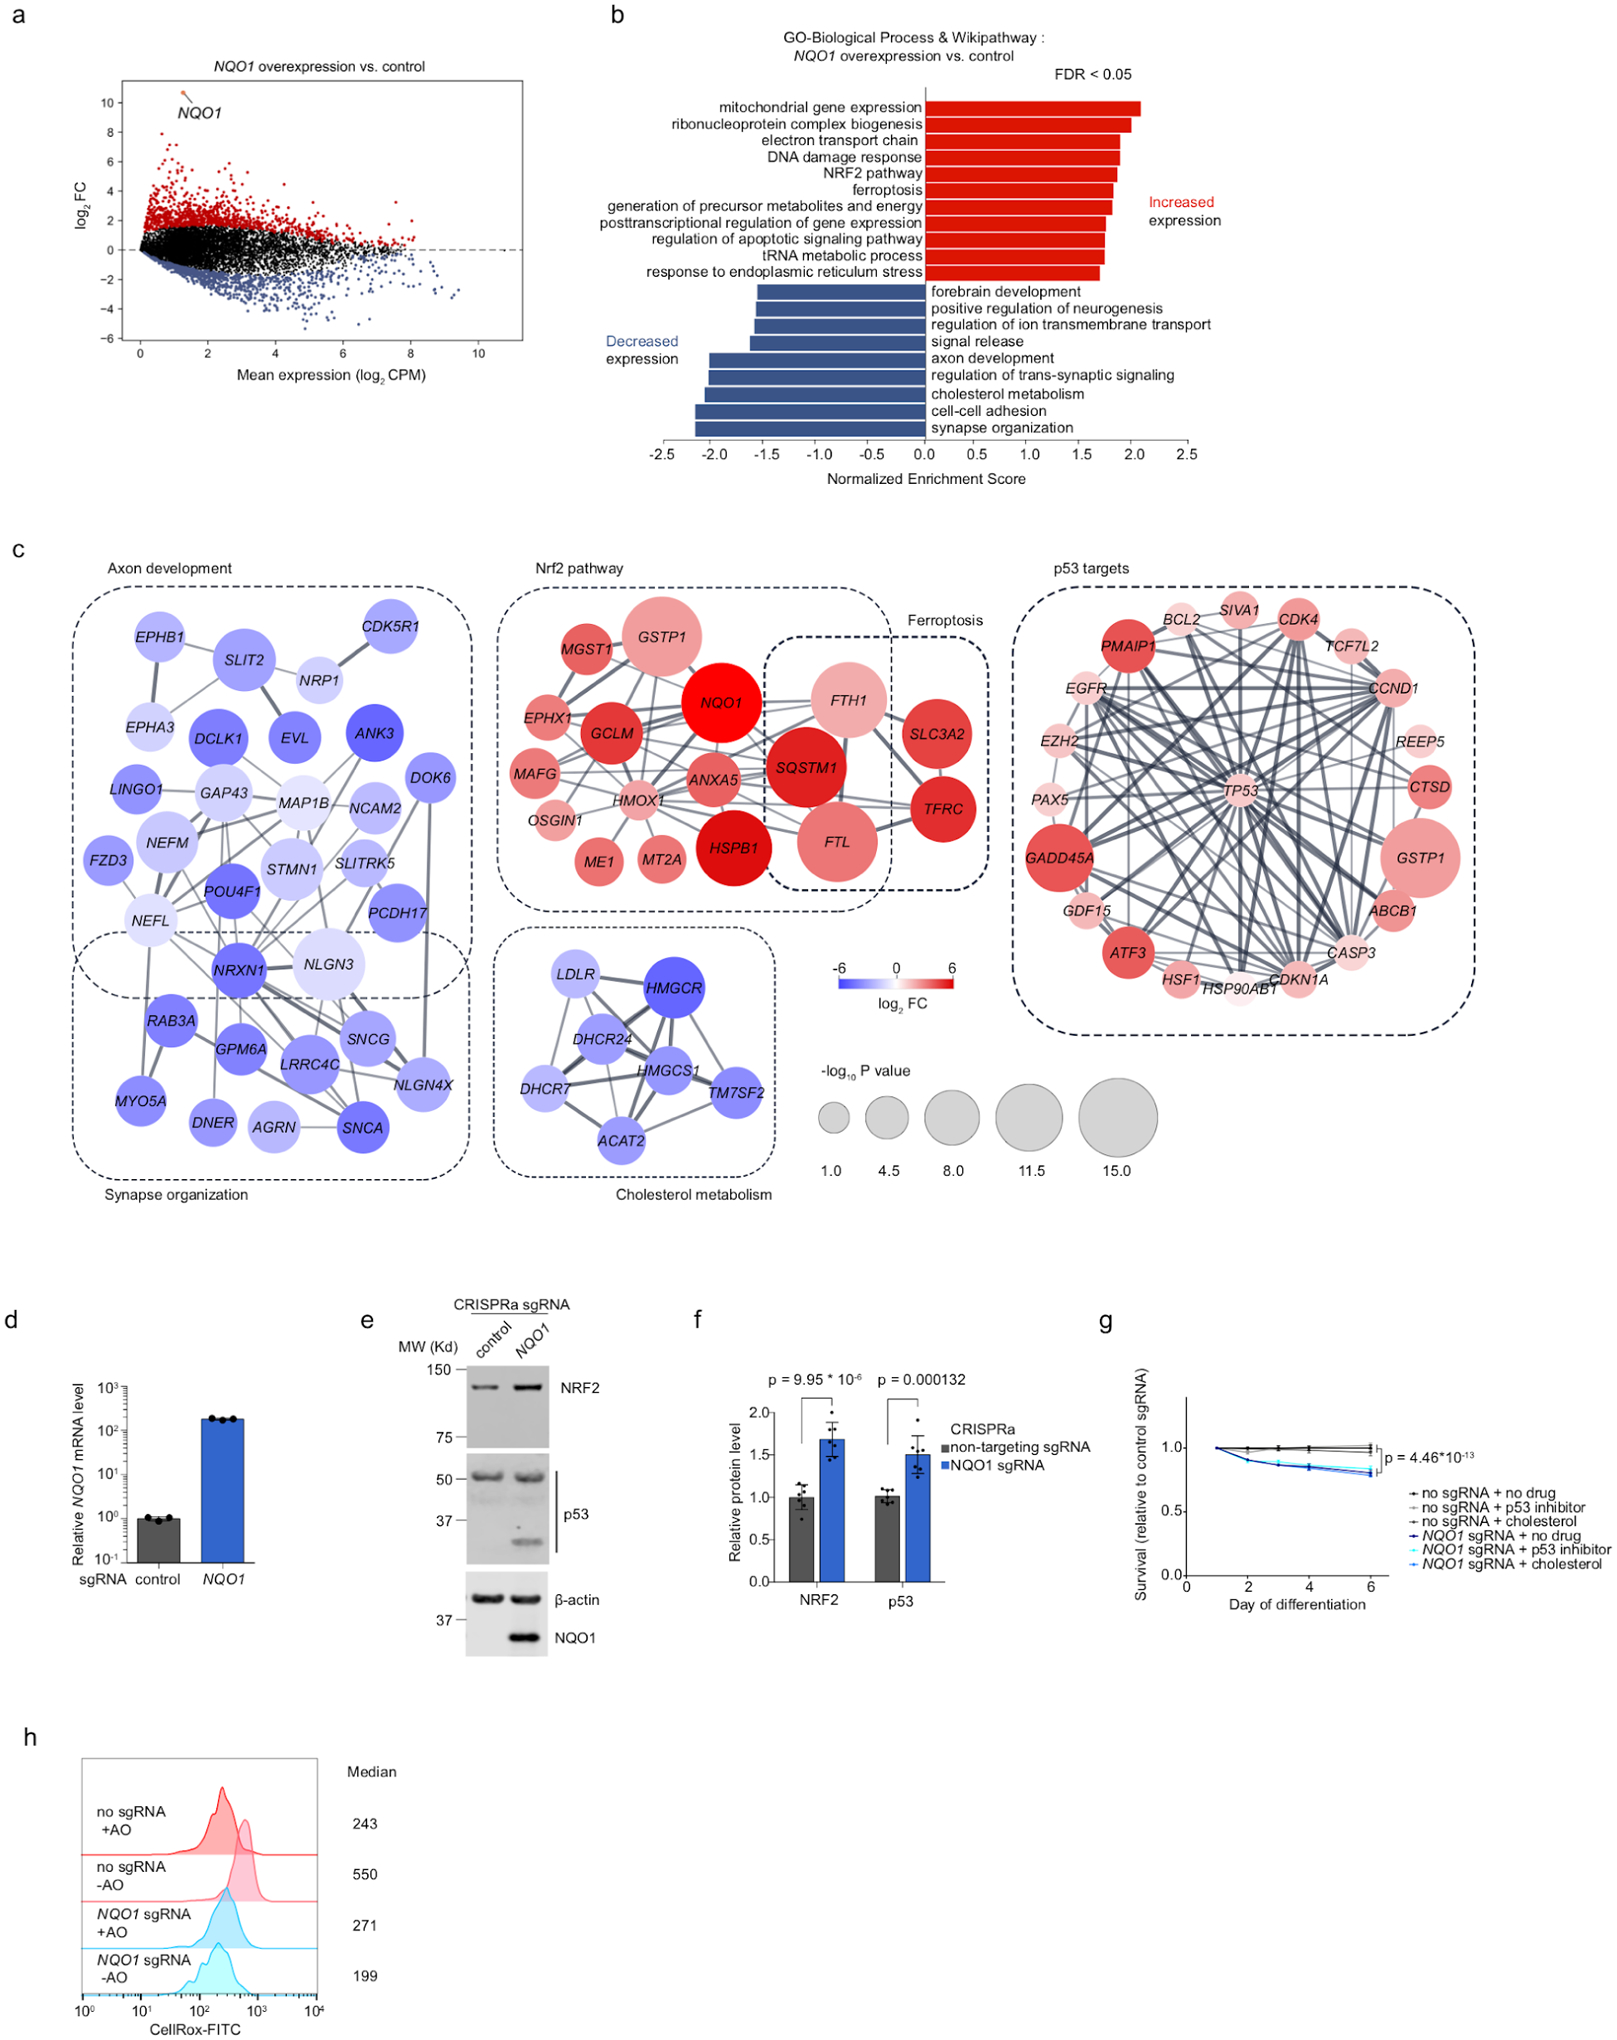
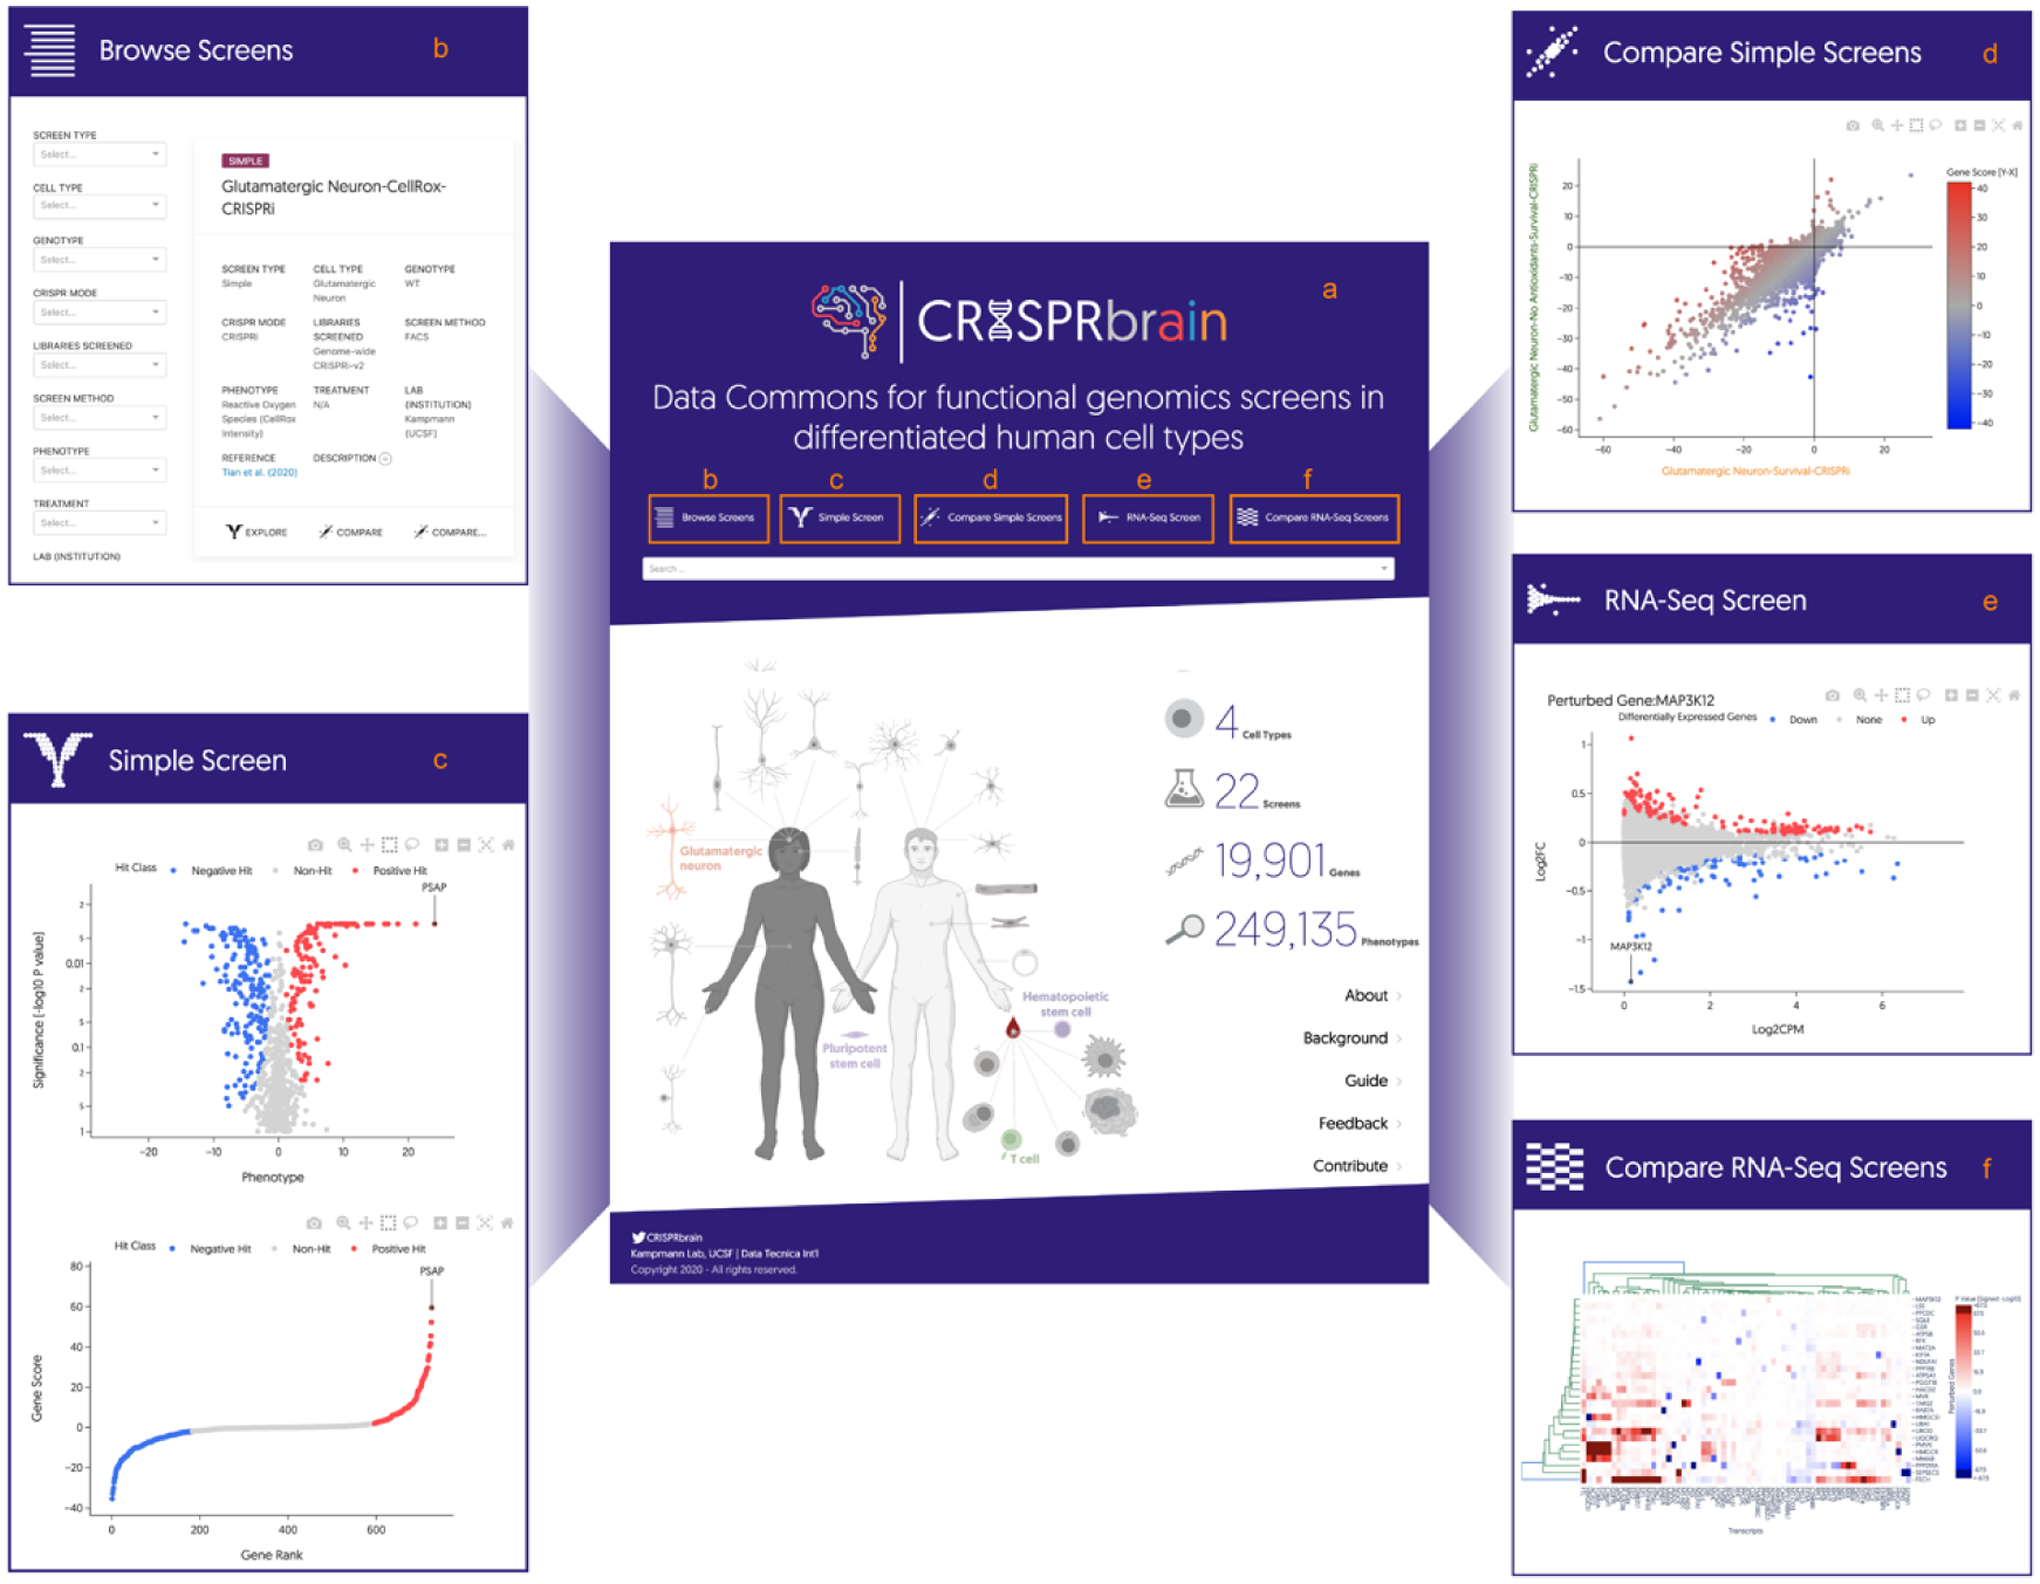
Single-cell transcriptomics provide a systematic map of gene expression in different human cell types. The next challenge is to systematically understand cell-type-specific gene function. The integration of CRISPR-based functional genomics and stem cell technology enables the scalable interrogation of gene function in differentiated human cells. Here we present the first genome-wide CRISPR interference and CRISPR activation screens in human neurons. We uncover pathways controlling neuronal response to chronic oxidative stress, which is implicated in neurodegenerative diseases. Unexpectedly, knockdown of the lysosomal protein prosaposin strongly sensitizes neurons, but not other cell types, to oxidative stress by triggering the formation of lipofuscin, a hallmark of aging, which traps iron, generating reactive oxygen species and triggering ferroptosis. We also determine transcriptomic changes in neurons after perturbation of genes linked to neurodegenerative diseases. To enable the systematic comparison of gene function across different human cell types, we establish a data commons named CRISPRbrain.


Conflict of interest statement

Declaration of interests

M.K. has filed a patent application related to CRISPRi and CRISPRa screening (PCT/US15/40449) and serves on the Scientific Advisory Board of Engine Biosciences, Casma Therapeutics, and Cajal Neuroscience.

Figures

Extended Data Fig. 1:
Extended Data Fig. 1:. Karyotyping of the monoclonal CRISPRa-iPSC line, and analysis of CRISPRi and CRISPRa hits
(a) A normal karyotype was confirmed for the monoclonal CRISPRa-iPSC line. (b,c) Comparison of CRISPRi (b) and CRISPRa (c) efficacy in iPSCs and iPSC-derived neurons. The relative mRNA level of each targeted gene was calculated as the ratio of its expression in cells expressing a targeting sgRNA as compared to a non-targeting control sgRNA measured by qPCR (mean +/s sd, n = 3 technical replicates). The housekeeping gene ACTB was used for normalization. (d,e) Top, heatmaps showing phenotype scores (Log2-fold change) of all 5 sgRNAs (x-axis) targeting each hit gene (y-axis) from the primary CRISPRi (left) and CRISPRa (right) survival screens. The five sgRNAs targeting a given gene are ranked by the significance of their P values and are shown from left to right. Bottom, bar graphs summarizing the percentage of hit genes that have a certain number of sgRNAs (x-axis) showing a significant phenotype (false discovery rate (FDR) < 0.1) in CRISPRi (left) and CRISPRa (right) survival screens. (f,g) Scatter plots showing the relationship between Gene Score and gene coding sequence (CDS) length (left) or gene length (right) for genome-wide CRISPRi (f) and CRISPRa (g) survival screens. (h, i) Top: Venn diagrams comparing CRISPRi (h) and CRISPRa (i) screen results for neuronal survival from this paper with other published survival screens for different human cell types. For CRISPRi, hit genes with toxic phenotypes for the survival of neurons were compared with those for cancer cells (‘gold-standard’ essential genes ) and pluripotent stem cells (genes that were identified as essential in more than one studies were retained for comparison). Protective hits for the survival of neurons were compared with those for human pluripotent stem cells, (genes that were identified as essential in both studies were retained for comparison). For CRISPRa, hits were compared with our published survival screen in K562 cells reanalyzed using our MAGeCK-iNC pipeline. Bottom: Gene Ontology (GO) term enrichment analysis was conducted for hits resulting in increased survival (red) or decreased survival (blue); terms are shown up to an FDR of 0.05. (j) Neuronal expression levels of neuron-specific hit genes and other hit genes from CRISPRi (top) and CRISPRa (bottom) screens are shown, binned by order of magnitude.
Extended Data Fig. 2:
Extended Data Fig. 2:. Comparing CRISPRa survival screens in +AO and -AO conditions
Each dot represents one gene, and its Gene Score in the +AO screen was plotted on the x-axis and Gene Score in the -AO screen on the y-axis. The Pearson correlation coefficient is shown.
Extended Data Fig. 3:
Extended Data Fig. 3:. Characterization of PSAP KO in other cell types
(a) qPCR validation of PSAP knockdown in neural progenitor cells (left), astrocytes (middle) and microglia (right) diffentiated from CRISPRi iPSCs expression a PSAP sgRNA as compared to a non-targeting control sgRNA (mean +/s sd, n = 3 technical replicates). The housekeeping gene ACTB was used for normalization. (b) Representative fluorescence microscopy images for neural progenitor cells (left), astrocytes (middle) and microglia (right) diffentiated from CRISPRi iPSCs expression a non-targeting sgRNA or a PSAP sgRNA, stained with LAMP2 and LC3B antibodies. DRAQ5 was used for nuclear staining. Scale bar, 10 μm.
Extended Data Fig. 4.
Extended Data Fig. 4.. Examples of the CROP-seq classification method, and shared transcriptomic signatures of VPS54, PAXIP1, and PON2 knockdown in human iPSC-derived neurons
(a,b) CROP-seq examples showing the application of the outlier detection-based classification method in cases where two sgRNAs targeting the same gene had heterogeneous efficacy (a, SOX5 in CRISPRa) or the expression level of the target gene was too low to quantify knockdown level (b, ZNF592 in CRISPRi). (c) Transcriptomic changes induced by knockdown of VPS54 (left), PAXIP1 (middle), and PON2 (right) in neurons. For each perturbation, the top 200 upregulated and downregulated genes compared to control (i.e. unperturbed cells) are shown in red and blue, respectively. Within this set, shared genes among all three perturbations are highlighted in green.
Fig. 1:
Fig. 1:. Genome-wide CRISPRi and CRISPRa screens in human iPSC-derived neurons identify regulators of neuronal survival
(a) Strategy for generating the CRISPRa iPSC line: an inducible CRISPRa construct, CAG promoter-driven DHFR-dCas9-VPH, was stably integrated into the CLYBL safe harbor locus through TALEN-mediated knock-in. dCas9, catalytically dead Cas9. VPH, activator domains containing 4X repeats of VP48, P65, and HSF1. (b) Functional validation of CRISPRa activity. qPCR quantification of the relative fold change of CXCR4 mRNA levels in CRISPRa-neurons expressing a CXCR4 sgRNA as compared to a non-targeting control sgRNA in the presence or absence of trimethoprim (TMP), which stabilizes the DHFR degron (mean +/− sd, n = 3 technical replicates). CXCR4 levels were normalized to the housekeeping gene ACTB. (c) Strategy for neuronal survival screens. CRISPRi/a iPSCs were transduced with genome-wide sgRNA libraries, containing ~100,000 sgRNAs targeting ~19,000 protein-coding genes and ~1,800 non-targeting control sgRNAs. TMP was added to CRISPRa neurons from Day 0 to induce CRISPRa activity. Frequencies of cells expressing a given sgRNA were determined by next-generation sequencing for Day 10 neurons and Day −3 iPSCs. (d) Volcano plots summarizing knockdown or overexpression phenotypes and statistical significance (Mann-Whitney U test) for genes targeted in the CRISPRi (left) and CRISPRa (right) screens. Dashed lines: False-discovery rate (FDR) cutoff for hit genes (FDR = 0.05) based on the Gene Score, see main text and Methods) (e) Comparing Gene Scores for hits from CRISPRi and CRISPRa screens. Hit genes with protective or toxic phenotypes in either screen are shown in red or blue, respectively. Genes that are hits in both screens are shown in orange. (f) Gene Ontology (GO) term enrichment analysis for the top 100 hit genes with protective or toxic phenotypes in CRISPRi (left) and CRISPRa (right) survival screens. Significantly enriched Biological Process terms (FDR < 0.01) are shown. (g) Expression levels of hit genes and non-hit genes from CRISPRi (left) or CRISPRa (right) screens are shown, binned by order of magnitude. (h) Percentage of hits with paralogs in CRISPRi and CRISPRa survival screens. A list of human paralog genes was obtained from a previous study. P value was calculated using Fisher’s exact test. (i) Comparison of Gene Scores from survival screens in neurons derived from two different CRISPRi-iPSC lines, WTc11 (x-axis) and NCRM5 (y-axis), using a custom sgRNA library targeting 2,131 hit genes from the primary CRISPRi screen in WTc11. The Pearson correlation coefficient (r) is indicated. (j) Pairwise Pearson correlation of Gene Scores between biological replicates of survival screens in neurons derived from WTc11 and NCRM5 lines.
Fig. 2:
Fig. 2:. Genome-wide CRISPRi and CRISPRa screens in human iPSC-derived neurons identify regulators of oxidative stress survival and redox homeostasis
(a) Screening strategy. First, survival-based screens were conducted to identify modifiers of neuronal survival under mild oxidative stress induced by anti-oxidant (AO) removal from the neuronal medium (-AO). Second, FACS-based screens were conducted for modifiers of reactive oxygen species (ROS) and lipid peroxidation levels. Last, secondary screens for lysosomal status and labile iron levels were conducted to further characterize hit genes. (b) Comparison of Gene Scores in +AO and -AO conditions for ~19,000 protein-coding genes targeted in genome-wide CRISPRi survival screens. See main text and Methods for the definition of the Gene score. (c) Pathway for selenocysteine incorporation into GPX4. Hit genes are highlighted in orange. (d) Ranked Gene Scores from the ROS screen and the lipid peroxidation screen. High-signal hits are shown in red and low signal hits in blue. Genes discussed in the paper are highlighted in orange. (e) GO term enrichment analysis for the top 100 high-signal and low-signal hits in the ROS screen (left) and the lipid peroxidation screen (right). Significantly enriched Biological Process terms (false discovery rate (FDR) < 0.01) are shown. (f) Gene Scores from the lysosome and iron secondary screens targeting 730 genes selected from the primary genome-wide screens. Genes are color-coded by pathways based on Gene Ontology (GO) annotation. (g) Heatmap showing Gene Scores across screens (rows) for genes that are among the top 20 high-signal or low-signal hits in at least one screen (columns). Rows and columns are hierarchically clustered. Genes are color-coded by pathways based on GO annotation.
Fig. 3:
Fig. 3:. Loss of prosaposin induces ROS and lipid peroxidation in neurons and causes neuronal ferroptosis in the absence of antioxidants
(a) Prosaposin is processed in the lysosome by cathepsin D (encoded by CTSD) into saposin subunits, which function together with GM2A as activators for glycosphingolipid degradation. (b) Results from the reactive oxygen species (ROS) and lipid peroxidation screens (Fig. 2), highlighting PSAP and the related genes CTSD and GM2A. (c) Western blot showing the depletion of prosaposin in the PSAP knockout (KO) iPSC line. (d) Representative immunofluorescence microscopy images showing the loss of prosaposin in PSAP KO neurons. WT and PSAP KO neurons were fixed and stained by antibodies against prosaposin (shown in green) and the neuronal marker Tuj1 (shown in purple). Nuclei were counterstained by Hoechst, shown in blue. Scale bars, 20 μm. (e) ROS levels (as indicated by CellRox) and lipid peroxidation levels (as indicated by Liperfluo and C11-BODIPY) in WT and PSAP KO neurons, measured by flow cytometry. (f) ROS levels in iPSCs ,HEK293 cells, neural progenitor cells, astrocytes and microglia in WT and PSAP KO backgrounds (PSAP KO for iPSCs and PSAP knockdown by CRISPRi in the other cell types), measured by CellRox via flow cytometry. (g) Lipid peroxidation levels (as indicated by Liperfluo) in WT and PSAP knockdown neural progenitor cells and astrocytes, measured by flow cytometry. (h) Survival curves for WT and PSAP KO neurons cultured in normal neuronal medium (+AO) or medium lack of antioxidants (-AO), quantified by imaging using Hoechst stain (all cells) and propidium iodide (PI) (dead cells). Survival fraction is calculated as (total cell count - dead cell count) / total cell count. Data is shown as mean +/− sd, n = 4 culture wells per group. 16 imaging fields were averaged for each well. (i) Survival fractions of WT and PSAP KO neurons treated with different cell death inhibitors under +AO or -AO conditions, quantified by imaging in the same way as for G. Data is shown as mean +/− sd, n = 16 imaging fields per group. (j) Representative images for the Hoechst (shown in blue) and propidium iodide (PI, shown in red) staining in h. Scale bars, 50 μm.
Fig. 4:
Fig. 4:. Loss of prosaposin disrupts glycosphingolipid degradation specifically in neurons but not other cell types, and leads to cholesterol accumulation
(a) Untargeted lipidomics comparing abundances of different lipid species in wild-type (WT) and PSAP knockout (KO) neurons. P values were calculated using two-sided Student’s t-test (n = 3 replicates per group). Dashed line, P value cutoff for false-discovery rate (FDR) < 0.01. Glycosphingolipids are shown in orange and ether lipids in green. (b) Heatmap showing the abundances of significantly increased or decreased lipids in PSAP KO neurons as compared to WT (FDR < 0.01). Enrichment P values for glycosphingolipids and ether lipids were calculated using Fisher’s exact test. Lipid abundances were Z score-normalized across samples. (c) Representative immunofluorescence microscopy images for WT and PSAP KO neurons stained with LAMP2 antibodies (shown in green) and GM1 antibodies (shown in red). Nuclei were counterstained by Hoechst, shown in blue. Scale bar, 10 μm. (d-f) Representative fluorescence microscopy images for neural progenitor cells (d), astrocytes (e) and microglia (f) diffentiated from CRISPRi iPSCs expression a non-targeting sgRNA or a PSAP sgRNA, stained with PSAP (left) and GM1 (right) antibodies. DRAQ5 was used for nuclear staining. Nestin, S100β and GPR34 antibodies were used as markers for neural progenitor cells, astrocytes and microglia, respectively. Scale bar, 10 μm. (g) Representative immunofluorescence microscopy images for WT and PSAP KO iPSCs stained with GM1 antibodies (shown in red). Nuclei were counterstained by Hoechst, shown in blue. Scale bar, 20 μm (h) Gene expression changes in PSAP KO neurons as compared to WT. Genes that are significantly upregulated and downregulated in PSAP KO neurons are shown in red and blue, respectively (false-discovery rate (FDR) < 0.05). The top 50 up- and down-regulated genes are labeled, and within this set, genes involved in the cholesterol biosynthesis pathway are highlighted in orange. (i) Gene ontology (GO) term enrichment analysis for significantly up- and down-regulated genes (FDR < 0.05) in PSAP KO neurons. Significantly enriched Biological Process terms are shown (FDR < 0.01). (j) Cholesterol levels measured by flow cytometry in filipin-stained WT and PSAP KO neurons cultured in the presence or absence of antioxidants (in +AO and -AO conditions). (k) Representative fluorescence microscopy images of WT and PSAP KO neurons stained with filipin (shown in cyan) and LAMP2 antibodies (shown for PSAP KO neurons, in red). Scale bar, 10 μm.
Fig. 5:
Fig. 5:. Impaired lipid degradation in PSAP KO neurons leads to lipofuscin formation, iron accumulation and impaired autophagy
(a) Lysotracker signals measured by flow cytometry in WT and PSAP KO neurons (b) Lysotracker signals measured by flow cytometry in iPSCs, HEK293 cells, neural progenitor cells, astrocytes and microglia (left to right) in WT and PSAP KO or knockdown backgrounds ( PSAP KO for iPSCs and PSAP knockdown by CRISPRi in the other cell types) (c) Two-color STORM super-resolution images of PSAP KO neurons immunolabeled for LAMP2 (shown in green) and GM1 (shown in magenta). Scale bars, 2 μm. (d) Electron microscopy images for WT and PSAP KO neurons. The red arrow points to a representative lipofuscin structure. Scale bar, 1 μm. (e) Representative images for autofluorescence in WT and PSAP KO neurons. Excitation, UV (405 nm). Emission, FITC (525/20 nm). Scale bar, 10 μm. (f) Labile iron levels in WT and PSAP KO neurons. Neurons were stained with the iron indicators FeRhoNox-1 (left) or FerroOrange (right) and fluorescence was measured by flow cytometry. (g) Labile iron levels (as indicated by FeRhoNox-1) in WT and PSAP knockdown neural progenitor cells, astrocytes and microglia (left to right), measured by flow cytometry. (h) Labile iron levels in WT and PSAP KO neurons with or without DFO treatment. Cells were stained by FeRhoNox-1 and fluorescence was quantified by flow cytometry. Median signal intensities are indicated. (i) Labile iron levels in WT neurons, PSAP KO neurons, and PSAP KO neurons with DFO treatment. Cells were stained by Calcein and fluorescence was quantified by flow cytometry. Median signal intensities are indicated. (j) Representative fluorescence microscopy images for WT neurons, PSAP KO neurons, and PSAP KO neurons treated with 10 μM DFO for 3 days, stained with Lysotracker (shown in green) and FeRhoNox-1 (shown in red). Nuclei were counterstained by Hoechst, shown in blue. Scale bar, 10 μm. (k) Representative fluorescence microscopy images for WT and PSAP KO neurons under the -AO condition stained with Lysotracker (shown in green) and Liperfluo (shown in red). Nuclei were counterstained by Hoechst, shown in blue. Scale bar, 10 μm. (l) Western blot showing protein levels of phosphatidylethanolamine (PE)-conjugated LC3B (LC3B-II) and unconjugated LC3B (LC3B-I) in WT and PSAP KO neurons in the absence or presence of Bafilomycin A1 (BafA1). β-Actin was used as a loading control. Ratios of LC3B-II to LC3B-I are indicated at the bottom. (m) Quantification of LC3B-II / LC3B-I ratios for WT and PSAP KO neurons (mean +/− sd, n = 6 independent experiments). P value was calculated using Student’s t-test. (n) Representative immunofluorescence microscopy images for WT and PSAP KO neurons, stained with LC3B antibodies (shown in red). Nuclei were counterstained by Hoechst, shown in blue. Scale bar, 20 μm. (o) A model for the mechanism linking prosaposin loss to neuronal ferroptosis. Loss of saposins blocks glycosphingolipid degradation in the lysosome. The build-up of glycosphingolipids leads to lipofuscin formation, which accumulates iron and generates reactive oxygen species (ROS) through the Fenton reaction. ROS then peroxidize lipids and cause neuronal ferroptosis in the absence of antioxidants. Other consequences are cholesterol accumulation and impaired autophagy.
Fig. 6:
Fig. 6:. CROP-seq reveals transcriptomic responses to perturbations of neurodegenerative disease-associated genes in human iPSC-derived neurons
(a) Hit genes from our screens that are also associated with neurodegenerative diseases were targeted in a CROP-seq screen to detect their knockdown or overexpression effects on gene expression at single-cell resolution in human iPSC-derived neurons. (b) Summary of on-target knockdown by CRISPRi (top) or overexpression by CRISPRa (bottom) for all target genes in the CROP-seq libraries. log2FC represents the log2-fold change of the mean expression of a target gene in perturbed cells (i.e. cells expressing sgRNAs targeting that gene) compared to unperturbed cells (i.e. cells expressing non-targeting control sgRNAs). P values were calculated by the two-sided Wilcoxon rank-sum test. Target genes are ranked by their expression in unperturbed cells. (c,d) Examples of CROP-seq results showing on-target knockdown (TUBB4A in CRISPRi, c) or overexpression (NQO1 in CRISPRa, d) and the classification method, shown in a two-dimensional UMAP projection. (e) Pairwise similarities of differentially expressed genes among perturbations. Similarity scores were determined by the OrderedList package in R (see Methods). Genes in clusters with high similarity are labeled. (f,g) Eigengene expression of gene modules identified from Weighted correlation network analysis (WGCNA) in cells containing different perturbations relative to unperturbed cells (f). Enriched pathways in each module are shown in g.
Fig. 7:
Fig. 7:. Overexpression of NQO1 induces unexpected transcriptome changes in human iPSC-derived neurons that provide hypotheses for its toxicity
(a) Transcriptomic changes induced by NQO1 overexpression in neurons. Significantly upregulated or downregulated genes (FDR < 0.01) are shown in red or blue, respectively. (b) Pathway analysis showing enriched pathways in upregulated and downregulated genes in NQO1-overexpressing neurons. (c) String-db association networks of selected pathways enriched in upregulated and downregulated genes. Genes with stronger associations are connected by thicker lines. Colors and sizes of nodes reflect log2-fold changes (log2FCs) and significance (-log10P) of differentially expressed genes, respectively. (d) NQO1 overexpression by CRISPRa. qPCR quantification of the relative fold change of NQO1 mRNA levels in CRISPRa-neurons expressing a NQO1 sgRNA as compared to a non-targeting control sgRNA in the presence TMP (mean +/− sd, n = 3 technical replicates). NQO1 levels were normalized to the housekeeping gene ACTB. (e) Western blot showing protein levels of NRF2, p53 and NQO1 in CRISPRa-neurons expressing a NQO1 or non-targeting control sgRNA. β-actin was used as a loading control. (f) Quantification of NRF2 and p53 levels for CRISPRa-neurons expressing a NQO1 or non-targeting control sgRNA (mean +/− sd, n = 7 independent experiments). P value was calculated using Student’s t-test. (g) Survival of CRISPRa neurons expressing the NQO1 sgRNA relative to non-targeting control sgRNA, quantified by longitudinal imaging for number of BFP+ (sgRNA+) cells on Days 1,2,3,4 and 6 of differentiation. Cells were cultured in the presence of vehicle, 10 μM p53 inhibitor Pifithrin-α hydrobromide or 10 μg/ml cholesterol. Mean +/− sd of 10 replicate wells for each condition at each data point is shown. 4 imaging fields at 20X were taken for each well. P value was calculated using Student’s t-test. (h) ROS levels in CRISPRa-neurons expressing a NQO1 or non-targeting control sgRNA in +AO and -AO conditions, measured by CellRox via flow cytometry. Median signal intensities are indicated.
Fig. 8:
Fig. 8:. CRISPRbrain, a Data Commons for functional genomics screens in differentiated human cell types.
(a) CRISPRbrain (https://crisprbrain.org) is a Data Commons organizing results from genetic screens for different phenotypes in different human cell types, by different research groups. (b) Screens can be browsed and searched based on a range of parameters, and full text search. (c,d) Survival- and FACS-based screens (“simple screens”) can be visualized and explored interactively, and compared pairwise. (e,f) RNA-Seq-based screens can be explored one perturbed gene at a time as MA plots (e), or globally in a hierarchically clustered heatmap (f).

Comment in

References

    1. Regev A et al. The human cell atlas. elife 6, (2017). - PMC - PubMed
    1. Tazir M, Hamadouche T, Nouioua S, Mathis S & Vallat J-M Hereditary motor and sensory neuropathies or Charcot-Marie-Tooth diseases: an update. J. Neurol. Sci 347, 14–22 (2014). - PubMed
    1. Tian R et al. CRISPR Interference-Based Platform for Multimodal Genetic Screens in Human iPSC-Derived Neurons. Neuron 104, 239–255.e12 (2019). - PMC - PubMed
    1. Gilbert LA et al. Genome-scale CRISPR-mediated control of gene repression and activation. Cell 159, 647–661 (2014). - PMC - PubMed
    1. Kampmann M CRISPR-based functional genomics for neurological disease. Nat. Rev. Neurol 16, 465–480 (2020). - PMC - PubMed

Publication types

MeSH terms