

Endospore Appendages: a novel pilus superfamily from the endospores of pathogenic Bacilli
- PMID: 34031903
- PMCID: PMC8408608
- DOI: 10.15252/embj.2020106887
Endospore Appendages: a novel pilus superfamily from the endospores of pathogenic Bacilli
Abstract
Bacillus cereus sensu lato is a group of Gram-positive endospore-forming bacteria with high ecological diversity. Their endospores are decorated with micrometer-long appendages of unknown identity and function. Here, we isolate endospore appendages (Enas) from the food poisoning outbreak strain B. cereus NVH 0075-95 and find proteinaceous fibers of two main morphologies: S- and L-Ena. By using cryoEM and 3D helical reconstruction of S-Enas, we show these to represent a novel class of Gram-positive pili. S-Enas consist of single domain subunits with jellyroll topology that are laterally stacked by β-sheet augmentation. S-Enas are longitudinally stabilized by disulfide bonding through N-terminal connector peptides that bridge the helical turns. Together, this results in flexible pili that are highly resistant to heat, drought, and chemical damage. Phylogenomic analysis reveals a ubiquitous presence of the ena-gene cluster in the B. cereus group, which include species of clinical, environmental, and food importance. We propose Enas to represent a new class of pili specifically adapted to the harsh conditions encountered by bacterial spores.
Keywords: Bacillus; Endospore; pilus; protein nanofiber; self-assembly.
© 2021 The Authors.
Conflict of interest statement
BP, MS, MA, and HR are named as inventor on a priority filing related to the production and use of recombinant Ena fibers.
Figures
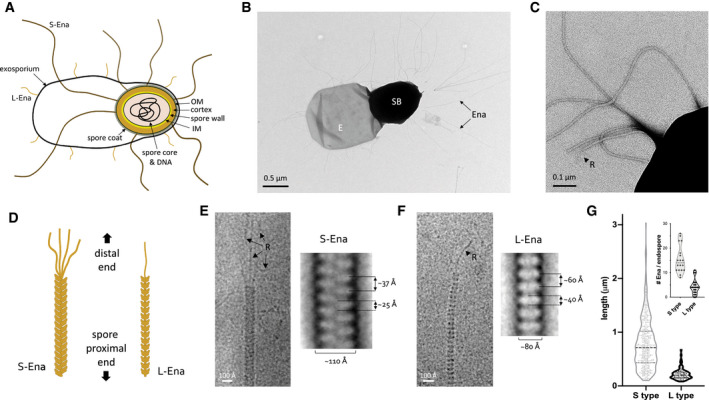
- A
Schematic representation of the B. cereus endospore. IM: inner membrane, OM: outer membrane. Together, spore core, IM, spore wall, cortex, OM, and spore coat make the spore body, surrounded by the exosporium. S‐ and L‐Ena represent staggered and ladder type endospore appendages – see this study.
- B, C
Negative stain TEM image of B. cereus NVH 0075‐95 endospore, showing spore body (SB), exosporium (E), and endospore appendages (Ena), which emerge from the endospore individually or as fiber bundles. At the distal end, Enas terminate in a single or multiple thin ruffles (R).
- D
Schematic drawing of S‐ and L‐Ena appearance and their orientation relative to the spore.
- E, F
cryoEM images (left) and negative stain 2D class averages of single S‐Ena (E) and L‐Ena (F) fibers. S‐Ena shows ˜100 Å diameter and a helical or staggered appearance with a ˜37 Å rise, whereas L‐Ena has a ˜80 Å diameter and appear as stacked disks of ˜40 Å height and ˜60 Å translation along the fiber. L‐ and S‐Ena show, respectively, a single or multiple ruffle(s) (black arrow, labeled “R”) at the distal end of fiber.
- G
Length distribution of S‐ and L‐Enas and number of Enas per endospore (inset), (n = 1,023 individual Enas, from 150 endospores, from 5 batches). Dashed and dotted lines show median and first (lower) and third (upper) quartile, resp. See also Fig EV1.
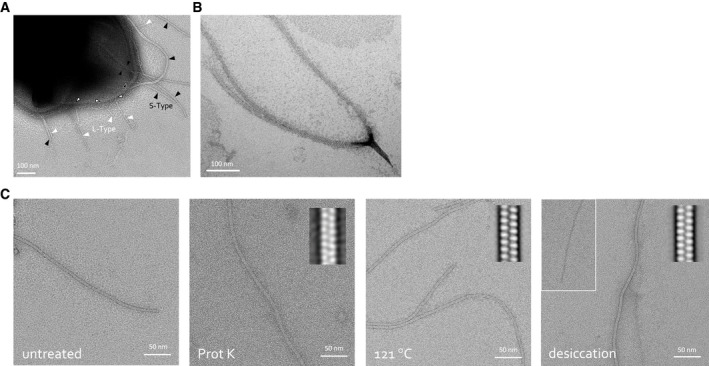
- A, B
Negative stain TEM of B. cereus NVH 0075‐95 endospore with indication of the two Ena morphologies: S‐type (black arrowheads) and L‐Enas (white arrowheads) (A), and closed‐up view of a dislodged S‐Ena bundle splitting into individual Ena fibers (B).
- C
Negative stain TEM images of isolated ex vivo S‐Ena. To test Ena stability under different stresses, samples were treated, from left to right, with: (1) untreated control, (2) 1 h of 1 mg/ml proteinase K, (3) autoclaving (i.e., 20 min at 121°C) or (4) a 4 h of desiccation at 43°C. Inset shows 2D class averages to assess the structural integrity of the treated Ena. S‐Enas are found to be resistant to Proteinase K treatment, autoclaving and desiccation at 43°C, although some fibers appear to lose subunit integrity upon desiccation (inset). Desiccation at 43°C may mimic conditions encountered by Bacillus spores during drought.
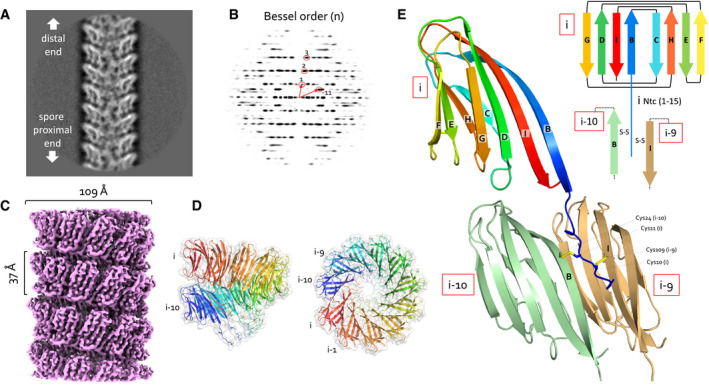
- A, B
(A) Representative 2D class average of 300 × 300 pixel boxes covering ex vivo S‐Enas and (B) the corresponding power spectrum of the 2D class. The Bessel orders used to derive helical symmetry are indicated.
- C
Reconstituted cryoEM electron potential map of ex vivo S‐Ena (3.2 Å resolution).
- D
Side and top view of a single helical turn of the de novo‐built 3D model of S‐Ena shown in ribbon representation and molecular surface. Adjacent Ena subunits are labeled i, i‐1, i‐2 to i‐10 (colored red to blue), where subunits i and i‐10 represent the upper and lower subunit in a single helical turn. Based on the orientation and low‐resolution features of 2D classes obtained on spore‐associated S‐Ena (Fig 1), subunits i and i‐10 would be oriented distal and proximal to the spore body, respectively.
- E
Ribbon representation and topology diagram of the S‐Ena1B subunit (blue to red rainbow from N‐ to C‐terminus). The eight β‐strands making up the S‐Ena core domain are labeled B to I from N‐ to C‐terminus. The first 15 residues form an N‐terminal connector (Ntc) that for a subunit i, is in interaction with subunits i‐9 (sand) and i‐10 (green) through disulfide cross‐linking.
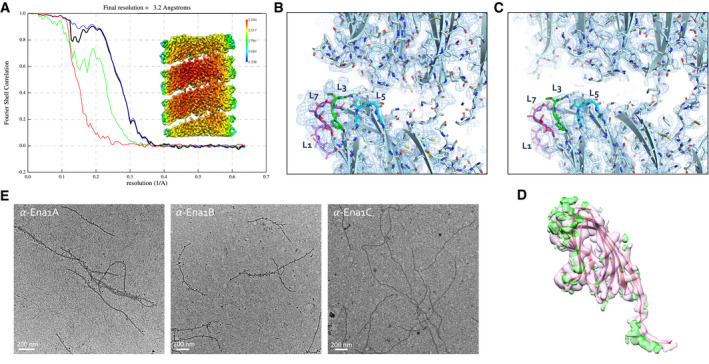
- A
FSC curve and local resolution heatmap (inset) of the recEna1B helical reconstruction, indicating a final resolution of 3.2 Å at a cutoff of 0.143. FSC curve and local resolution were calculated by postprocessing in RELION3.0 using a solvent mask consisting of 3 helical turns.
- B, C
Side‐by‐side comparison of cryoEM maps calculated from ex vivo (B) and recEna1B filaments (C), with the refined Ena1B model docked into the maps. The ex vivo Ena map shows features unaccounted for by the Ena1B model near loops 3 (L3) and 7 (L7), corresponding to regions of amino acid insertions in the Ena1A sequence (Fig EV2B).
- D
recEna1B map (pink) and recEna1B—ex vivo Ena1 difference map (green) masked over a single Ena1B subunit and calculated by TEMPy:Diffmap (Farabella et al, 2015) from the CCPEM package (Burnley et al, 2017). Difference in both maps locates to L3, L7 and the conformation of Ntc.
- E
Immunogold TEM of ex vivo S‐Enas, stained with, from left to right, anti‐Ena1A, anti‐Ena1B, and anti‐Ena1C sera, each with gold‐labeled (10 nm colloidal gold) anti‐rabbit IgG as secondary antibody. Specific staining with Ena1A and Ena1B sera confirms the presence of both subunits in native Enas. No staining was seen with Ena1C serum.
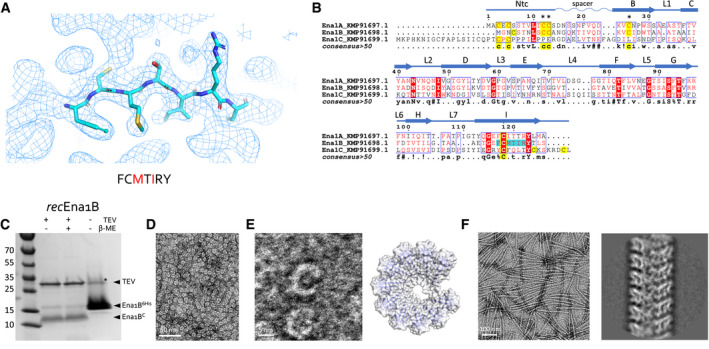
- A
Representative area of the 3D cryoEM potential map for ex vivo S‐Ena, at 3.2 Å resolution. An heptameric peptide with sequence FCMTIRY was deduced de novo from the cryoEM potential map (shown in sticks) and used for a BLAST search of the B. cereus NVH 0075‐95 genome. The red letters indicate amino acids that differ between KMP91697.1 and KMP91698.1 (see B).
- B
Multiple sequence alignment of 3 ORF’s (KMP91697.1, KMP91698.1, and KMP91699.1) corresponding to DUF3992 containing proteins. Sequence motifs corresponding or similar to that deduced from the EM potential map are shaded in cyan. Secondary structure and structural elements as determined from the built model (see Fig 2) are shown schematically above the sequences (Ntc: N‐terminal connecter; arrows correspond to β‐strands, labeled as in Fig 2). Contiguous areas of >50% similarity are boxed blue.
- C
SDS–PAGE of recEna1B, treated with β‐mercaptoethanol or TEV protease (to remove N‐terminal 6xHis tag) as indicated. Bands with apparent MW of ˜13 and ˜15 kDa correspond recEna1B monomer with (Ena1B6His) and without (Ena1BC) the 6xHis tag and TEV recognition site, respectively. In the uncleaved sample, a band running at ˜30 kDa (labeled *) corresponds to a non‐physiological disulfide bound S‐Ena1B dimer. Lower intensity in the cleaved recEna1B results from a loss of monomers to SDS‐resistant high‐molecular‐weight complexes stuck in the stacking gel.
- D
Negative stain TEM images of rec1Ena1B oligomers formed after refolding, but prior to TEV removal of the N‐terminal 6xHis tag.
- E
Close‐up view that shows recEna1B oligomers form open crescents similar in dimensions and shape to single helical turns or arcs found in the S‐Ena fiber (model – right). Steric hindrance by the 6xHis is thought to arrest recEna1B polymerization into single helical arcs.
- F
Negative stain image and 2D classification of S‐Ena‐like fibers formed after TEV digestion of recEna1B. Upon removal of the N‐terminal 6xHis tag, recEna1B readily assembles into fibers with helical properties closely resembling those found for ex vivo S‐Enas.
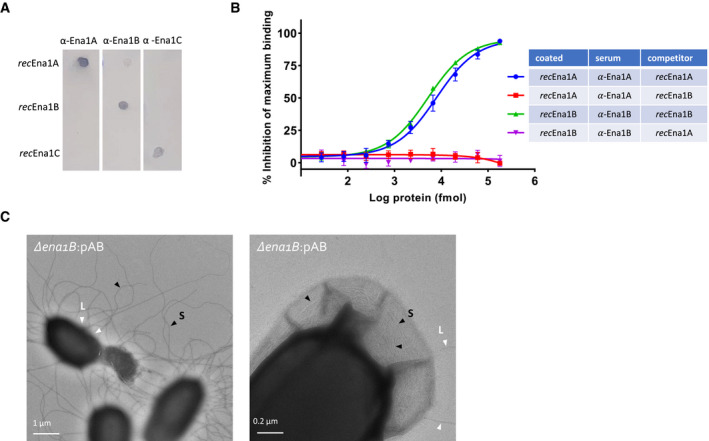
- A
Evaluation of residual cross‐reactivity in anti‐Ena1A, anti‐Ena1B, and anti‐Ena1C sera by dot blot. 100 ng of purified recEna1A, recEna1B, or recEna1C was coated on PVDF membrane, blocked, washed, and probed with the three different anti‐sera at 1:1,000 in TBST. Dot blot shows robust cognate binding with good selectivity against other Ena1 subunits.
- B
Evaluation of residual cross‐reactivity of anti‐Ena1A and anti‐Ena1B sera with recEnaB and recEnaA proteins, respectively, assayed using competitive ELISAs. The percentage inhibition of maximum binding was calculated using the formula (1‐(S‐B))/ (MA‐B) × 100, where S, B, and MA are the average absorbance of the sample (sera + recEna competitor added to the recEna‐coated wells), blank (only PBST added to the recEna‐coated wells), and maximum activity (only sera added to the recEna‐coated wells), respectively. The values presented are the averages of three independent experiments, and error bars depict ±SD of the averages. The lines are regression curves from three‐parameter logistic regression analyses (GraphPad prism version 9).
- C
Negative stain TEM images of endospores of NVH 0075‐95 mutant Δena1B complemented with pena1AB. Complementation with pena1AB results in aberrantly long and numerous S‐Ena (Fig 6). This overexpression of S‐Ena results in the frequent rupture of the exosporium (left panel), or the encapsulated of the S‐Ena into the exosporium (right panel). Selected S‐Ena and L‐Ena are labeled with black and with arrows, and labeled S and L, respectively.
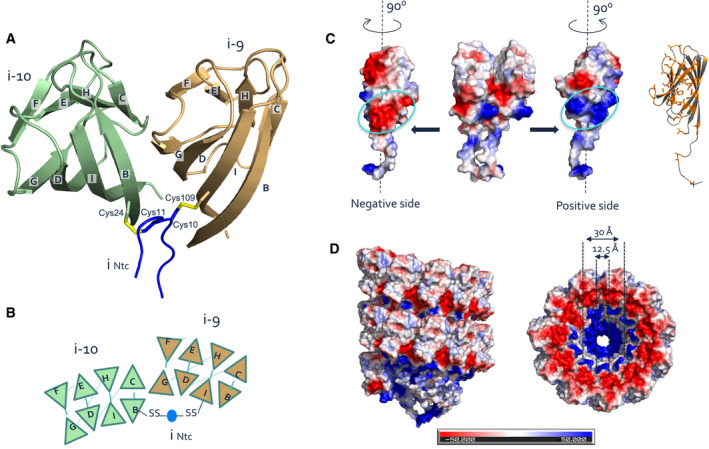
- A, B
Ribbon (A) and schematic (B) representation of lateral subunit–subunit contacts in S‐Ena. Strand G of BIDG sheet of each subunit is augmented with strand C of CHEF β‐sheet of the succeeding subunit. Both subunits are covalently cross‐linked via the Ntc (blue) of a subunit located, respectively, 9 or 10 subunits above. Cys11 and Cys10 go into a disulfide bond with residues 24 in the B strand of subunit i‐10 and Cys109 in strand I of subunit i‐9.
- C, D
Coulomb potential maps (calculated in PyMOL) of two adjacent subunits (C) and two helical turns of the S‐Ena showing the distribution of charge on the atomic model surface. Each subunit possesses complementary positive and negatively charged patches of residues at the inter‐subunit surface that are responsible for electrostatic stabilizing interactions between the subunits. Similarly, stacked helical rings in the S‐Ena show a charge complementary interface (D).
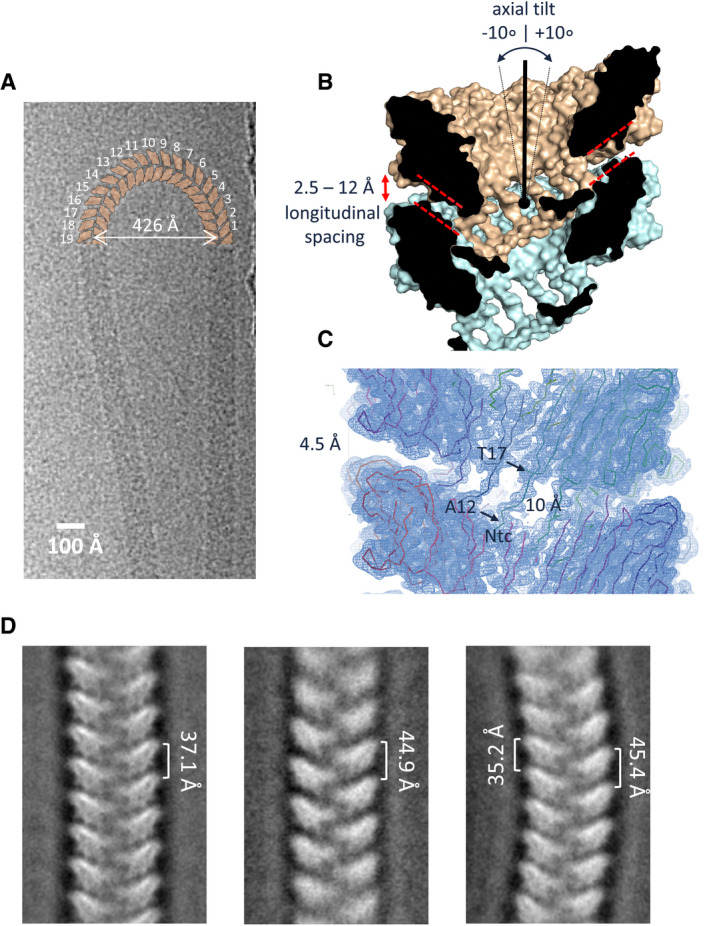
- A
CryoEM image of an isolated ex vivo S‐Ena making a U‐turn comprising 19 helical turns (shown schematically in orange), i.e., corresponding to a ˜10° axial tilt between consecutive helical turns.
- B, C
Cross‐section of the molecular surface of the ex vivo S‐Ena model and the ex vivo S‐Ena 3D cryoEM electron potential map. Model and map reveal a 4.5 Å longitudinal spacing between Ena1B jellyroll domains (red dashed lines) as a result of the 10 Å long Ntc linker (residues 12–17).
- D
Negative stain 2D class averages of endospore‐associated S‐Enas show variation in pitch and axial curvature, likely as a result of strain exerted during deposition of spores on the grid surface. The observed range in pitch corresponds to a range in longitudinal spacing of 2.5 to 12 Å between helical turns (labeled red in panel B).
- A
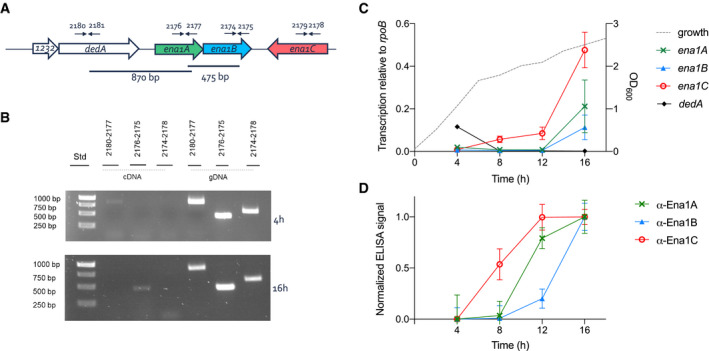
Chromosomal organization of the ena genes and primers used for transcript analysis (arrows).
- B
Agarose gel electrophoresis (1%) analysis of RT–PCR products using indicated primer pairs and cDNA made of mRNA isolated from NVH 0075‐95 after 4 and 16 h of growth in liquid cultures or genomic DNA as control.
- C
Transcription level of ena1A (x), ena1B (▲), ena1C (○), and dedA (♦) relative to rpoB determined by RT–qPCR during 16 h of growth of B. cereus strain NVH 0075‐95. The dotted line represents the bacterial growth measured by increase in OD600. Of note, the transcription of ena1C was surprisingly higher than ena1A and ena1B, the major components of the isolated S‐Ena (Fig EV2).
- D
Expression analysis of Ena1 subunits shown as normalized ELISA signal for α‐Ena1A, α‐Ena1B, or α‐Ena1C serum binding to 2,000 ng total protein of B. cereus strain NVH 0075‐95 cells lysed after 4, 8, 12, or 16 h of growth in sporulation medium.
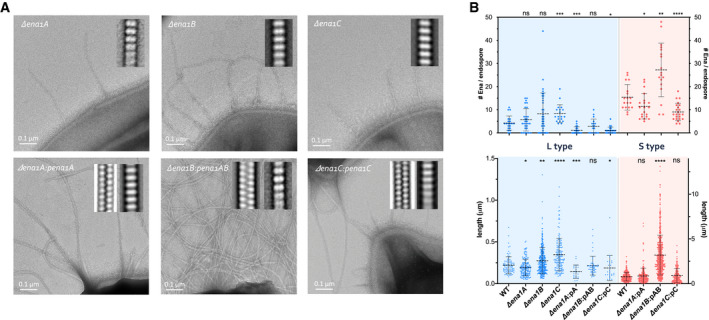
- A
Representative negative stain images of endospores of NVH 0075‐95 mutants lacking ena1A, ena1B, or ena1C, as well as endospores of strains complemented with the respective ena subunit expressed from plasmid (i.e., pA, pAB, and pC). The ena1B mutant was complemented with a plasmid carrying both ena1A and 1B (pAB) due to repeated failure to transform with a plasmid holding ena1B only. Inset are 2D class averages of Enas observed on the respective mutants. Knockout of ena1A, ena1B, or ena1C results in the loss of S‐Ena, a phenotype that is restored by plasmid‐based complementation.
- B
Number (top) and length (bottom) of Enas found on WT, mutant (Δena1A, Δena1B, or Δena1C) and plasmid complemented (Δena1A:pena1A, Δena1B:pena1AB, or Δena1C:pena1C) NVH 0075‐95 endospores. Statistics: pairwise Mann–Whitney U‐tests against WT (n ≥ 18 spores; n ≥ 50 Enas; ns: not significant, *P < 0.05, **P < 0.01, ***P < 0.001 and ****P < 0.0001. —: mean ± s.d.)
- A
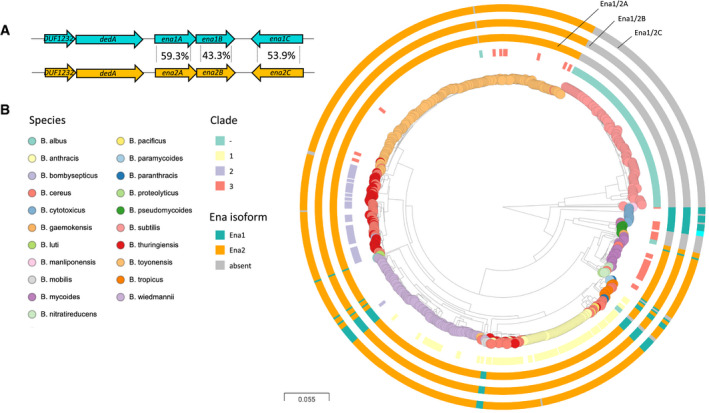
Ena1 and Ena2 loci with average amino acid sequence identity indicated between the population of EnaA‐C ortho‐ and homologs. Ena1C shows considerably more variation and is in B. cytotoxicus different from both Ena1C and Ena2C (see Fig EV5), while other genomes have enaC present at different loci (applies to two isolates of B. mycoides).
- B
Distribution of ena1/2A‐C among Bacillus species. Whole genome clustering of the B. cereus s.l. group and B. subtilis created by Mashtree (Katz et al, ; Ondov et al, 2016) and visualized in Microreact (Argimon et al, 2016). Rooted on B. subtilis. Traits for species (colored nodes), Bazinet clades and presence of ena are indicated on surrounding four rings in the following order from inner to outer: clade according to Bazinet, (when available) (Bazinet, 2017), and presence of enaA, enaB, and enaC, resp. (for all three, ena1: teal, ena2: orange, different locus: cyan). When no homo‐ or ortholog was found, the ring is gray. Interactive tree accessible at:
https://microreact.org/project/vn2oWw7zM3cwejEFNoRGWA/0024f86c .
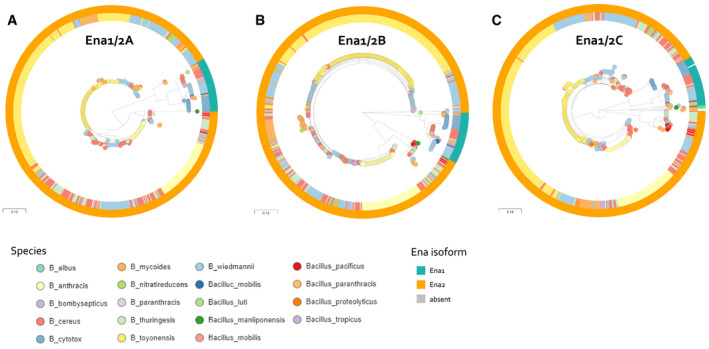
- A
Relationship between Ena1A and Ena2A isoforms of 593 isolates. Ena1A and Ena2A are defined as ortho‐ or homologues having >90% coverage and >80% and 50–65% sequence identity, respectively, with Ena1A_GCF_001044825; KMP91697.1 protein sequence defined in Appendix Table S5. Interactive tree accessible at:
https://microreact.org/project/5UixxEY9vr2AVzXDVwa5t/1a8558fd . - B
Relationship between Ena1B and Ena2B isoforms of 591 isolates. Ena1B, Ena1B_candidate, and Ena2B are defined as ortho‐ or homologues with > 90% coverage and > 80%, 60–80%, and 40–60% sequence identity to Ena1B_NM_Oslo protein sequence defined in Appendix Table S5, respectively. Interactive tree accessible at:
https://microreact.org/project/jJ4pARvqf9gyT916sTar5u/1332f3b3 . - C
Relationship between Ena1C and Ena2C isoforms of 591 isolates. Ena1C, Ena1C_candidate, and Ena2C_candidates are defined as ortho‐ or homologues with > 90% coverage and > 80%, 60–80%, and 40–60% sequence identity to Ena1C_NM_Oslo protein sequence defined in Appendix Table S5, respectively. Furthermore, isolates in which an ortho‐ or homologue was found elsewhere in the genome than the usual EnaA‐B locus are colored cyan. Isolates that lacked an Ena1C homo‐ or orthologue are colored gray. Interactive tree accessible at:
https://microreact.org/project/aQaqCUCJoj2mw55KQujbGY/099d7885 .
References
-
- Altschul SF, Gish W, Miller W, Myers EW, Lipman DJ (1990) Basic local alignment search tool. J Mol Biol 215: 403–410 - PubMed
Publication types
MeSH terms
Substances
LinkOut - more resources
Full Text Sources
Other Literature Sources
Molecular Biology Databases
