

Phospho-regulation, nucleotide binding and ion access control in potassium-chloride cotransporters
- PMID: 34031912
- PMCID: PMC8280820
- DOI: 10.15252/embj.2020107294
Phospho-regulation, nucleotide binding and ion access control in potassium-chloride cotransporters
Abstract
Potassium-coupled chloride transporters (KCCs) play crucial roles in regulating cell volume and intracellular chloride concentration. They are characteristically inhibited under isotonic conditions via phospho-regulatory sites located within the cytoplasmic termini. Decreased inhibitory phosphorylation in response to hypotonic cell swelling stimulates transport activity, and dysfunction of this regulatory process has been associated with various human diseases. Here, we present cryo-EM structures of human KCC3b and KCC1, revealing structural determinants for phospho-regulation in both N- and C-termini. We show that phospho-mimetic KCC3b is arrested in an inward-facing state in which intracellular ion access is blocked by extensive contacts with the N-terminus. In another mutant with increased isotonic transport activity, KCC1Δ19, this interdomain interaction is absent, likely due to a unique phospho-regulatory site in the KCC1 N-terminus. Furthermore, we map additional phosphorylation sites as well as a previously unknown ATP/ADP-binding pocket in the large C-terminal domain and show enhanced thermal stabilization of other CCCs by adenine nucleotides. These findings provide fundamentally new insights into the complex regulation of KCCs and may unlock innovative strategies for drug development.
Keywords: HDX-MS; nucleotide binding; phospho-regulation; potassium-chloride co-transport; solute carrier.
© 2021 The Authors. Published under the terms of the CC BY 4.0 license.
Conflict of interest statement
The authors declare that they have no conflict of interest.
Figures
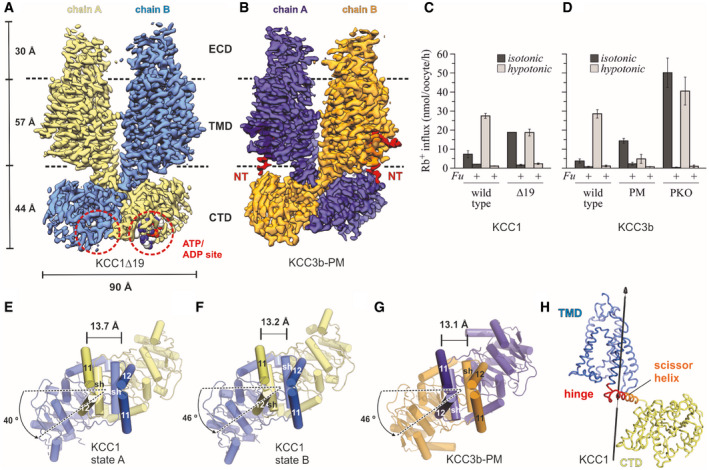
- A
Density map of KCC1Δ19, coloured by protomer. ATP bound to the CTD is represented as spheres.
- B
Density map of KCC3b‐PM, coloured by protomer, with N‐terminal region highlighted in bright red.
- C, D
Rb+ uptake activity of WT and mutant constructs for KCC1 (C) and KCC3b (D) under isotonic (dark grey bars) and hypotonic conditions (light grey bars). Values are mean (± SE) background‐subtracted transport rates of 10 oocytes from 3 to 6 experiments in the presence (indicated by +Fu) or absence of 1.5 mM furosemide.
- E–G
CTD arrangement of KCC1 (construct Δ19) (E, F) and KCC3b (construct PM: S45D/T940D/T997D, panel G). Of the TMD, only TM helices 11 and 12 are shown for clarity. Cα distances (in Å) between marker atoms S634 (KCC1) and S648 (KCC3b) are indicated by a black line.
- H
Hinge region (red ribbon representation) for conformational change between state A and B of KCC1 predicted by DynDom (Lee et␣al, 2003).
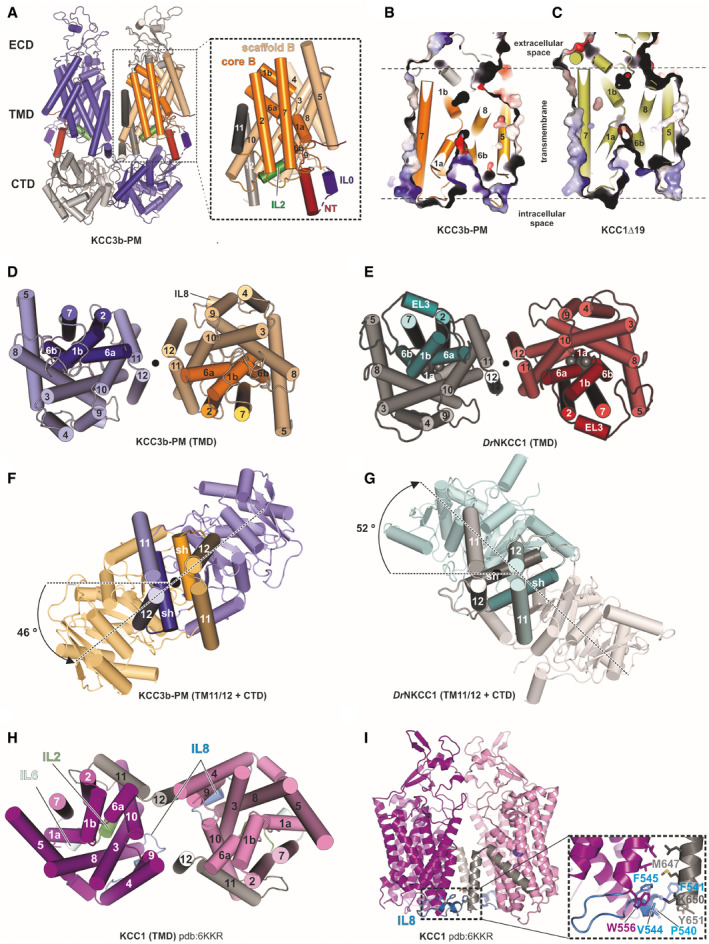
- A
Cartoon representation of the KCC3b‐PM dimer with inset illustrating the TMD of one subunit. The transporter core domain is shown in orange, the scaffold domain in wheat.
- B, C
Slab view of the transporter domain of KCC3 (construct: PM) (B) and KCC1 (construct: Δ19) (C) in surface representation, highlighting the inward‐open conformations with intracellular accessible vestibules.
- D, E
Extracellular view of the TMD dimer of KCC3b‐PM (D) and DrNKCC1 (E).
- F, G
Extracellular view onto central TM11/TM12 helices and CTD, highlighting counter‐clockwise twisted CTD for KCC3b‐PM (F) and clockwise twisted CTD for DrNKCC1 (G).
- H
Extracellular view onto TMD dimer illustrating the alternative dimer interface observed in CTD‐free KCC1 (6KKR).
- I
Front view on CTD‐free KCC1 dimer detailing molecular interactions (inset) between IL8 (blue helix) and TM12 characteristic for the configuration in 6KKR.
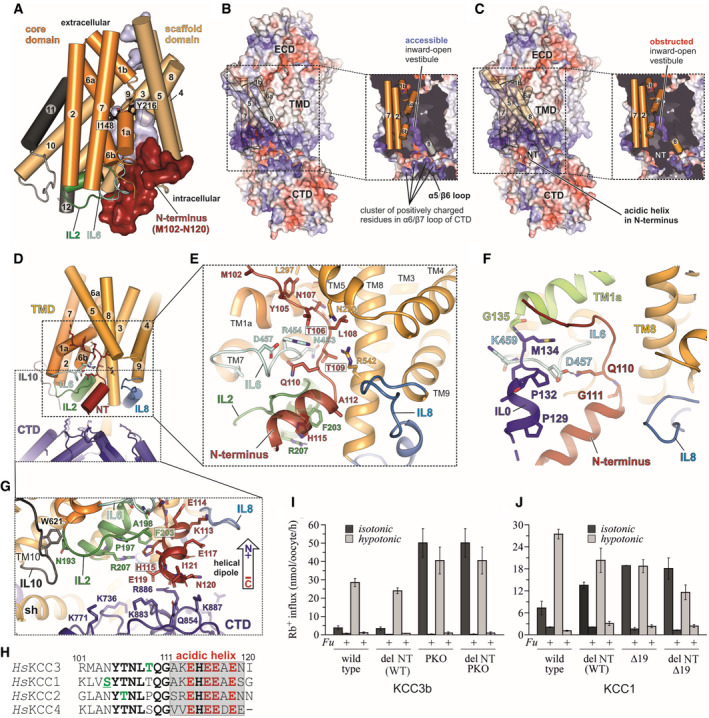
- A
Cartoon representation of the KCC3b‐PM TMD with N‐terminal residues M102‐N120 shown as red surface. The core domain (helices 1, 2, 6, 7) is represented in orange, the scaffold domain (helices 3–5, 8–10) in wheat. Residues I148 and Y216 involved in ion coordination are shown as black sticks.
- B
Electrostatic surface representations of KCC3b‐PM and slab view of the TMD (inset) in absence of N‐terminal residues M102‐M134. The surface is coloured by electrostatic potential (red, −5 kT e−1; blue,+5 kT e−1).
- C
Same as in (B), but with N‐terminal residues included, highlighting the obstruction of the inward‐open vestibule.
- D
Cartoon representation of TMD (yellow), intracellular loops (blue, green and light cyan), CTD (deep blue) and N‐terminus (dark red).
- E
Conserved polar residues (stick representation) in the N‐terminus interact with IL6 (light cyan), IL2 (green), TM5 and TM8. IL0 is omitted for clarity.
- F
N‐terminal “triangular” extension formed by residues M102‐M134 prior to TM1a (lime green helix). IL0 (blue helix) and NT (dark red) are stabilized by interactions to IL6 (light cyan).
- G
Stabilization of acidic helix in N‐terminus (red cartoon) by Pi‐stacking to F203 in IL2 (green sticks) and backbone carbonyl interactions to positively charged residues in the CTD (deep blue sticks).
- H
Sequence alignment of N‐terminal segments from human KCCs with phosphorylation sites highlighted in green. Underscored letters represent phosphorylation sites confirmed experimentally in this study.
- I
Rb+ uptake activity under isotonic and hypotonic conditions for KCC3b variants with internally deleted R101‐I121, introduced to KCC3b‐WT and KCC3b‐PKO, respectively. Values are mean (± SE) background‐subtracted transport rates of 10 oocytes from 3‐6 experiments in the presence or absence of 1.5 mM furosemide (indicated by +/− Fu).
- J
Rb+ uptake activity under isotonic and hypotonic conditions for KCC1 (WT and Δ19), and the respective constructs with an internal deletion of residues K85‐G105. Values are mean (± SE) background‐subtracted transport rates of 10 oocytes from 3 to 6 experiments in the presence (indicated by +Fu) or absence of 1.5 mM furosemide.
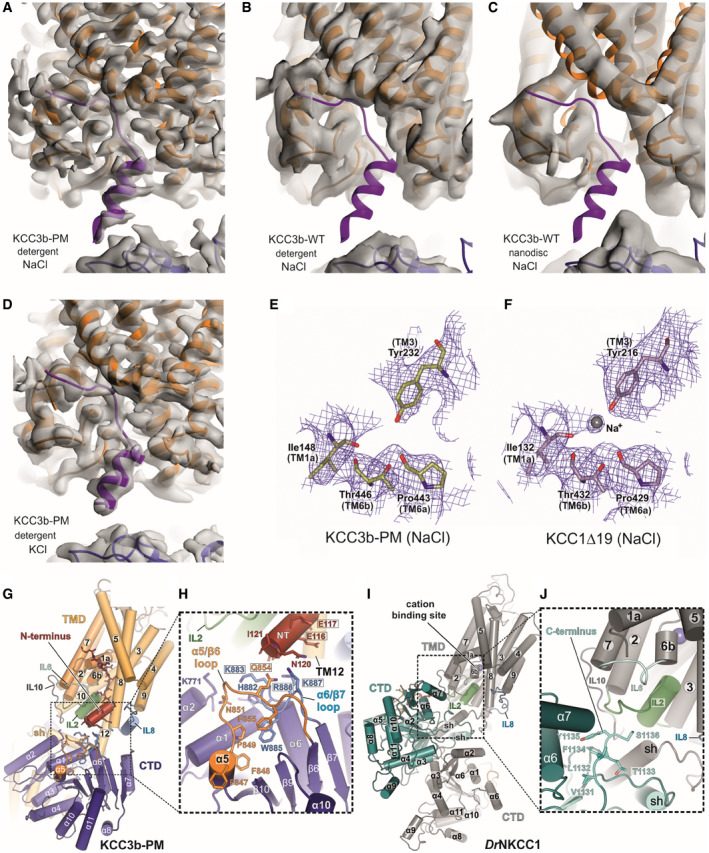
- A–D
Cryo‐EM maps of KCC3b constructs determined in various conditions. Density for N‐terminal helix (purple cartoon) is visible in the cryo‐EM maps of KCC3b‐PM in detergent environments, in both potassium‐free (A) and potassium‐saturated (D) conditions. On the other hand, there is no density for the N‐terminal helix in the cryo‐EM maps of KCC3b‐WT in both detergent (B) and nanodisc (C) environments.
- E, F
Comparison of KCC3b‐PM and KCC1∆19 at the cation‐binding site. Density for inorganic ion is not present in the KCC3b‐PM map (E), but it is present in KCC1∆19 (F), suggesting its inverse correlation with the presence of N‐terminal segment.
- G–J
Differences in TMD/CTD interfaces between human KCC3b‐PM (G, H) and DrNKCC1 (I, J) as consequence of counter‐clockwise and clockwise interdomain twist which brings either N‐terminus (KCC3b) or C‐terminus (DrNKCC1) in close proximity to IL2. H: black frames highlight residues mutated to Ala for functional characterization in Appendix␣Fig S8.
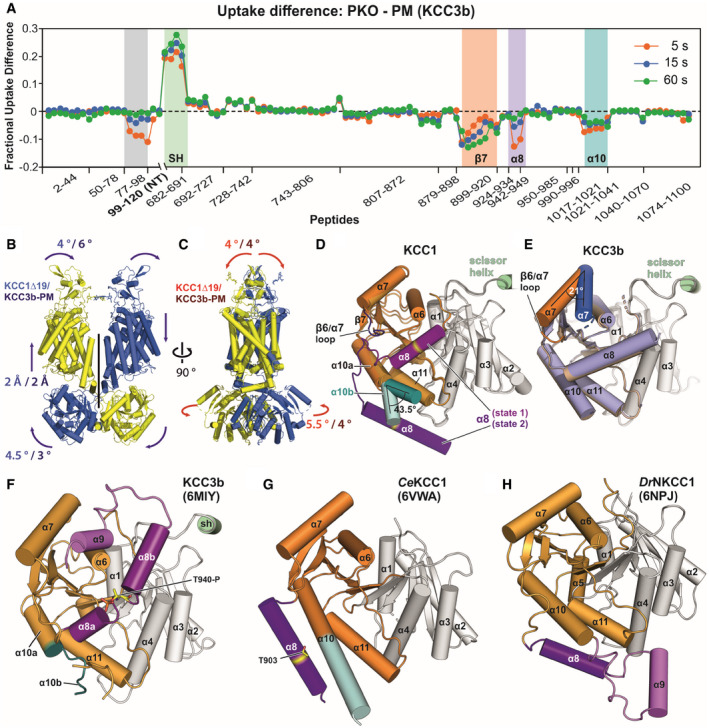
- A
HDX‐MS difference plot illustrating areas with altered deuterium exchange rates for PKO and PM of KCC3b. Relative fractional uptake differences (PKO minus PM Mutant) at three indicated time points are plotted against amino acid range covered by peptides. Negative uptake difference indicates an increased hydrogen exchange of PM. Positive uptake difference indicates a decreased hydrogen exchange of PM. All data points are mean from triplicates. Grey highlighted region indicates peptides with increased hydrogen exchange of the PM variant for an N‐terminal portion not resolved in the cryo‐EM structure.
- B, C
Conformational dynamics of full‐length KCC1Δ19 and KCC3b‐PM structures inferred from normal modes (3D variability analysis. Movements of flexible regions are indicated by arrows. Extent of movement is quantified in Å or ° for KCC1Δ19 (values in blue or red) and KCC3b‐PM (values in dark blue or dark red).
- D, E
Co‐existing alternative conformations of the CTD outer lobe helices α8 in KCC1Δ19 (D, violet and purple helices) and α7 in KCC3b‐PM (E, blue and orange helices). Cα atom locations of T629 within the KCC1Δ19 α8 helices are highlighted in yellow. Alternative conformations of α10b of KCC1Δ19 are highlighted in teal and light teal cartoon representation.
- F
Cartoon representation of KCC3b‐WT CTD (pdb: 6MIY) with alternative α8 and α10b conformations, highlighted in violet and teal, respectively. Phosphorylated residue T940‐P is shown as yellow sticks.
- G
Cartoon representation of the CTD of CeKCC1 (pdb: 6VWA) with alternative α8 and α10b conformations, highlighted in purple and light teal, respectively.
- H
Cartoon representation of the CTD of DrNKCC1 (pdb: 6NPJ).
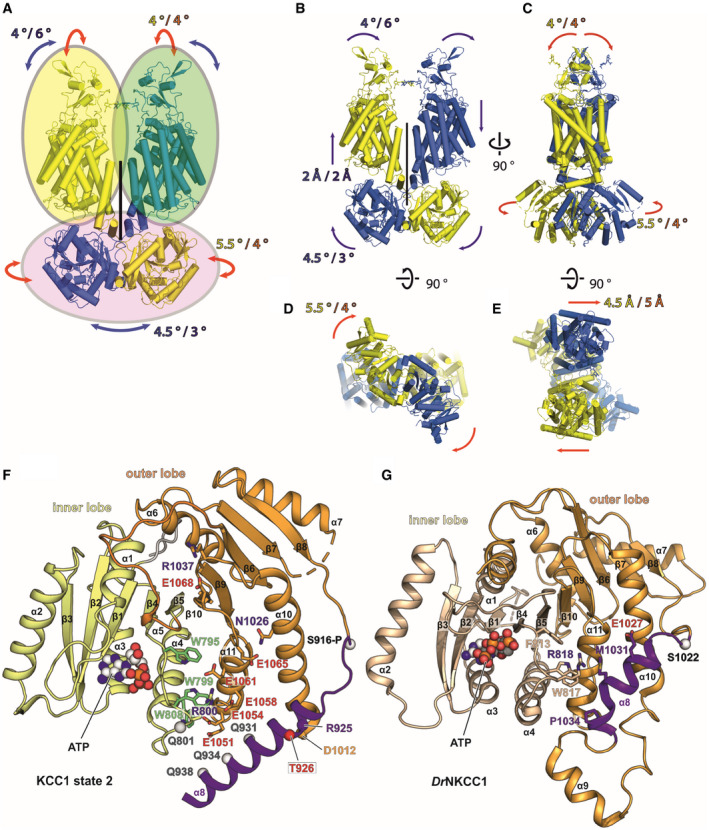
- A
Rigid body groups (oval circles) identified by 3D variability analyses of KCC1 and KCC3.
- B–E
The two man modes of movement are represented by red (mode 0) and blue (mode 1) arrows. The extent of each movement is indicated by a numerical value (in either ° or Å) in blue/yellow for KCC1Δ19 and purple/orange for KCC3b‐PM. (B‐C): redisplay of Fig 3B and C. (B): front view, (C): side view, (D): cytoplasmic view, (E): extracellular view.
- F
Alternative α8 conformation in the CTD of KCC1 from 3D variability analysis (Fig 3D), highlighting residues involved in interactions stabilizing this conformation (state 2).
- G
α8 arrangement in DrNKCC1 structure, showing similarities to the helical positioning in KCC1, state 2 (panel F).
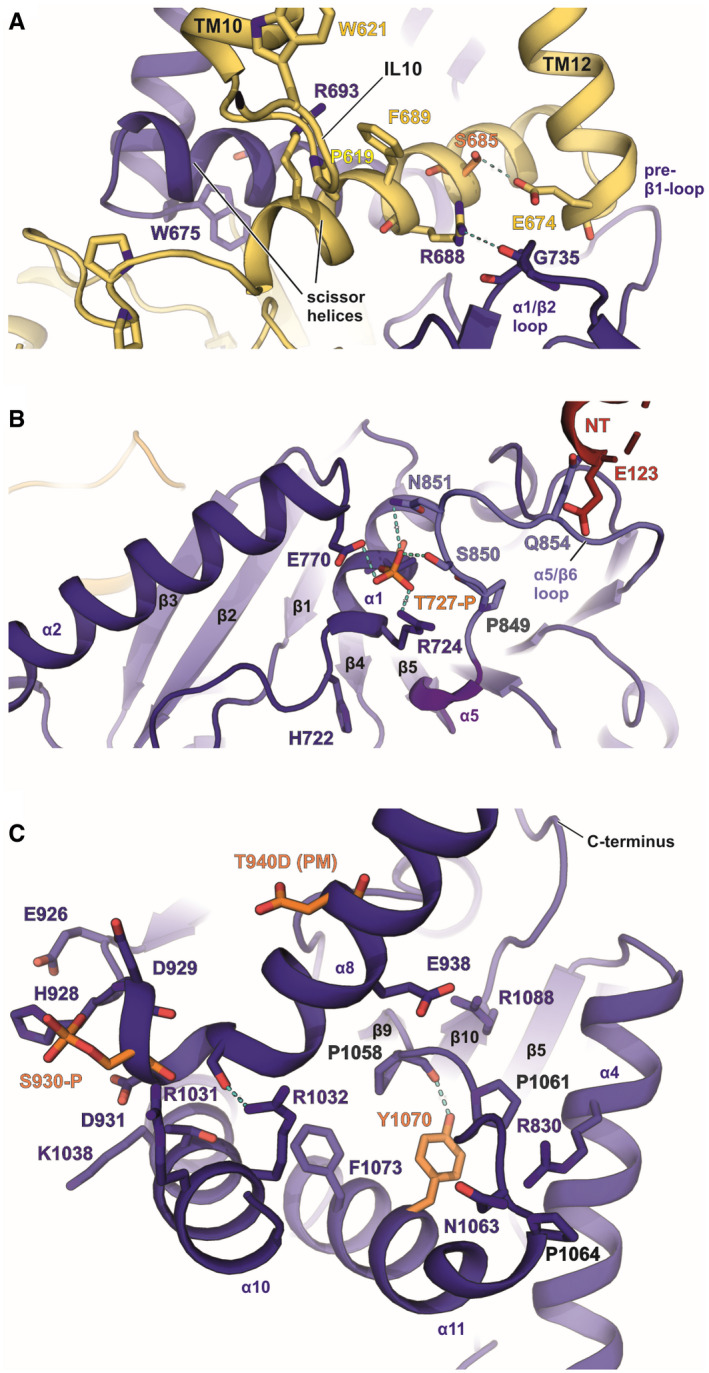
- A
Location of S685‐P in the scissor helix of the CTD.
- B
T727‐P in α1 near the ATP/ADP‐binding site.
- C
Location of T940D and S930‐P in α8 and Y1070 in α10. Phosphorylated residues according to MS‐MS data are shown in orange. Arginines and prolines in the vicinity are highlighted with blue and grey labels, respectively.
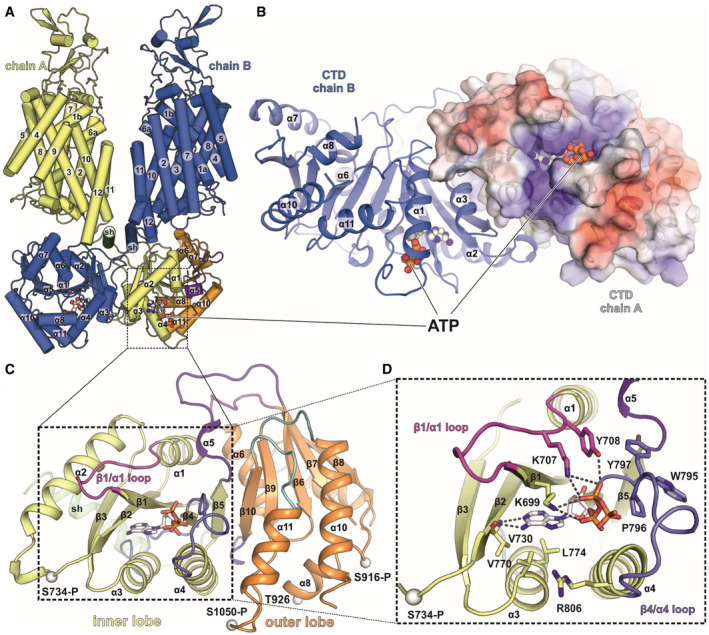
- A
Front view of full‐length KCC1Δ19 with ATP (spheres) bound to both CTDs in the dimer. Overview of the KCC1 structure in cartoon representation.
- B
Intracellular view onto the CTD dimer of KCC1Δ19 with ATP bound to each chain. Chain A is shown as electrostatic surface coloured by electrostatic potential (red, −5 kT e−1; blue,+5 kT e−1), chain B as cartoon.
- C
C‐terminal domain organization of KCC1, with scissor helix (green), inner lobe (yellow) and outer lobe (orange). Cαs of phosphorylated residues are shown as white spheres.
- D
Detail of the inner lobe with ATP bound via backbone interactions to V730 and side chain interactions with two lysines: K699 and K707 in the β1/α1 loop (shown in pink) and additional residues in the β4/α4 loop (shown in slate blue).
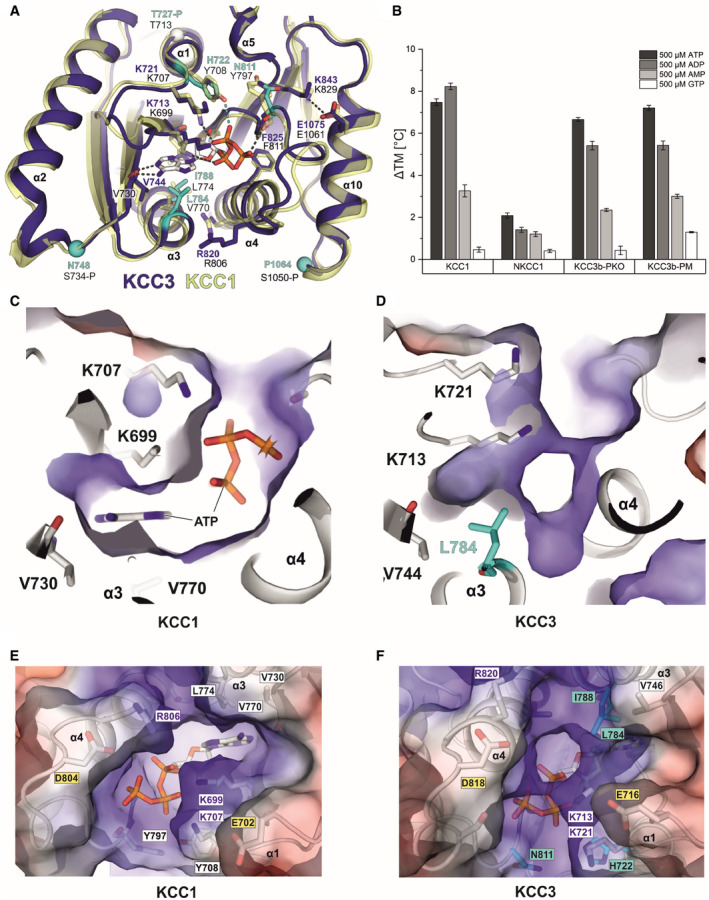
- A
Superposition of the inner lobe of KCC1 (construct Δ19 in yellow cartoon representation) and KCC3b (construct PM in deep blue cartoon representation) with sequence differences in KCC3b highlighted in cyan.
- B
Bar chart illustrating the extent of thermostabilization (ΔTM shift in melting temperature determined by nanoDSF) by different nucleotides at 500 µM of human KCC1, NKCC1, KCC3b‐PKO and KCC3b‐PM. Values are mean (± SE) from triplicates for each condition.
- C–F
Electrostatic surface representation of the ATP‐binding pocket in KCC1 (C, E) and the respective region in KCC3 (D, F). The surface is coloured by electrostatic potential (red, −5 kT e−1; blue,+5 kT e−1). Labels in cyan highlight residues different in KCC3, yellow labels indicate residues with potential roles in Mg2+ coordination or ATP hydrolysis. White labels highlight residues with a major role in nucleotide binding.
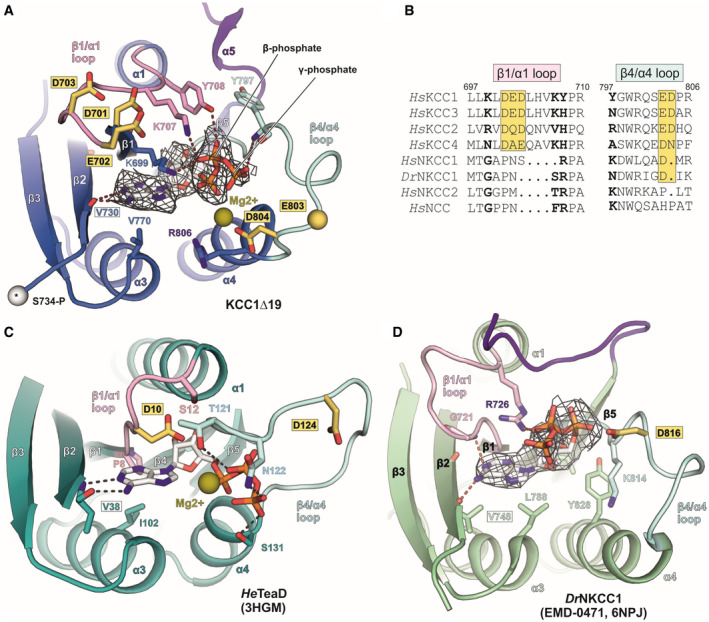
- A
ATP (stick representation) fitted into EM density map (grey mesh) of human KCC1Δ19. White sphere with asterisk represents the cα atom of phosphorylation site S734‐P in KCC1.
- B
Sequence alignment of β1/α1 and β4/α4 loops for different members of the SLC12 family. Bold letters indicate residues involved in ATP binding. Yellow boxes highlight conserved, acidic residues.
- C
ATP binding to the regulatory subunit TeaD (pdb: 3HGM) of the ectoine transporter TeaABC from Halomonas elongata.
- D
ATP fitted into unmodelled densities (grey mesh) in the cryo‐EM map of DrNKCC1. Labels for conserved valine residues engaged in the main polar backbone interaction with the nucleotide base are framed in a black box. Residues labelled in yellow‐highlighted boxes in panels (A–D) are conserved acidic residues in the β1/α1 and β4/α4 loops of the CTD, which could potentially play a role in catalysing ATP hydrolysis, or in Mg2+ coordination. Mg2+ ions with a potential role for coordinating oxygen atoms in the β‐ and γ‐phosphates of ATP are shown as olive spheres (positions are taken from 3HGM coordinates).
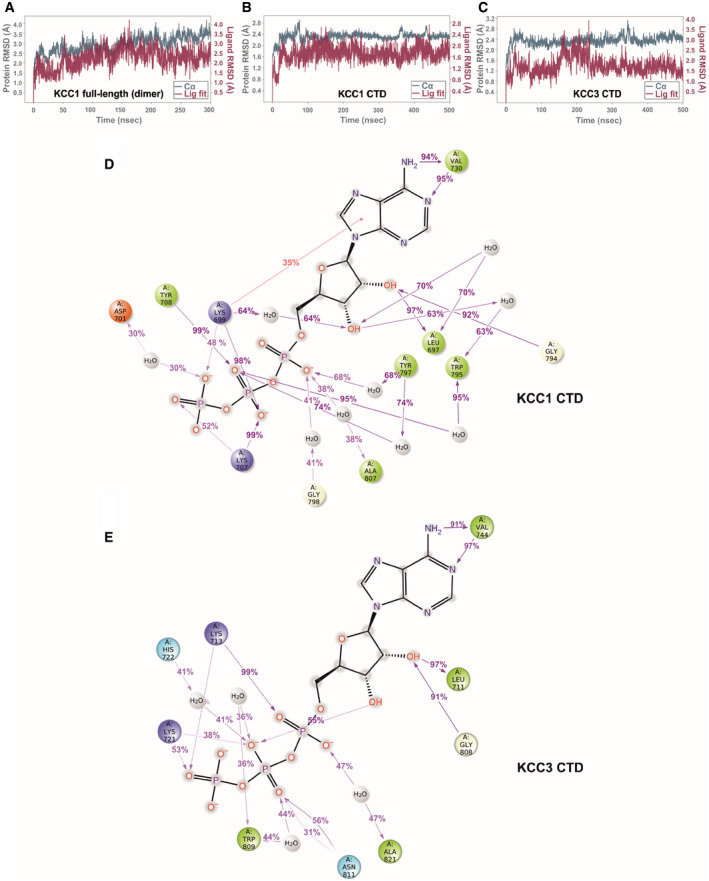
- A
Protein RMSD (teal trace) and ligand RMSD (purple trace) over the course of a 300 ns simulation of ATP bound to the KCC1 dimer (construct Δ19, complete model with 175,573 atoms).
- B, C
Protein and ligand RMSD over the course of a 500 ns simulation of ATP bound to the isolated CTD of KCC1 (construct Δ19) and KCC3b (construct PM) with 42,461 and 39,805 atoms, respectively.
- D, E
Ligand‐protein contacts for ATP, inferred from a 500 ns MD run of the isolated CTD KCC1 (construct Δ19) (D) and KCC3b (construct PM) (E), respectively. Charged interactions are shown in red (negative) or blue (positive), hydrophobic interactions are shown in green. Further details regarding the nature of protein‐ligand interactions are provided in the legend shown in Appendix␣Fig S12.
Comment in
-
Transport unplugged: KCCs are regulated through an N-terminal plug of the ion pathway.EMBO J. 2021 Jul 15;40(14):e108371. doi: 10.15252/embj.2021108371. Epub 2021 May 25. EMBO J. 2021. PMID: 34031898 Free PMC article.
References
-
- Akcakaya NH, Yapici Z, Tunca CI, Tekturk P, Akcimen F, Basak AN (2018) A new splice‐site mutation in SLC12A6 causing Andermann syndrome with motor neuronopathy. J Neurol Neurosurg Psychiatry 89: 1123–1125 - PubMed
-
- Altamirano AA, Breitwieser GE, Russell JM (1988) Vanadate and fluoride effects on Na+‐K+‐Cl‐ cotransport in squid giant axon. Am J Physiol 254: C582–586 - PubMed
-
- Altamirano AA, Watts BA 3rd, Russell JM (1990) Binding of bumetanide to microsomes from optic ganglia of the squid, Loligo pealei . Am J Physiol 258: C933–943 - PubMed
Publication types
MeSH terms
Substances
Associated data
- Actions
- Actions
- Actions
- Actions
- Actions
- Actions
- Actions
Grants and funding
LinkOut - more resources
Full Text Sources
Other Literature Sources
Medical
Molecular Biology Databases
