. 2021 Aug;34(8):e4542.
doi: 10.1002/nbm.4542. Epub 2021 May 24.

Rapid 2D variable flip angle method for accurate and precise T1 measurements over a wide range of T1 values

Affiliations

Rapid 2D variable flip angle method for accurate and precise T1 measurements over a wide range of T1 values

Beatrice Lena et al. NMR Biomed. 2021 Aug.

Abstract

Purpose: To perform dynamic T1 mapping using a 2D variable flip angle (VFA) method, a correction for the slice profile effect is needed. In this work we investigated the impact of flip angle selection and excitation RF pulse profile on the performance of slice profile correction when applied to T1 mapping over a range of T1 values.

Methods: A correction of the slice profile effect is proposed, based on Bloch simulation of steady-state signals. With this correction, Monte Carlo simulations were performed to assess the accuracy and precision of 2D VFA T1 mapping in the presence of noise, for RF pulses with time-bandwidth products of 2, 3 and 10 and with flip angle pairs in the range [1°-90°]. To evaluate its performance over a wide range of T1 , maximum errors were calculated for six T1 values between 50 ms and 1250 ms. The method was demonstrated using in vitro and in vivo experiments.

Results: Without corrections, 2D VFA severely underestimates T1 . Slice profile errors were effectively reduced with the correction based on simulations, both in vitro and in vivo. The precision and accuracy of the method depend on the nominal T1 values, the FA pair, and the RF pulse shape. FA pairs leading to <5% errors in T1 can be identified for the common RF shapes, for T1 values between 50 ms and 1250 ms.

Conclusions: 2D VFA T1 mapping with Bloch-simulation-based correction can deliver T1 estimates that are accurate and precise to within 5% over a wide T1 range.

Keywords: T1 mapping; slice excitation profile; variable flip angle.


Figures

FIGURE 1
FIGURE 1
I. Flowchart of building the T 1 LUT. For each nominal T 1 the steady‐state signal is simulated for two nominal FAs. From the simulated signals, the apparent T1^ is computed using the VFA method. The values of apparent T1^ are then inserted in the table for comparison with the corresponding nominal T 1. II. LUT structure and correction procedure. The LUT is indexed by the FA pair and nominal T 1. LUT entries are apparent T 1 for each combination of FA1, FA2 and nominal T 1. In the case of B 1 + correction the nominal FA is scaled to actual FA in the voxel. At this FA pair (Arrow A) the apparent T 1 is matched to entries of the LUT and the corresponding nominal T 1 is looked up (Arrow B)
FIGURE 2
FIGURE 2
RF pulse shapes considered: Gaussian RF pulse, TBP 2 (A), asymmetric lobe of a SINC pulse, TBP 3 (B), and five central lobes of a SINC pulse, TBP 10 (C). In the simulations, slice thickness and RF bandwidth were maintained constant, whereas RF pulse duration was changed
FIGURE 3
FIGURE 3
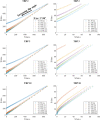
Plot of S/sin θ versus S/tan θ for simulated steady‐state signals with RF pulses with TBP 2, 3 and 10, T R = 10 ms and T 1 = 50, 250, 500, 750, 1000 and 1250 ms. The high FAs lie closer to the origin of the graphs, as indicated by the arrow. The right‐hand column shows a magnified view to detail the behavior at high FA
FIGURE 4
FIGURE 4
Plot of the natural logarithm of k, for TBP 2, 3 and 10 and the ideal case without slice profile effects, with fixed FA1 = 4°, T R = 10 ms and T 1 = 300 ms (left) and 1000 ms (right)
FIGURE 5
FIGURE 5
Relative error in 2D VFA T 1 mapping as a function of FA combination, without (A) and with (B) the T 1 correction with LUT. Data is shown for a single T 1 of 500 ms. Simulation input: RF pulse with TBP 3, nominal T 1 500 ms and T R 10 ms. Note: because of symmetry, only half of the FA combinations are presented
FIGURE 6
FIGURE 6
Relative error εT1 (A) and relative standard deviation σT1 (B) in 2D VFA T 1 mapping, as a function of the FA combination chosen and applied to different nominal T 1 values. Results are for one pulse shape, and after correction using the lookup table. Simulation input: TBP 3, nominal T 1 50, 250, 500, 750, 1000 and 1250 ms and T R 10 ms. The blue crosses show the minimum for each nominal T 1. For B, the FA pair calculated using the method of Deoni et al is indicated with a red cross. Note that the color scale is different from that of Figure 5
FIGURE 7
FIGURE 7
A, B, Performance of 2D VFA T 1 mapping for a range of T 1, using RF pulses with different TBP. Maps of maximum relative error εT1,max (A) and relative standard deviation σT1,max (B) over six nominal T 1 values: the value in each location is calculated as the maximum projection over six nominal T 1 values. The blue crosses show the minima identified for the whole T 1 range. C, Contour plot identifying combinations of FA for which εT1,max and σT1,max are 5% on the contour and below 5% inside; the FA pair, calculated using the method of Deoni et al, are also reported in black for the single nominal T 1 values. Note that the scale for FA1 in C is different
FIGURE 8
FIGURE 8
Relative error in T 1 estimation as a function of T 1. The relative errors were evaluated in 30‐pixel ROIs at the center of each tube (images acquired with TBP 3; nominal FA 6°, 40°). The 2D VFA estimates are reported without corrections, with slice profile correction and with both slice profile and B 1 correction. The grey band represents the standard deviation of the IR T 1 estimation
FIGURE 9
FIGURE 9
Estimated T 1 maps of a transverse slice in the brain of two volunteers (images acquired with TBP 3; nominal FA 6°, 40°). The T 1 maps have been estimated with the 2D VFA method without (A) and with (B) slice profile correction, and with the 3D VFA method (C). All the maps have been corrected for B 1 inhomogeneities

References

    1. Taylor AJ, Salerno M, Dharmakumar R, Jerosch‐Herold M. T1 mapping: basic techniques and clinical applications. JACC: Cardiovasc Imaging. 2016;9:67‐81. - PubMed
    1. Dekkers IA, Lamb HJ. Clinical application and technical considerations of T 1 and T 2(*) mapping in cardiac, liver, and renal imaging. Br J Radiol. 2018;91:1092. - PMC - PubMed
    1. Hattingen E, Müller A, Jurcoane A, et al. Value of quantitative magnetic resonance imaging T1‐relaxometry in predicting contrast‐enhancement in glioblastoma patients. Oncotarget. 2017;8(32):53542‐53551. - PMC - PubMed
    1. Deoni SCL, Rutt BK, Peters TM. Rapid combined T 1 and T 2 mapping using gradient recalled acquisition in the steady state. Magn Reson Med. 2003;49(3):515‐526. - PubMed
    1. Look DC, Locker DR. Time saving in measurement of NMR and EPR relaxation times. Rev Sci Instrum. 1970;41(2):250‐251.

Publication types

LinkOut - more resources