

From coarse to fine: the absolute Escherichia coli proteome under diverse growth conditions
- PMID: 34032011
- PMCID: PMC8144880
- DOI: 10.15252/msb.20209536
From coarse to fine: the absolute Escherichia coli proteome under diverse growth conditions
Erratum in
-
Author Correction: From coarse to fine: the absolute Escherichia coli proteome under diverse growth conditions.Mol Syst Biol. 2024 Nov;20(11):1257-1259. doi: 10.1038/s44320-024-00062-5. Mol Syst Biol. 2024. PMID: 39354190 Free PMC article.
Abstract
Accurate measurements of cellular protein concentrations are invaluable to quantitative studies of gene expression and physiology in living cells. Here, we developed a versatile mass spectrometric workflow based on data-independent acquisition proteomics (DIA/SWATH) together with a novel protein inference algorithm (xTop). We used this workflow to accurately quantify absolute protein abundances in Escherichia coli for > 2,000 proteins over > 60 growth conditions, including nutrient limitations, non-metabolic stresses, and non-planktonic states. The resulting high-quality dataset of protein mass fractions allowed us to characterize proteome responses from a coarse (groups of related proteins) to a fine (individual) protein level. Hereby, a plethora of novel biological findings could be elucidated, including the generic upregulation of low-abundant proteins under various metabolic limitations, the non-specificity of catabolic enzymes upregulated under carbon limitation, the lack of large-scale proteome reallocation under stress compared to nutrient limitations, as well as surprising strain-dependent effects important for biofilm formation. These results present valuable resources for the systems biology community and can be used for future multi-omics studies of gene regulation and metabolic control in E. coli.
Keywords: Escherichia coli; absolute quantification; mass spectrometry; protein inference; quantitative proteomics.
© 2021 The Authors. Published under the terms of the CC BY 4.0 license.
Conflict of interest statement
The authors declare that they have no conflict of interest.
Figures
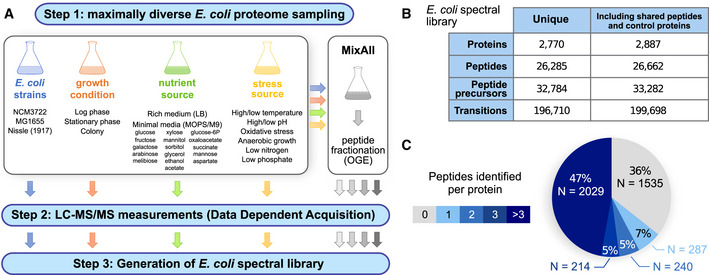
Workflow employed to generate a comprehensive E. coli spectral library. Step 1: A wide range of E. coli cells from various strains grown under different conditions were generated, including different time points of sampling, growth media, high and low pH, aerobic and anaerobic growth, temperatures, high and low osmotic conditions, and different nutrition additives. Peptide fractionation by off‐gel electrophoresis (OGE) was performed on a “MixAll” sample. Step 2: All samples were measured in data‐dependent acquisition (DDA) mode on a TripleTOF 5600 instrument. In total, 53 MS injections were performed. Step 3: MS2 spectra were matched to the canonical E. coli proteome, and a consensus spectral library was generated.
Numbers of proteins, peptides, precursors, and transitions entailed in the E. coli spectral library. Given are the statistics for the unique proteins and peptides only, as well as for all entries, including also shared peptides, iRT peptides as well as 9 control proteins not from the organism E. coli.
Distribution of detectable unique peptides per protein.
- A
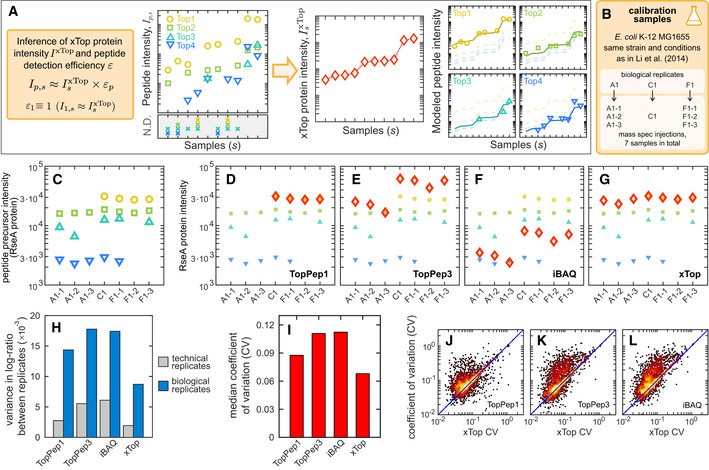
xTop is a protein inference algorithm which models for each protein the intensities of peptide precursors as the product of the xTop protein intensity in sample s, and a detection efficiency εp for each peptide precursor p relative to the peptide with the largest intensity (Top1). This allows to integrate consistently the information from the whole dataset and minimizes the impact of missing peptides on the inferred protein intensity.
- B
We collected 3 biological samples of E. coli K‐12 MG1655 (EQ353) in glucose minimal media, matching strain, and condition from Li et al (2014). Two of the three biological replicates were injected 3 times, for a total of 7 proteomics “calibration” datasets. These samples were used for testing the reproducibility of the proteomics measurements and the absolute quantification.
- C
Peptide precursor intensities measured for the RseA protein across the seven calibration samples. Different symbols and colors indicate different unique peptide precursors. Peptide‐level intensities are reported in Datasets EV4 and EV5.
- D–G
Protein intensities (red open diamonds) obtained from the data in panel (C) (also shown in these panels as smaller symbols) computed with four protein inference algorithms: TopPep1, TopPep3, iBAQ, and xTop (Dataset EV6).
- H
Variance in the log‐ratio of protein intensities between technical (samples F1‐1 and F1‐2) or biological (samples A1‐1 and F1‐1) replicates using the same proteins (N = 1,631) quantified in all samples by each method (see also Appendix Fig S2).
- I
For each protein, the coefficient of variation (CV) of the protein intensities was computed across the seven calibration samples using the same N = 1,939 proteins excluding non‐detected proteins. The bar graph shows the median CV for each of the four methods employed.
- J–L
Scatter of CV computed from TopPep1, TopPep3, and iBAQ against that of xTop. An excess of points is visible above the diagonal (blue line) especially for TopPep3 and iBAQ.

- A
Ratio of protein mass fractions computed with several protein inference algorithms (x‐axis labels) and mass fractions quantified with spiked‐in labeled peptides (AQUA) for a set of 29 proteins spanning more than 2 orders of magnitude (see Appendix Fig S3, Dataset EV7). The red boxes and symbols represent four proteomics‐based protein inference algorithms (TopPep1/3, iBAQ, and xTop). The blue box and symbols correspond to ribosome profiling‐derived mass fractions. The boxes and whiskers include 50 and 90% of the data, respectively, while the central line represents the median.
- B–E
Estimated concentration of protein complexes from various protein inference algorithms and ribosome profiling. Individual points are the estimated concentrations for individual proteins in the complex, divided by the number of copies in each complex. Individual concentrations were estimated from the observed protein number fractions assuming a total protein concentration of 3 × 10⁶ proteins/μm3 (Appendix Note S1). The boxes and whiskers include 50 and 90% of the data, respectively, while the central line represents the median.
- F
The bar chart summarizes the multilinear analysis described in Appendix Note S3. The total height of the bar is the variance in the log‐ratio of proteomics‐based and ribosome profiling‐based mass fractions. Colored components represent the fraction of variance explained by each factor (red, protein size; blue, only one peptide precursor detected; light blue, only 2 peptide precursors detected). TopPep1/3 and xTop protein mass fractions display a bias toward large proteins; TopPep3 and iBAQ systematically underestimate the abundance of proteins with 1 or 2 detected peptides.
- G–J
Scatter plot of fold change between reference and carbon‐limited conditions (growth rates 0.91/h and 0.35/h, respectively) in mass spectrometry‐based (, y‐axis) and ribosome profiling‐based protein mass fractions (, x‐axis). The blue line represents equal changes in the two quantities; the dashed lines represent a 2‐fold discrepancy.
- K
Fraction of proteins showing a > 2‐fold discrepancy in panels (G–J).

- A
Starting from a “reference” condition (glucose minimal media, growth rate approx. 1/h), we modulate E. coli growth by applying three different sources of stress (“limitations”): carbon (C‐) limitation, obtained by titrating glucose transport; anabolic (A‐) limitation, obtained by titrating nitrogen assimilation; ribosomal (R‐) limitation, obtained by introducing translation‐inhibiting antibiotics (chloramphenicol). The simplest way to capture the change in the proteome composition is to introduce a binary classification: A protein can be either up‐ or downregulated in each of the three limitations. For example, the C‐sector includes all proteins whose abundance increases in C‐limitation and decrease in A‐ and R‐limitation, and is hence indicated as C↑A↓R↓. In the diagram, we show the eight possible sectors, with the number of genes associated with each sector. Dashed lines indicate higher‐order groupings between sectors with partially overlapping GO‐terms.
- B
The decomposition of the proteome into protein sectors allows to appreciate the large‐scale changes of protein expression in the three growth limitations. The pie charts indicate the composition of the proteome by mass in reference condition and in the three extreme limitations (growth rate approx. 0.3/h).
- C–K
Protein mass fractions associated with each of the eight sectors across growth rates in the three growth limitation series. Panel (H) represents the mass fraction of the O‐sector, given by the sum of C’‐, A’‐, and S’‐sector protein abundances (panels (I) to (K)).
- L
GO‐term enrichment analysis of the C’‐, A’‐, and S’‐sectors (see Appendix Note S4). The numbers at the side of the bars represent the number of genes in the sector associated with each GO‐term. Bold terms are mostly unique to each one of the three sectors, while the others are shared between two of the three sectors.

- A–C
Absolute protein mass fractions (in % of total protein mass) of the four most abundant outer membrane porins in E. coli NCM3722 (NpmC, OmpA, OmpC, and OmpF), as a function of growth rate in three growth limitation series; symbols are shown in the adjacent panel.
- D
The table summarizes the mass fractions of the four porins in reference condition (glucose minimal medium), extreme C‐, A‐, and R‐lim (growth rate ~ 0.3/h), and high osmolarity (sample Lib‐02, growth rate 0.24/h). Entries with mass fractions larger than 1% are highlighted in red.
- E
Total protein mass fractions of the four porins against growth rate, in the three growth limitation series.
- F
Total protein mass fraction of proteins classified as “periplasmic” according to Ecocyc classification (Karp et al, 2018) against growth rate, in the three growth limitations.
- G
Porin surface density in C‐limitation (red) and R‐limitation. To obtain the porin surface density, we first obtained the number of porins per cell volume (see Appendix Note S1) and divided by the (condition‐dependent) surface to volume ratio, using the values reported by Si et al (2017) for C‐ and R‐limitation.

- A
Comparison between the proteome of Escherichia coli cells grown in various carbon sources and that of cells grown in glucose. For each carbon source (x‐axis; the growth rate is specified in the label), we show the increase in protein mass fractions in that medium from the abundances observed for cells growing at a similar rate under “C‐limitation”, i.e., on glucose with titratable expression of the glucose transporter PtsG in NCM3722‐derived strains NQ1243 and NQ1390; see Dataset EV1. For growth on carbon sources different from glucose, wild‐type NCM3722 cells were used in all cases, except in the case of melibiose where the non‐motile NCM3722‐derived strain EQ59 was used instead. Red circles indicate proteins with a fold increase larger than 4; blue dots represent proteins associated with catabolism of the carbon sources in which cells are grown in (e.g., glp genes for growth on glycerol); gene names are displayed for proteins above a mass fraction of 0.5. Proteins that were systematically different across all samples were excluded from the comparison; this was done by computing the differences of the log‐transformed mass fractions across all pairs of samples, and excluding proteins for which the absolute value of the mean difference is larger than its standard deviation.
- B
Circles indicate the total mass fraction of proteins assigned to the C‐sector for cells growing under glucose uptake titration (C‐limitation, open red) and for cells grown on the carbon sources described in panel (A) (filled gray, except for growth on acetate, blue, and melibiose, green). Filled diamonds indicate the total mass fraction of proteins associated with the catabolism of specific carbon sources used (those indicated by the blue dots in panel (A)). They amount to only 5–10% of C‐sector proteins, with the exception of those associated with the catabolism of melibiose, with a single protein MelA comprising of 4% of total protein mass, or ~ 1/3 of C‐sector proteins.
- C
Open symbols indicate the fractional abundance within the C‐sector of four protein groups (TCA cycle and gluconeogenesis (TCA/GNG); motility; the outer membrane porin NmpC; alternative carbon or amino acid uptake and catabolic proteins) for cells growing under glucose uptake titration. The total protein mass fraction of these four groups adds up to between 64 and 75% of the whole C‐sector protein mass.
- D–F
Absolute protein mass fraction of TCA/GNG, motility, or alternate carbon uptake proteins that belong to the C‐sector. Symbols are the same as in panel (B)). Cells growing on acetate (blue) display higher TCA/GNG and lower motility expression levels compared to glucose‐limited growth at the same growth rate. Expression of motility proteins is instead greatly reduced for cell growing on melibiose (green), due to the fact that the non‐motile strain EQ59 was used in this case.

Comparison of protein mass fractions for cells grown in different base media: M9+glucose (y‐axis) versus MOPS+glucose (x‐axis).
Protein mass fractions for Escherichia coli strain NQ1431 (phnE +) growing in glucose and a poor phosphate source (2‐aminoethylphosphonate) versus wild‐type NCM3722 cells in reference condition (glucose minimal medium with phosphate as P‐source).
Proteome of anaerobically growing cells on glucose minimal medium versus that of cells in reference condition.
Comparison of proteome of cells in rich (LB) medium in different growth phases: mid‐exponential (OD600 = 0.6, x‐axis) and stationary phase (OD600 = 3.34, y‐axis).

Absolute protein mass fractions of NCM3722 cells grown at high temperature (42℃) versus normal temperature (37℃).
High osmolarity (0.6 M NaCl) versus normal osmolarity (0.1 M NaCl).
Comparison between proteomes of cells in high osmolarity versus high temperature. The two proteomes are quite similar despite the vastly different growth rates (0.24/h and 0.88/h, respectively).
Proteomes of cells subject to oxidative stress (600 µM hydrogen peroxide for 20 min before collection) compared to exponentially growing cells in reference condition.
Absolute protein mass fractions of Escherichia coli MG1655 (EQ353) versus strain NCM3722, both growing on glucose minimal medium.
Proteome of the NCM3722‐derived non‐motile strain EQ59 (motA − with wild‐type flhDC promoter) growing on melibiose, compared to that of NCM3722 cells growing on acetate.
Proteome of the biofilm‐forming E. coli strain Nissle1917 compared to that of NCM3722 (both growing on acetate).
Comparison of E. coli MG1655 (Genetic Coli Stock Center strain #6300) and Nissle1917.
The proteome of E. coli strain EQ59 growing on solid agar is compared to that of NCM3722 in reference condition.
Similar articles
-
Mass spectrometry-based workflow for accurate quantification of Escherichia coli enzymes: how proteomics can play a key role in metabolic engineering.Mol Cell Proteomics. 2014 Apr;13(4):954-68. doi: 10.1074/mcp.M113.032672. Epub 2014 Jan 29. Mol Cell Proteomics. 2014. PMID: 24482123 Free PMC article.
-
Multi-enzyme digestion FASP and the 'Total Protein Approach'-based absolute quantification of the Escherichia coli proteome.J Proteomics. 2014 Sep 23;109:322-31. doi: 10.1016/j.jprot.2014.07.012. Epub 2014 Jul 22. J Proteomics. 2014. PMID: 25063446
-
The catabolic nature of fermentative substrates influences proteomic rewiring in Escherichia coli under anoxic growth.Microb Cell Fact. 2025 Mar 25;24(1):71. doi: 10.1186/s12934-025-02658-4. Microb Cell Fact. 2025. PMID: 40133894 Free PMC article.
-
The Escherichia coli proteome: past, present, and future prospects.Microbiol Mol Biol Rev. 2006 Jun;70(2):362-439. doi: 10.1128/MMBR.00036-05. Microbiol Mol Biol Rev. 2006. PMID: 16760308 Free PMC article. Review.
-
Data-independent acquisition-based SWATH-MS for quantitative proteomics: a tutorial.Mol Syst Biol. 2018 Aug 13;14(8):e8126. doi: 10.15252/msb.20178126. Mol Syst Biol. 2018. PMID: 30104418 Free PMC article. Review.
Cited by
-
Gene expression tradeoffs determine bacterial survival and adaptation to antibiotic stress.bioRxiv [Preprint]. 2024 Jan 23:2024.01.20.576495. doi: 10.1101/2024.01.20.576495. bioRxiv. 2024. Update in: PRX Life. 2024 Jan-Mar;2(1):013010. doi: 10.1103/prxlife.2.013010. PMID: 38328084 Free PMC article. Updated. Preprint.
-
Characterization of RNA-based and protein-only RNases P from bacteria encoding both enzyme types.RNA. 2023 Mar;29(3):376-391. doi: 10.1261/rna.079459.122. Epub 2023 Jan 5. RNA. 2023. PMID: 36604113 Free PMC article.
-
Global and gene-specific translational regulation in Escherichia coli across different conditions.PLoS Comput Biol. 2022 Oct 20;18(10):e1010641. doi: 10.1371/journal.pcbi.1010641. eCollection 2022 Oct. PLoS Comput Biol. 2022. PMID: 36264977 Free PMC article.
-
Altering translation allows E. coli to overcome chemically stabilized G-quadruplexes.bioRxiv [Preprint]. 2024 Aug 12:2024.08.12.607615. doi: 10.1101/2024.08.12.607615. bioRxiv. 2024. Update in: Nucleic Acids Res. 2025 Mar 20;53(6):gkaf264. doi: 10.1093/nar/gkaf264. PMID: 39185182 Free PMC article. Updated. Preprint.
-
Incoherent feedback from coupled amino acids and ribosome pools generates damped oscillations in growing E. coli.Nat Commun. 2025 Mar 29;16(1):3063. doi: 10.1038/s41467-025-57789-4. Nat Commun. 2025. PMID: 40157904 Free PMC article.
References
Publication types
MeSH terms
Substances
Grants and funding
LinkOut - more resources
Full Text Sources
Other Literature Sources
Molecular Biology Databases
