

Minimal and Maximal Models to Quantitate Glucose Metabolism: Tools to Measure, to Simulate and to Run in Silico Clinical Trials
- PMID: 34032128
- PMCID: PMC9445339
- DOI: 10.1177/19322968211015268
Minimal and Maximal Models to Quantitate Glucose Metabolism: Tools to Measure, to Simulate and to Run in Silico Clinical Trials
Abstract
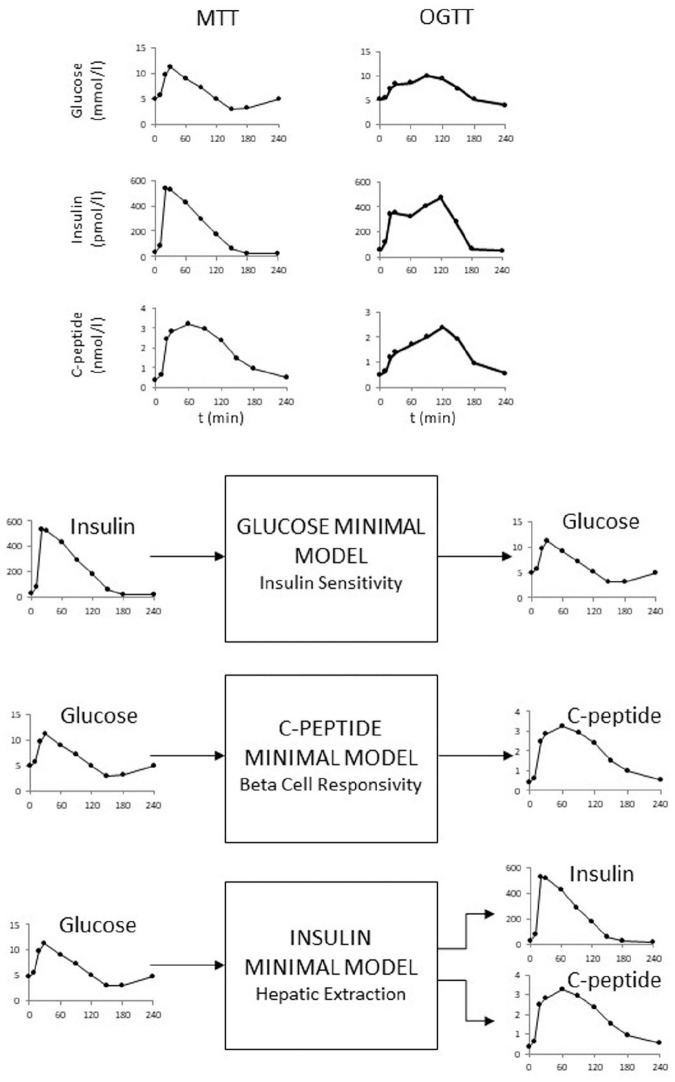
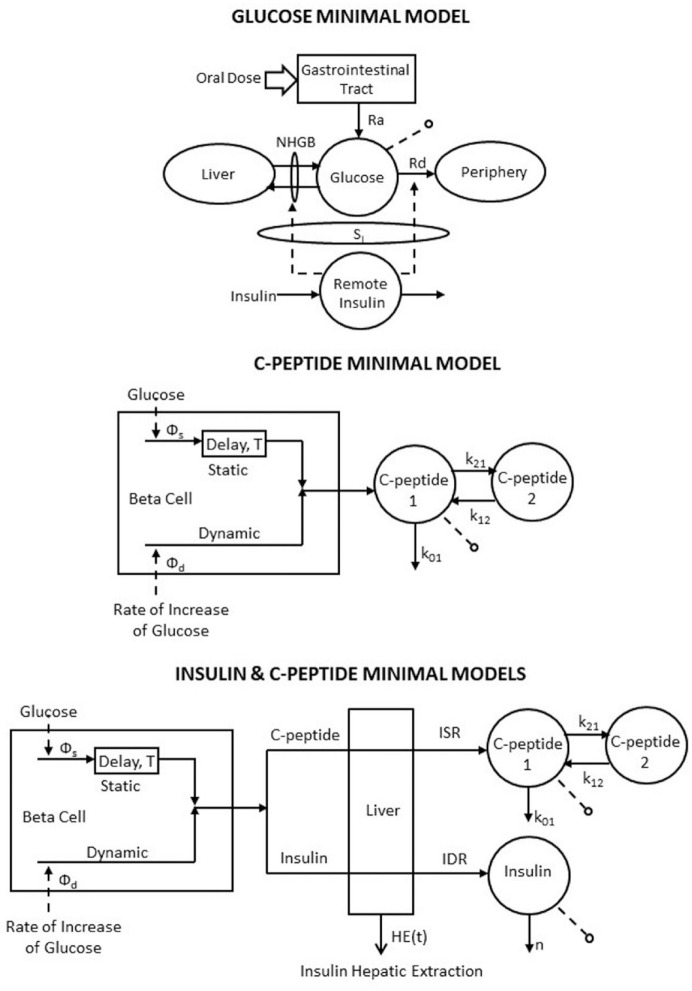
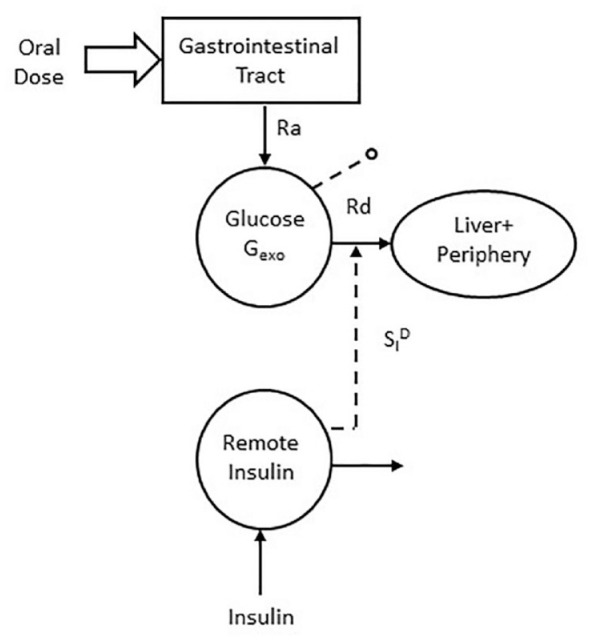
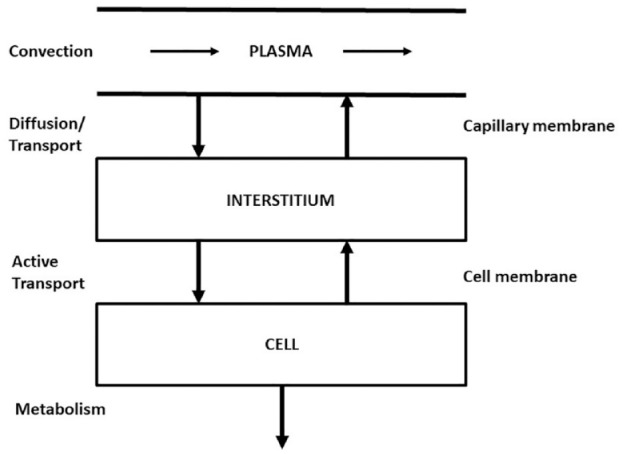
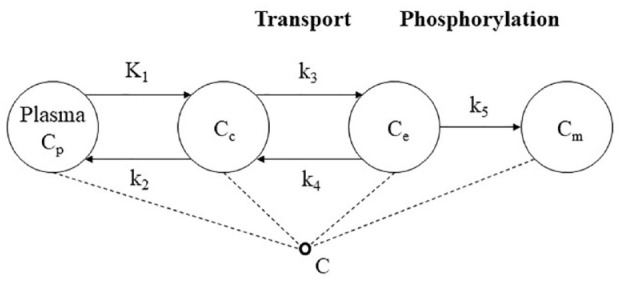
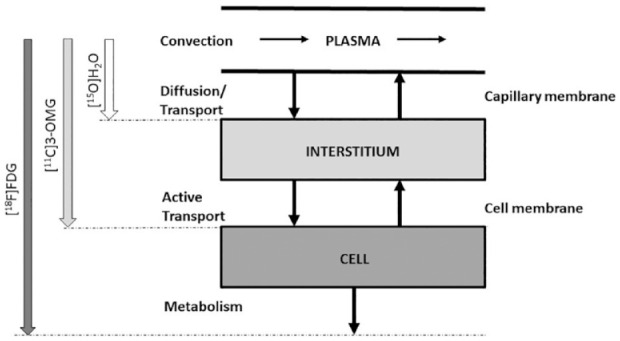
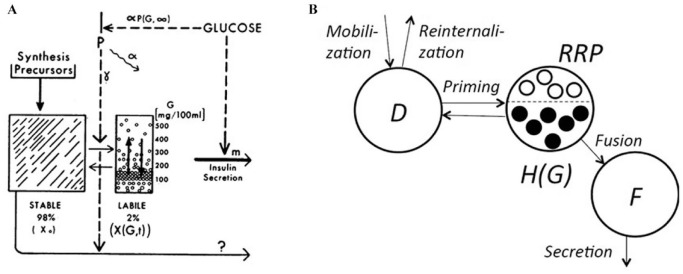
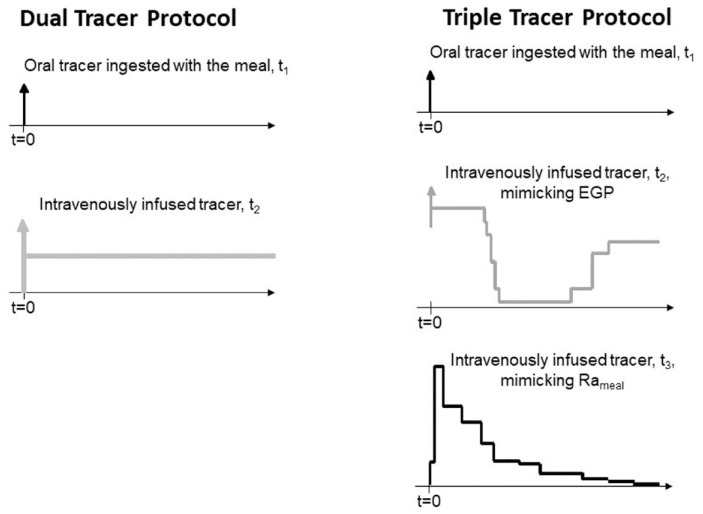
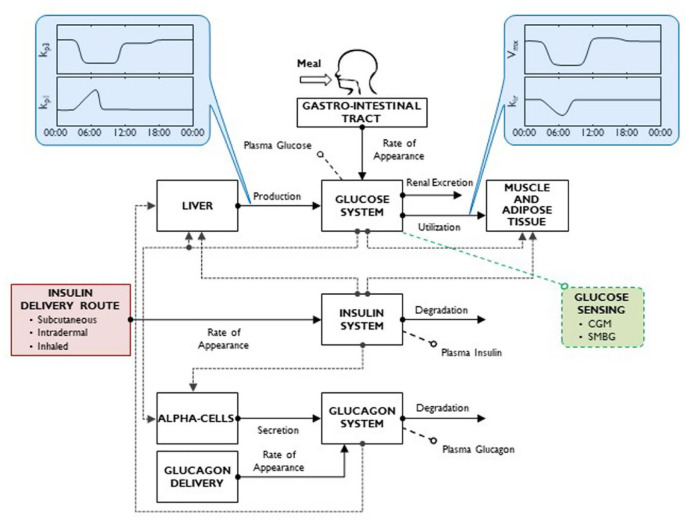
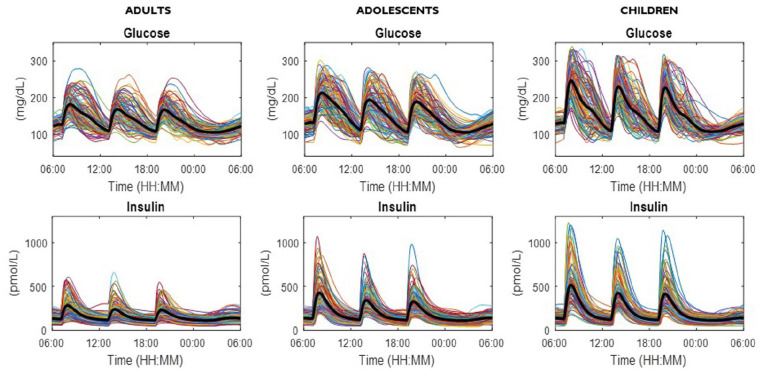
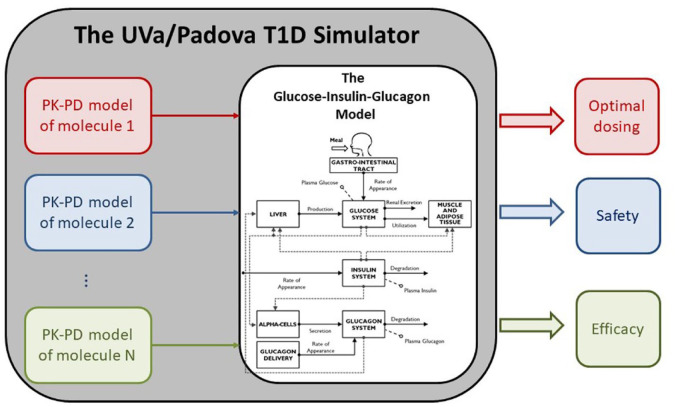
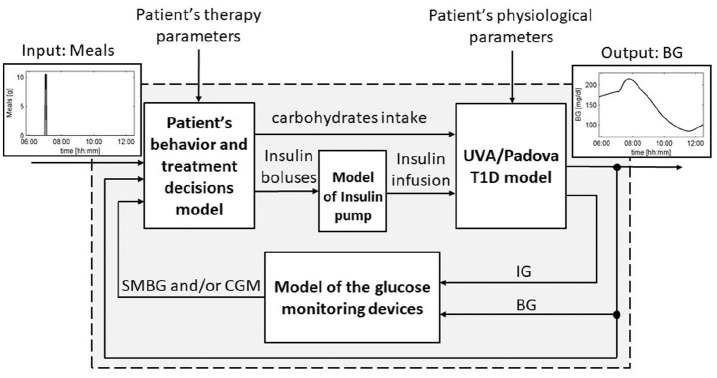
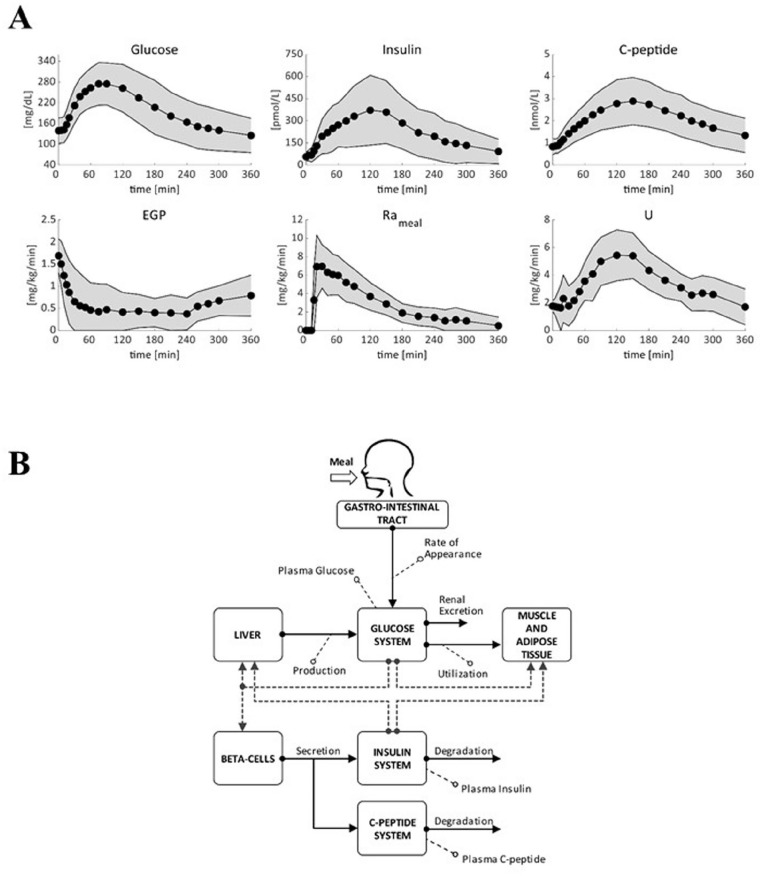
Several models have been proposed to describe the glucose system at whole-body, organ/tissue and cellular level, designed to measure non-accessible parameters (minimal models), to simulate system behavior and run in silico clinical trials (maximal models). Here, we will review the authors' work, by putting it into a concise historical background. We will discuss first the parametric portrait provided by the oral minimal models-building on the classical intravenous glucose tolerance test minimal models-to measure otherwise non-accessible key parameters like insulin sensitivity and beta-cell responsivity from a physiological oral test, the mixed meal or the oral glucose tolerance tests, and what can be gained by adding a tracer to the oral glucose dose. These models were used in various pathophysiological studies, which we will briefly review. A deeper understanding of insulin sensitivity can be gained by measuring insulin action in the skeletal muscle. This requires the use of isotopic tracers: both the classical multiple-tracer dilution and the positron emission tomography techniques are discussed, which quantitate the effect of insulin on the individual steps of glucose metabolism, that is, bidirectional transport plasma-interstitium, and phosphorylation. Finally, we will present a cellular model of insulin secretion that, using a multiscale modeling approach, highlights the relations between minimal model indices and subcellular secretory events. In terms of maximal models, we will move from a parametric to a flux portrait of the system by discussing the triple tracer meal protocol implemented with the tracer-to-tracee clamp technique. This allows to arrive at quasi-model independent measurement of glucose rate of appearance (Ra), endogenous glucose production (EGP), and glucose rate of disappearance (Rd). Both the fast absorbing simple carbs and the slow absorbing complex carbs are discussed. This rich data base has allowed us to build the UVA/Padova Type 1 diabetes and the Padova Type 2 diabetes large scale simulators. In particular, the UVA/Padova Type 1 simulator proved to be a very useful tool to safely and effectively test in silico closed-loop control algorithms for an artificial pancreas (AP). This was the first and unique simulator of the glucose system accepted by the U.S. Food and Drug Administration as a substitute to animal trials for in silico testing AP algorithms. Recent uses of the simulator have looked at glucose sensors for non-adjunctive use and new insulin molecules.
Keywords: diabetes; in silico simulation; insulin action; insulin secretion; multiscale modeling; stabilized tracers.
Conflict of interest statement
Figures
Comment in
-
Comment on "Minimal and Maximal Models to Quantitate Glucose Metabolism: Tools to Measure, to Simulate and to Run in Silico Clinical Trials".J Diabetes Sci Technol. 2022 Sep;16(5):1344-1345. doi: 10.1177/19322968211053884. Epub 2021 Oct 25. J Diabetes Sci Technol. 2022. PMID: 34696629 Free PMC article. No abstract available.
-
Response to Comment on "Minimal and Maximal Models to Quantitate Glucose Metabolism: Tools to Measure, to Simulate and to Run in Silico Clinical Trials".J Diabetes Sci Technol. 2022 Sep;16(5):1346-1347. doi: 10.1177/19322968211060069. Epub 2021 Nov 29. J Diabetes Sci Technol. 2022. PMID: 34839748 Free PMC article. No abstract available.
Similar articles
-
Developing the UVA/Padova Type 1 Diabetes Simulator: Modeling, Validation, Refinements, and Utility.J Diabetes Sci Technol. 2023 Nov;17(6):1493-1505. doi: 10.1177/19322968231195081. Epub 2023 Sep 25. J Diabetes Sci Technol. 2023. PMID: 37743740 Free PMC article. Review.
-
Use of labeled oral minimal model to measure hepatic insulin sensitivity.Am J Physiol Endocrinol Metab. 2008 Nov;295(5):E1152-9. doi: 10.1152/ajpendo.00486.2007. Epub 2008 Sep 2. Am J Physiol Endocrinol Metab. 2008. PMID: 18765681 Free PMC article.
-
The Padova Type 2 Diabetes Simulator from Triple-Tracer Single-Meal Studies: In Silico Trials Also Possible in Rare but Not-So-Rare Individuals.Diabetes Technol Ther. 2020 Dec;22(12):892-903. doi: 10.1089/dia.2020.0110. Epub 2020 May 20. Diabetes Technol Ther. 2020. PMID: 32324063
-
Minimal model estimation of glucose absorption and insulin sensitivity from oral test: validation with a tracer method.Am J Physiol Endocrinol Metab. 2004 Oct;287(4):E637-43. doi: 10.1152/ajpendo.00319.2003. Epub 2004 May 11. Am J Physiol Endocrinol Metab. 2004. PMID: 15138152 Clinical Trial.
-
The oral minimal model method.Diabetes. 2014 Apr;63(4):1203-13. doi: 10.2337/db13-1198. Diabetes. 2014. PMID: 24651807 Free PMC article. Review.
Cited by
-
In Silico Investigation of the Clinical Translatability of Competitive Clearance Glucose-Responsive Insulins.ACS Pharmacol Transl Sci. 2023 Sep 18;6(10):1382-1395. doi: 10.1021/acsptsci.3c00095. eCollection 2023 Oct 13. ACS Pharmacol Transl Sci. 2023. PMID: 37854621 Free PMC article.
-
DI/cle, a Measure Consisting of Insulin Sensitivity, Secretion, and Clearance, Captures Diabetic States.J Clin Endocrinol Metab. 2023 Nov 17;108(12):3080-3089. doi: 10.1210/clinem/dgad392. J Clin Endocrinol Metab. 2023. PMID: 37406246 Free PMC article.
-
Comment on "Minimal and Maximal Models to Quantitate Glucose Metabolism: Tools to Measure, to Simulate and to Run in Silico Clinical Trials".J Diabetes Sci Technol. 2022 Sep;16(5):1344-1345. doi: 10.1177/19322968211053884. Epub 2021 Oct 25. J Diabetes Sci Technol. 2022. PMID: 34696629 Free PMC article. No abstract available.
-
SAAM II: A general mathematical modeling rapid prototyping environment.CPT Pharmacometrics Syst Pharmacol. 2024 Jul;13(7):1088-1102. doi: 10.1002/psp4.13181. Epub 2024 Jun 11. CPT Pharmacometrics Syst Pharmacol. 2024. PMID: 38863172 Free PMC article.
-
Developing the UVA/Padova Type 1 Diabetes Simulator: Modeling, Validation, Refinements, and Utility.J Diabetes Sci Technol. 2023 Nov;17(6):1493-1505. doi: 10.1177/19322968231195081. Epub 2023 Sep 25. J Diabetes Sci Technol. 2023. PMID: 37743740 Free PMC article. Review.
References
-
- Cobelli C, Dalla Man C, Pedersen MG, Bertoldo A, Toffolo G. Advancing our understanding of the glucose system via modeling: a perspective. IEEE Trans Biomed Eng. 2014;61(5):1577-1592. - PubMed
-
- Schoenheimer R. The Dynamic State of Body Constituents. Harvard University Press; 1942.
-
- Bier DM, Leake RD, Haymond MW, et al.. Measurement of “true” glucose production rates in infancy and childhood with 6,6-dideuteroglucose. Diabetes. 1977;26(11):1016-1023. - PubMed
-
- Sheppard CW. The theory of the study of transfer within a multi-compartment system using isotopic tracers. J Appl Physics. 1948;19:70-76.
Publication types
MeSH terms
Substances
LinkOut - more resources
Full Text Sources
Other Literature Sources
Medical
Miscellaneous
