Economic and utilization outcomes of medication management at a large Medicaid plan with disease management pharmacists using a novel artificial intelligence platform from 2018 to 2019: a retrospective observational study using regression methods
- PMID: 34032130
- PMCID: PMC10394210
- DOI: 10.18553/jmcp.2021.21036
Economic and utilization outcomes of medication management at a large Medicaid plan with disease management pharmacists using a novel artificial intelligence platform from 2018 to 2019: a retrospective observational study using regression methods
Abstract
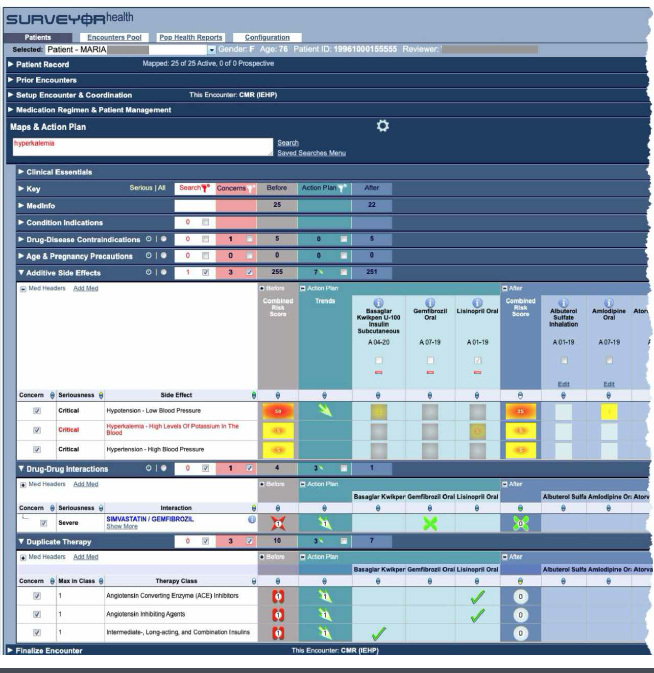
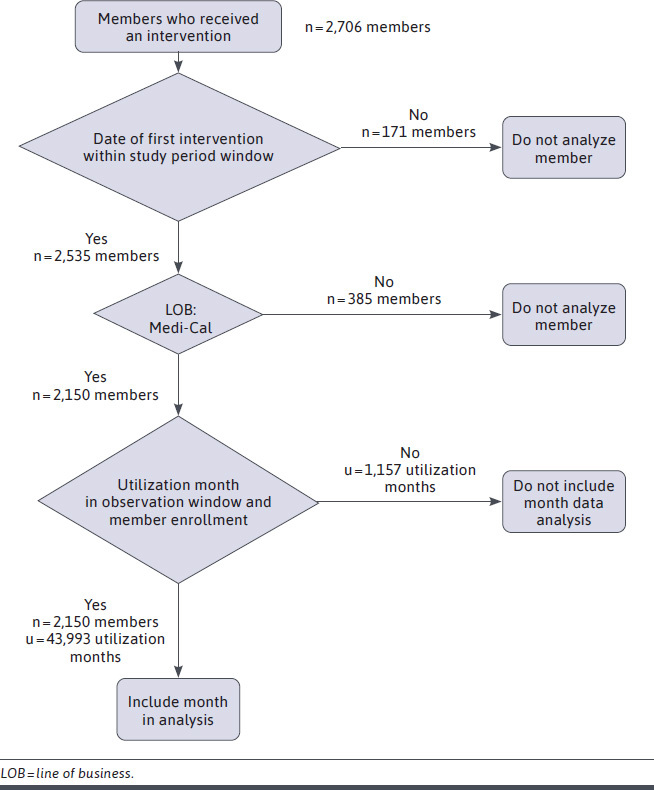
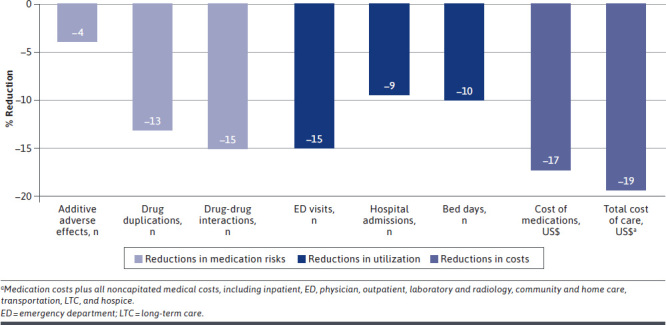
BACKGROUND: Medication therapy management (MTM) and comprehensive medication management (CMM) have been practiced by clinical pharmacists as a predominantly manual activity with interventions documented in a record-keeping system. Program evaluations, largely based on estimations of projected savings and utilization reductions, have not accurately predicted actual claims and utilization changes, leading many to doubt the efficacy of medication management. OBJECTIVE: To assess the impact on actual medical claims of a novel artificial intelligence (AI) platform that identifies members and provides decision support to clinicians in performing telephonic interventions similar to MTM and CMM with high-risk Medicaid members. METHODS: This retrospective observational study used mixed-effects regression models that flexibly account for general trends in cost, as measured by actual claims, to identify the amount of savings and associated impact. To study the economics, total cost of care (TCoC), defined as all medication costs plus all noncapitated medical costs, was evaluated. Utilization was evaluated through the number of emergency department (ED) visits, hospital admissions, bed days, and readmissions. The study included 2,150 predominantly middle-aged (aged 40-64 years) Medicaid members with an average of 10 medications for chronic conditions among an average of 25 total medications. The analysis considered cost and utilization data from August 2017 through April 2019. Interventions occurred between January 2018 and February 2019. RESULTS: Statistically significant correlations were found between receiving interventions and decreased costs and utilization. The economic study found a 19.3% reduction in the TCoC (P < 0.001) that, applied to a preintervention monthly cost of $2,872, yielded a savings of $554 per member per month (PMPM). Medication costs showed a 17.4% reduction (P < 0.001), which, when applied to preintervention cost of $1,110, yielded a savings of $192 PMPM. The utilization study found a 15.1% reduction in ED visits (P = 0.002), a 9.4% reduction in hospital admissions (P = 0.008), and a 10.2% reduction in bed days (P = 0.01). Return on investment is 12.4:1 based on TCoC savings and program costs. CONCLUSIONS: This study evaluated the CMM-Wrap program, which used an advanced AI platform integrated with health plan data, clinical pharmacists trained in disease management, telephonic patient engagement, and closed-loop provider coordination. The results correlate cost and utilization savings with the program. The TCoC savings of $554 PMPM translates to approximately $1.2M a month and more than $14M annually for the 2,150 members in the study. We believe Medicaid and Medicare payment of AI enhanced telephonic CMM services would substantially decrease government health care expenditures, whereas improving health program expansion to Medicaid members with similar risks could save the Health Plan $109M annually. For instance, we estimate that California's Medicaid (Medi-Cal) program could save more than $1B annually by applying the program's observed impact to a similar high-risk cohort (about 1.6%) of Medi-Cal members. Additionally, benefits will accrue to nonmanaged health plans based on the savings themselves. DISCLOSURES: There was no external funding for this study. The program itself was funded by Inland Empire Health Plan. The retrospective study was a collaboration of the 3 partners (Surveyor Health, Inland Empire Health Plan, and Preveon Health) each of which funded its additional costs of preparing the study. Kessler, Mebine, E. Von Schweber, and L. Von Schweber are employed by Surveyor Health. McConnell and Jai are employed by Inland Empire Health Plan. Nguyen, Kiroyan, and Ho are employed by Preveon Health. Desai reports fees from Surveyor Health for work on this study. E. Von Schweber and L. Von Schweber have 2 patents licensed to Surveyor Health: Unified Evaluation, Presentation and Modification of Healthcare Regimens Method and Apparatus for Information Surveying.
Conflict of interest statement
There was no external funding for this study. The program itself was funded by Inland Empire Health Plan. The retrospective study was a collaboration of the 3 partners (Surveyor Health, Inland Empire Health Plan, and Preveon Health) each of which funded its additional costs of preparing the study. Kessler, Mebine, E. Von Schweber, and L. Von Schweber are employed by Surveyor Health. McConnell and Jai are employed by Inland Empire Health Plan. Nguyen, Kiroyan, and Ho are employed by Preveon Health. Desai reports fees from Surveyor Health for work on this study.
E. Von Schweber and L. Von Schweber have 2 patents licensed to Surveyor Health: Unified Evaluation, Presentation and Modification of Healthcare Regimens Method and Apparatus for Information Surveying.
Figures
References
-
- Howard GS. Response-shift bias: a problem in evaluating interventions with pre/post self-reports. Eval Rev. 1980;4(1):93-106.
-
- Lindstrom M, Bates D. Newton-Raphson and EM algorithms for linear mixed-effects models for repeated-measures data. J Am Stat Assoc. 1988;83(404):1014-22. doi:10.2307/2290128
-
- Statsmodels.org. Statsmodels v0.12.2: statsmodels.formula.api.mixedlm API. Updated February 2, 2021. Accessed May 7, 2021. https://www.statsmodels.org/stable/generated/statsmodels.formula.api.mix...
-
- Statsmodels.org. Linear mixed effects models: comparing R imer to Statsmodels MixedLM. March 25, 2021. Accessed May 7, 2021. https://www.statsmodels.org/devel/examples/notebooks/generated/mixed_lm_...
-
- Aickin M, Gensler H. Adjusting for multiple testing when reporting research results: the Bonferroni vs Holm methods. Am J Public Health. 1996;86(5):726-28. doi.org/10.2105/ajph.86.5.726 - PMC - PubMed
Publication types
MeSH terms
LinkOut - more resources
Full Text Sources
Other Literature Sources
Medical
Miscellaneous