. 2021 May 15;148(10):dev197475.
doi: 10.1242/dev.197475. Epub 2021 May 25.

Postnatal prolongation of mammalian nephrogenesis by excess fetal GDNF

Affiliations

Postnatal prolongation of mammalian nephrogenesis by excess fetal GDNF

Hao Li et al. Development. .

Abstract

Nephron endowment, defined during the fetal period, dictates renal and related cardiovascular health throughout life. We show here that, despite its negative effects on kidney growth, genetic increase of GDNF prolongs the nephrogenic program beyond its normal cessation. Multi-stage mechanistic analysis revealed that excess GDNF maintains nephron progenitors and nephrogenesis through increased expression of its secreted targets and augmented WNT signaling, leading to a two-part effect on nephron progenitor maintenance. Abnormally high GDNF in embryonic kidneys upregulates its known targets but also Wnt9b and Axin2, with concomitant deceleration of nephron progenitor proliferation. Decline of GDNF levels in postnatal kidneys normalizes the ureteric bud and creates a permissive environment for continuation of the nephrogenic program, as demonstrated by morphologically and molecularly normal postnatal nephron progenitor self-renewal and differentiation. These results establish that excess GDNF has a bi-phasic effect on nephron progenitors in mice, which can faithfully respond to GDNF dosage manipulation during the fetal and postnatal period. Our results suggest that sensing the signaling activity level is an important mechanism through which GDNF and other molecules contribute to nephron progenitor lifespan specification.

Keywords: Differentiation; Kidney; Mouse; Nephrogenesis; Nephron progenitors.


Conflict of interest statement

Competing interests The authors declare no competing or financial interests.

Figures
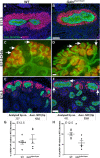
Fig. 1.
Fig. 1.
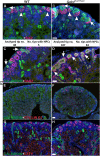
Nephron progenitors get depleted in embryonic Gdnfhyper/hyper kidneys. (A,B) Nephron progenitor (NP) marker SIX2 (red) localizes to mesenchyme capping ureteric bud (UB) tips (calbindin, green) in WT (A; n=4 kidneys) and Gdnfhyper/hyper (B; n=5 kidneys) kidneys at E11.5. (C,D) E12.5 WT (C) and Gdnfhyper/hyper (D) kidneys cultured in vitro for 24 h and stained for SIX2 (red) to visualize NP population and calbindin (green) for UB (n=10 kidneys/treatment, three independent experiments). (E,F) NPs are abundant in E14.5 WT kidney (E; 42.6/tip), whereas in Gdnfhyper/hyper kidney NPs are clearly reduced (F; arrows, 29.8/tip) (n=207 for WT and 431 for Gdnfhyper/hyper tips analyzed in nine kidneys/genotype). White arrows point to the NP cells (red). (G) Analysis of SIX2-positive NP amount in WT and Gdnfhyper/hyper kidneys shows comparable initial NP pools at E12.5. Data are presented as mean quantity of SIX2-positive NPs±s.e.m. compared with those of WT littermates, which are set to 100% and reflect the results obtained from four independent litters (WT: 100±15.61%, n=6; Gdnfhyper/hyper: 124.74±33.89%, n=5; P=0.533, two-tailed t-test in SPSS). (H) Proportion of proliferating SIX2-positive NPs in Gdnfhyper/hyper kidneys at E12.5 shows a significant decrease when compared with WT kidney. Data are presented as mean proportion of proliferating SIX2-positive NPs±s.e.m. compared with those of WT littermates which are set to 100% and reflect the results obtained from three independent litters (WT: 100±9.04%, n=5; Gdnfhyper/hyper: 56.94±12.67%, n=5; *P=0.024, two-tailed t-test in SPSS). Scale bars: 100 µm.
Fig. 2.
Fig. 2.
Effect of excess GDNF on embryonic nephrogenesis. (A) LEF1 (red), a marker of pretubular aggregates, distal renal vesicles and S-shaped bodies, in WT E14.5 kidney. (B) E14.5 Gdnfhyper/hyper kidney shows very few LEF1-positive differentiating nephron precursors and typical abundance of ureteric bud (UB) epithelium as detected by calbindin staining (green). (C) Cyclin D1 (red) stains all precursors of differentiating nephrons (asterisks mark pretubular aggregates and comma-shaped bodies, arrows point to S-shaped bodies), which can be observed abundantly next to UB epithelium (green) in E14.5 WT kidney. (D) Significantly fewer differentiating nephron precursors are detected in E14.5 Gdnfhyper/hyper kidney. (E,F) Cyclin D1 (red) localization in E16.5 WT (E) and Gdnfhyper/hyper (F) kidneys. Calbindin (green) staining visualizes UB epithelium in all images. For each staining at given stage n=3 kidneys/genotype. Scale bar: 100 µm.
Fig. 3.
Fig. 3.
Nephron differentiation at the cessation of renal morphogenesis. (A) P3 WT kidney has lost cortical SIX2-positive nephron progenitors (NP) as shown by the loss of cells in the cap mesenchyme (arrow). Instead, SIX2 localizes to lateral mesenchyme and early nephron precursors (arrowheads). Quantification of 48 NP niches (analyzed tip numbers) revealed only five niches with NPs. (B) Cap mesenchyme positive for SIX2 is still present in Gdnfhyper/hyper kidney at P3 (arrows). Quantification of 107 NP niches (analyzed tip numbers) revealed 63 niches with NP cells. (C,D) PAX2 (red) and calbindin (green) staining in WT (C) and Gdnfhyper/hyper (D) kidneys at P3. Arrows point to the position where NP cells are maintained in Gdnfhyper/hyper kidneys. (E,F) Comparable amount of cyclin D1-positive (red) nephron precursors in P3 WT (E) and Gdnfhyper/hyper (F) kidneys. (G,H) Visualization of LEF1-positive nephron precursors (red) and ureteric epithelium (green) reveals similar ongoing nephrogenesis in WT (G) and Gdnfhyper/hyper (H) kidneys. For each staining n=3 kidneys/genotype. Scale bars: 100 µm.
Fig. 4.
Fig. 4.
Nephron progenitors are persistently sustained in the postnatal Gdnfhyper/hyper kidneys. (A,B) Localization of nephron progenitor (NP) marker SIX2 (red) in WT at P4 (A) and P6 (B) shows loss of NPs in WT kidneys in which SIX2 is found only in weakly positive renal vesicles (asterisks). (C) In Gdnfhyper/hyper kidneys at P4 SIX2 localizes also to NPs capping the ureteric bud (green) tips (arrows) (n=315 tips in WT and 245 in Gdnfhyper/hyper analyzed in four kidneys/genotype). (D) Localization of SIX2 (red) and calbindin (green) in P6 Gdnfhyper/hyper kidneys reveals the persistence of committed NP cells (13; * indicates differentiating nephrons) in the mutant kidney (n=3 kidneys/genotype). Quantification of NP cell niches showed very few tips, which did not have any SIX2-positive NPs in WT kidneys, whereas 81% of niches in Gdnfhyper/hyper kidneys (n=2, 16 niches) were accompanied with SIX2-positivity in committed and differentiating nephron precursors. Scale bar: 100 µm.
Fig. 5.
Fig. 5.
Sustained cortical proliferation in postnatal Gdnfhyper/hyper kidneys. (A,B) Ki67 staining in P4 WT (A) and Gdnfhyper/hyper (B) kidneys shows similar pattern of proliferative cells in the cortical kidneys (red arrows) of both genotypes. (C,D) In P5 WT kidneys (C) Ki67-positivity is significantly reduced in the cortex (red arrow), whereas Gdnfhyper/hyper kidneys (D) still exhibit focally very high proliferation (red arrows). (E,F) Proliferation in the WT cortical kidney (E) is further diminished at P6, whereas it remains highly active in Gdnfhyper/hyper kidneys (F). (G,H) Ki67-positive proliferative cells localize to medullar renal tubules (black arrow) in P7 WT kidneys (G) but active proliferation is still detected in cortical differentiating nephron structures (red arrows) of Gdnfhyper/hyper kidneys (H). For each postnatal stage, n=3 kidneys/genotype. Scale bar: 1 mm.
Fig. 6.
Fig. 6.
Formation of new nephrons occurs until P7 only in Gdnfhyper/hyper kidneys. (A,B) Nephron precursor marker LEF1 (red) in WT (A) and Gdnfhyper/hyper (B) kidneys at P4 demonstrates ongoing nephrogenesis in both genotypes (arrows) (n=2 kidneys/genotype). (C,D) P5 WT kidneys (C) show very few LEF1-positive cells in cortex, whereas ample nephrogenesis is detected in Gdnfhyper/hyper kidneys (D; arrows; n=4 kidneys/genotype). (E,F) LEF1 is no longer present in the cortex of WT kidneys at P6 (E), whereas plentiful nephron precursors are still detected in Gdnfhyper/hyper kidneys (F) (n=3 kidneys/genotype). (G) Cyclin D1 (white) and JAG1 (red) localize to differentiated distal tubules of nephron (yellow arrow and arrowhead) in P7 WT kidney (n=3 kidneys). (H) In P7 Gdnfhyper/hyper kidneys cyclin D1 and JAG1 localize to comma-shaped (arrowhead) and S-shaped (arrow) bodies of nephron precursors in the cortical differentiation zone, thus showing sustained nephrogenesis at this late postnatal stage (n=3 kidneys). Scale bars: 100 µm.
Fig. 7.
Fig. 7.
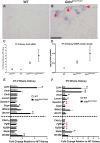
Expression analysis of the crucial renal development regulators. (A) In situ hybridization assay of Gdnf at P4 is unable to detect any transcripts in WT kidney (n=3 kidneys). (B) Gdnf expression is maintained in P4 Gdnfhyper/hyper kidney and localizes to cortical differentiation zone in which nephron progenitors are maintained (red arrows) owing to excess GDNF (n=3 kidneys). (C) qRT-PCR analysis of Gdnf transcripts in Gdnfwt/ko, WT, Gdnfwt/hyper and Gdnfhyper/hyper kidneys at P7 (n=3 kidneys/genotype). Gdnf expression in Gdnfhyper/hyper kidneys is significantly higher than in WT (P=0.036) and Gdnfwt/ko (P=0.038) (mean±s.e.m., two-tailed t-test in SPSS). (D) ELISA analysis of GDNF protein levels in P7 kidneys (n=5 kidneys/genotype) (mean±s.e.m.). (E,F) qRT-PCR based quantification of the relative expression levels of the selected genes at E14 (E) and at P5 (F) (n=3 kidneys/genotype at given stage). The UB-derived secreted GDNF targets are listed above the dashed line, whereas other known nephrogenesis regulators are presented below the line. Gdnfhyper/hyper kidneys show significant upregulation of Crlf1 (*P=0.019), Srgn (*P=0.021), Wnt11 (**P=0.001) and Wnt9b (**P=0.01) at E14, whereas at P5, significantly increased gene expressions include Crlf1 (**P=0.009), Etv4 (**P=0.000), Etv5 (*P=0.03), Lama1 (*P=0.014) and Wnt4 (*P=0.026). In contrast, the transcription of Sostdc1 (**P=0.000), Fgf9 (**P=0.001) and Fgf20 (**P=0.001) is significantly decreased in Gdnfhyper/hyper kidneys at P5. Scale bar: 100 µm.
Fig. 8.
Fig. 8.
Genetic decrease of Wnt11 level partially rescues nephron progenitor loss in Gdnfhyper/hyper kidneys. (A) SIX2-positive nephron progenitors (NP, red) are sparse in E14.5 Gdnfhyper/hyper kidneys (average of 29.8 NPs/tip in 552 tips analyzed in nine kidneys). (B) Gdnfhyper/hyper;Wnt11+/− kidneys show an increase in general abundance of NPs per niche in the absence of one Wnt11 allele (average of 40.7 NPs/tip in 107 tips analyzed in four kidneys). (C,D) PAX2-positive cells in Gdnfhyper/hyper (C) and Gdnfhyper/hyper;Wnt11+/− (D) kidneys show similar patterns and amount at E14.5. (E-H) At P0, SIX2 staining demonstrates an improvement in NP numbers by the removal of one Wnt11 allele (average of 20.3 NPs/tip in 610 Gdnfhyper/hyper tips versus average of 30.9 NPs/tip in Gdnfhyper/hyper;Wnt11+/− tips analyzed in six kidneys/genotype), which is supported by PAX2 staining. Distribution of SIX2-positive NPs (A′,B′,E′,F′) and PAX2-positive cells (C′,D′,G′,H′) are shown without calbindin (green) signal, which depicts the UB epithelium in all kidneys. Scale bars: 200 µm.
Fig. 9.
Fig. 9.
Schematic of the effects of excess GDNF on developing mouse kidney. (A) In embryonic kidney undergoing active growth, the nephron progenitor cells (NPC, red) receive secreted guidance signals (e.g. Wnt11 and Wnt9b) from ureteric bud tips (UBT, dark blue) to control the balance of NP proliferation and self-renewal and their differentiation into pretubular aggregates (PA, pink cell cluster). (B) In postnatal kidneys, the tip identity of the UB (UB, light blue) is lost, as molecularly evidenced by the decline in the expression of e.g. Wnt9b, Wnt11, Crlf1 and Etv4/5, indicated by thin red letters. Gradual loss of the UB-derived secreted factors (Wnt9b, Wnt11 and Crlf1) contributes to the wane of the NP proliferation and self-renewal. Concomitantly, GDNF and FGF levels decrease, which coincides with accelerated NP differentiation. These together deplete the NP pool quickly resulting in cessation of nephrogenesis. (C) Excess GDNF in embryonic kidneys induces abnormal UBT morphology and augments expression of the bud-derived, secreted regulatory molecules (Crlf1, Srgn, Wnt11 and Wnt9b). Excess expression of bud-derived secreted molecules has an inhibitory effect on the NP cell cycle resulting in reduced proliferation and self-renewal. Drop in overall NP numbers slows down PA differentiation, as detected by diminished Wnt4 expression. (D) In the postnatal kidneys, the UBT morphology, and thus the niche it provides for the NPs, normalizes despite the higher than WT expression of bud-derived secreted targets (Crlf1, Etv4/5 and Lama1). Together with normalized Wnt9b and Wnt11 (not shown), these molecular changes subsidize normal NP proliferation, self-renewal and differentiation, as evidenced by the maintenance of a large NP population, higher Wnt4 expression and similar amount of nephron precursors (pink clusters of cells) as in WT embryonic kidneys. Through such mechanisms, constitutive GDNF excess under its own promoter enables the nephrogenic program to continue until P7. Dark gray text, non-changed expression; red text, decreased expression; green text, increased expression.

References

    1. Alexander, W. S., Rakar, S., Robb, L., Farley, A., Willson, T. A., Zhang, J.-G., Hartley, L., Kikuchi, Y., Kojima, T., Nomura, H.et al. (1999). Suckling defect in mice lacking the soluble haemopoietin receptor NR6. Curr. Biol. 9, 605-608. 10.1016/S0960-9822(99)80266-8 - DOI - PubMed
    1. Barak, H., Huh, S.-H., Chen, S., Jeanpierre, C., Martinovic, J., Parisot, M., Bole-Feysot, C., Nitschké, P., Salomon, R., Antignac, C.et al. (2012). FGF9 and FGF20 maintain the stemness of nephron progenitors in mice and man. Dev. Cell 22, 1191-1207. 10.1016/j.devcel.2012.04.018 - DOI - PMC - PubMed
    1. Bertram, J. F., Douglas-Denton, R. N., Diouf, B., Hughson, M. D. and Hoy, W. E. (2011). Human nephron number: implications for health and disease. Pediatr. Nephrol. 26, 1529-1533. 10.1007/s00467-011-1843-8 - DOI - PubMed
    1. Boyle, S., Misfeldt, A., Chandler, K. J., Deal, K. K., Southard-Smith, E. M., Mortlock, D. P., Baldwin, H. S. and de Caestecker, M. (2008). Fate mapping using Cited1-CreERT2 mice demonstrates that the cap mesenchyme contains self-renewing progenitor cells and gives rise exclusively to nephronic epithelia. Dev. Biol. 313, 234-245. 10.1016/j.ydbio.2007.10.014 - DOI - PMC - PubMed
    1. Brodbeck, S., Besenbeck, B. and Englert, C. (2004). The transcription factor Six2 activates expression of the Gdnf gene as well as its own promoter. Mech. Dev. 121, 1211-1222. 10.1016/j.mod.2004.05.019 - DOI - PubMed

Publication types

MeSH terms

LinkOut - more resources