. 2022 Jan;18(1):88-102.
doi: 10.1002/alz.12369. Epub 2021 May 25.

Large-scale plasma proteomic profiling identifies a high-performance biomarker panel for Alzheimer's disease screening and staging

Affiliations

Large-scale plasma proteomic profiling identifies a high-performance biomarker panel for Alzheimer's disease screening and staging

Yuanbing Jiang et al. Alzheimers Dement. 2022 Jan.

Abstract

Introduction: Blood proteins are emerging as candidate biomarkers for Alzheimer's disease (AD). We systematically profiled the plasma proteome to identify novel AD blood biomarkers and develop a high-performance, blood-based test for AD.

Methods: We quantified 1160 plasma proteins in a Hong Kong Chinese cohort by high-throughput proximity extension assay and validated the results in an independent cohort. In subgroup analyses, plasma biomarkers for amyloid, tau, phosphorylated tau, and neurodegeneration were used as endophenotypes of AD.

Results: We identified 429 proteins that were dysregulated in AD plasma. We selected 19 "hub proteins" representative of the AD plasma protein profile, which formed the basis of a scoring system that accurately classified clinical AD (area under the curve = 0.9690-0.9816) and associated endophenotypes. Moreover, specific hub proteins exhibit disease stage-dependent dysregulation, which can delineate AD stages.

Discussion: This study comprehensively profiled the AD plasma proteome and serves as a foundation for a high-performance, blood-based test for clinical AD screening and staging.

Keywords: Alzheimer's disease; biomarker panel; diagnosis; disease staging; neurodegenerative disease; plasma proteome; prognosis.


Conflict of interest statement

H.Z. has served on scientific advisory boards for Denali, Roche Diagnostics, Wave, Samumed, Siemens Healthineers, Pinteon Therapeutics, and CogRx; has given lectures in symposia sponsored by Fujirebio, AlzeCure, and Biogen; and is a cofounder of Brain Biomarker Solutions (BBS) of Gothenburg AB, which is part of the GU Ventures Incubator Program (outside submitted work). All other authors declare no conflicts of interest.

Figures
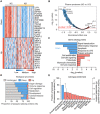
FIGURE 1
FIGURE 1
Alteration of the plasma proteome in patients with Alzheimer's disease (AD). A, Heatmap of the levels of the top 15 down‐ and upregulated AD‐associated plasma proteins (i.e., those with the lowest P‐values) in healthy controls (HCs) and patients with AD. B, Volcano plot showing the associations among 1160 plasma proteins. Blue and red dots indicate proteins in patients with AD that were down‐ or upregulated compared to HCs, respectively. Dot size is proportional to the P‐value (in log10 scale), and the top five down‐ and upregulated plasma proteins are labeled. C, Representative Gene Ontology (GO) terms of the AD‐associated plasma proteins. The GO terms of the down‐ and upregulated plasma proteins are indicated in blue and red, respectively. D, Proportions of the unchanged (gray), downregulated (blue), and upregulated (red) plasma proteins in each biological category. E, Cell sources of AD‐associated plasma proteins. The left and right Y‐axes denote the fractions of expressed AD‐associated plasma proteins (bars) and numbers of cell‐type‐specific, AD‐associated plasma proteins (black line), respectively, among the 11 major peripheral blood cell types (red) or in the overall peripheral blood system (blue). NK cells, natural killer cells; LPS, lipopolysaccharide
FIGURE 2
FIGURE 2
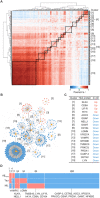
Identification of Alzheimer's disease (AD)‐associated plasma hub proteins. A, Heatmap showing the pairwise correlations among AD‐associated plasma proteins. Each row and column represent 1 of the 429 AD‐associated plasma proteins. Red and blue indicate positive and negative correlations between protein pairs, respectively. Black squares denote the 19 protein clusters based on hierarchical clustering, and numbers in brackets on the right indicate the cluster number. B, Correlation network plot of the AD‐associated plasma hub proteins. Numbers in brackets adjacent to the clusters indicate the corresponding cluster number. Dot size is proportional to the P‐value (in the log10 scale). Yellow dots denote the 19 plasma hub proteins, and blue and red dots indicate proteins in patients with AD that were down‐ and upregulated compared to healthy controls (HCs), respectively. Edges represent pairwise correlations between individual AD‐associated plasma proteins and plasma hub proteins, and line thickness is proportional to the correlation coefficient. C, The 19 plasma hub proteins identified in each cluster. Red and blue indicate the up‐ and downregulated plasma hub proteins, respectively. D, Correlations between 429 AD‐associated plasma proteins and the plasma ATN biomarkers (i.e., amyloid‐beta [Aβ]42/40 ratio, tau level, and neurofilament light polypeptide [NfL] level). Each row represents a plasma ATN biomarker, and each column represents 1 of the 429 AD‐associated plasma proteins. Red and blue indicate significant (P < 0.05) and nonsignificant correlations (P > 0.05) between the protein pairs, respectively. Squares denote categories based on the correlations with the plasma ATN biomarkers, the corresponding numbers above indicate the number of plasma proteins in each category, and the plasma hub proteins are listed below
FIGURE 3
FIGURE 3
Alzheimer's disease (AD) classification based on the plasma ATN biomarkers and the 19‐protein biomarker panel. A, Receiver operating characteristic (ROC) curves showing the AD classification results based on the plasma levels of candidate protein biomarkers. The classification results of the models integrating the plasma ATN biomarkers (i.e., plasma amyloid‐beta [Aβ]42/40 ratio, plasma tau level, and plasma neurofilament light polypeptide [NfL] level; yellow), the 19‐protein biomarker panel (blue), and the plasma ATN biomarkers plus the 19‐protein biomarker panel (red) in the Hong Kong Chinese AD discovery cohort. B, Bar chart showing the areas under the ROC curves (AUCs) according to the three AD classification models in the Hong Kong Chinese AD discovery cohort (AUC = 0.8735, 0.9816, and 0.9891 for ATN, 19 proteins, and ATN + 19 proteins, respectively). Data are mean ± standard error of the mean (ATN vs. 19 proteins: Z = 3.653, ATN vs. ATN + 19 proteins: Z = 3.991). C, Distribution of AD classification scores stratified by phenotype (n = 71 healthy controls [HCs], = 101 patients with AD). The AD severity levels were designated according to the distribution of AD classification scores (normal, <0.3; mild, 0.3–0.8; severe, > 0.8). D–G, Associations between individual designated AD severity levels and AD‐associated endophenotypes in the Hong Kong Chinese AD discovery cohort. Data are presented as box‐and‐whisker plots including maximum, 75th percentile, median, 25th percentile, and minimum values; plus signs (+) denote the corresponding mean values. D, Associations between individual cognitive performance indicated by Montreal Cognitive Assessment (MoCA) score and designated AD severity levels (n = 64, 17, and 91 for normal, mild, and severe levels, respectively; T = −2.396, −16.92, and −7.119 for normal vs. mild, normal vs. severe, and mild vs. severe, respectively). E, F, Associations between designated AD severity levels and brain volumetric data (n = 50, 12, and 47 for normal, mild, and severe levels, respectively). E, Hippocampal volume comparison (T = −2.397, −7.714, and −2.310 for normal vs. mild, normal vs. severe, and mild vs. severe, respectively). F, Gray matter volume comparison (T = −5.110 for normal vs. severe). G, Association between white blood cell counts and designated AD severity levels (n = 42, 8, and 51 for normal, mild, and severe levels, respectively; T = 2.734 for normal vs. severe; *P < 0.05, **P < 0.01, ***P < 0.001)
FIGURE 4
FIGURE 4
Validation of the 19‐protein biomarker panel in an independent cohort. A, Pipeline for the establishment and evaluation of the integrative model based on the 19‐protein biomarker panel. B–G, Individual plasma levels of KLK4 (B), LIF‐R (C), CASP‐3 (D), NELL1 (E), CD164 (F), and LYN (G) stratified according to Alzheimer's disease (AD) phenotype in the Hong Kong Chinese AD validation cohort. Data are presented as box‐and‐whisker plots including maximum, 75th percentile, median, 25th percentile, and minimum values; plus signs (+) denote corresponding mean values (n = 61 healthy controls [HCs], n = 36 patients with AD; T = 4.315, 2.296, −2.887, −3.383, −2.983, and −2.501 for KLK4, LIF‐R, CASP‐3, NELL1, CD164, and LYN, respectively). H, Receiver operating characteristic (ROC) curves and corresponding areas under the curve (AUCs) showing the performance of the models integrating the plasma ATN biomarkers (blue, AUC = 0.8871) and the 19‐protein biomarker panel (red, AUC = 0.9690) for AD classification in the Hong Kong Chinese AD validation cohort. Data are mean ± standard error of the mean (Z = 2.034). I, Distribution of AD classification scores stratified by phenotype (n = 61 HCs, n = 36 patients with AD in the Hong Kong Chinese AD validation cohort). Three designated AD severity levels (normal, <0.3; mild, 0.3–0.8; severe, > 0.8) are indicated. J, Association between the individual Montreal Cognitive Assessment (MoCA) scores and designated AD severity levels (n = 52, 14, and 25 for normal, mild, and severe, respectively; T = −4.621, −10.46, and −3.085 for normal vs. mild, normal vs. severe, and mild vs. severe, respectively; *P < 0.05, **P < 0.01, ***P < 0.001)
FIGURE 5
FIGURE 5
Performance of the 19‐protein biomarker panel for classifying Alzheimer's disease (AD) with tau pathology. A, Individual plasma P‐tau181 levels stratified by AD phenotype in the Hong Kong Chinese AD discovery and validation cohorts (discovery cohort: n = 50 healthy controls [HCs], n = 97 patients with AD; validation cohort: = 54 HCs, = 18 patients with AD; T = 7.412 and 8.431 for the tests in discovery and validation cohort, respectively). B, Distribution of plasma phosphorylated tau (p‐tau)181 levels stratified by AD phenotype (n = 104 HCs, = 115 patients with AD in the Hong Kong Chinese AD combined cohort). Individuals with plasma p‐tau181 levels ≤2.55 or > 2.55 pg/mL were classified as p‐tau181–negative (p‐tau) and p‐tau181–positive (p‐tau+), respectively. C, Proportions of p‐tau (blue) and p‐tau+ (red) individuals stratified by AD severity levels determined by the 19‐protein model in the discovery (left), validation (middle), and combined (right) cohorts. D, Receiver operating characteristic (ROC) curves showing the performance of the 19‐protein biomarker panel for AD classification in the p‐tau181–stratified Hong Kong Chinese AD discovery (yellow), validation (blue), and combined (red) cohorts. E, Areas under the ROC curves (AUCs) of the 19‐protein model in the Hong Kong Chinese AD discovery, validation, and combined overall cohorts as well as p‐tau181–stratified cohorts
FIGURE 6
FIGURE 6
Alzheimer's disease (AD) stage‐dependent dysregulation of seven plasma hub proteins. Correlations between the plasma levels of NELL1, CETN2, hK14, LYN, PRKCQ, LIF‐R, and KLK4 and cognitive decline indicated by Montreal Cognitive Assessment (MoCA) scores (left) as well as tau pathology indicated by plasma phosphorylated tau (p‐tau)181 level (right) in the Hong Kong Chinese AD discovery cohort. Red splines denote the locally weighted scatterplot smoothing (LOWESS) fit lines of corresponding proteins, and vertical dashed lines indicate the inflection points. r 2, Pearson's correlation coefficient; 2ˆNPX, linear form of normalized protein expression

Similar articles

Cited by

References

    1. McKhann GM, Knopman DS, Chertkow H, et al. The diagnosis of dementia due to Alzheimer's disease: recommendations from the National Institute on Aging‐Alzheimer's Association workgroups on diagnostic guidelines for Alzheimer's disease. Alzheimer's & Dementia. 2011;7:263‐269. - PMC - PubMed
    1. Jack Jr CR, Bennett DA, Blennow K, et al. NIA‐AA research framework: toward a biological definition of Alzheimer's disease. Alzheimer's & Dementia. 2018;14:535‐562. - PMC - PubMed
    1. Molinuevo JL, Ayton S, Batrla R, et al. Current state of Alzheimer's fluid biomarkers. Acta Neuropathol (Berl). 2018;136:821‐853. - PMC - PubMed
    1. Nakamura A, Kaneko N, Villemagne VL, et al. High performance plasma amyloid‐β biomarkers for Alzheimer's disease. Nature. 2018;554:249. - PubMed
    1. Preische O, Schultz SA, Apel A, et al. Serum neurofilament dynamics predicts neurodegeneration and clinical progression in presymptomatic Alzheimer's disease. Nat Med. 2019;25:277‐283. - PMC - PubMed

Publication types