

Type II collagen-positive embryonic progenitors are the major contributors to spine and intervertebral disc development and repair
- PMID: 34032373
- PMCID: PMC8459639
- DOI: 10.1002/sctm.20-0424
Type II collagen-positive embryonic progenitors are the major contributors to spine and intervertebral disc development and repair
Abstract
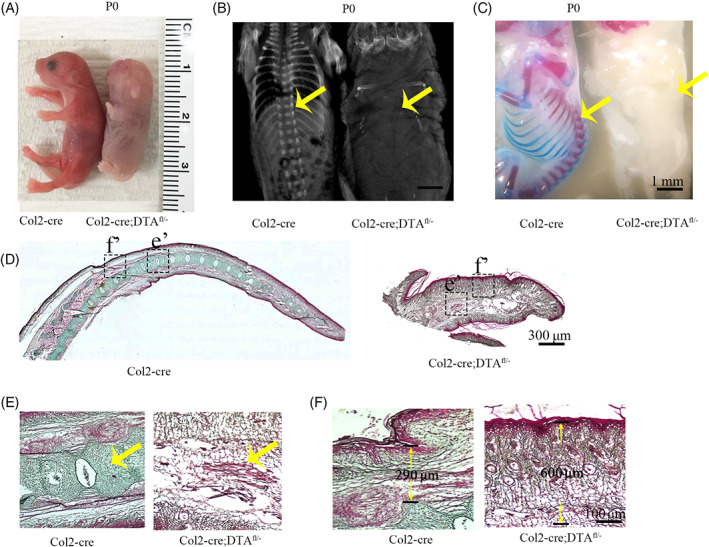
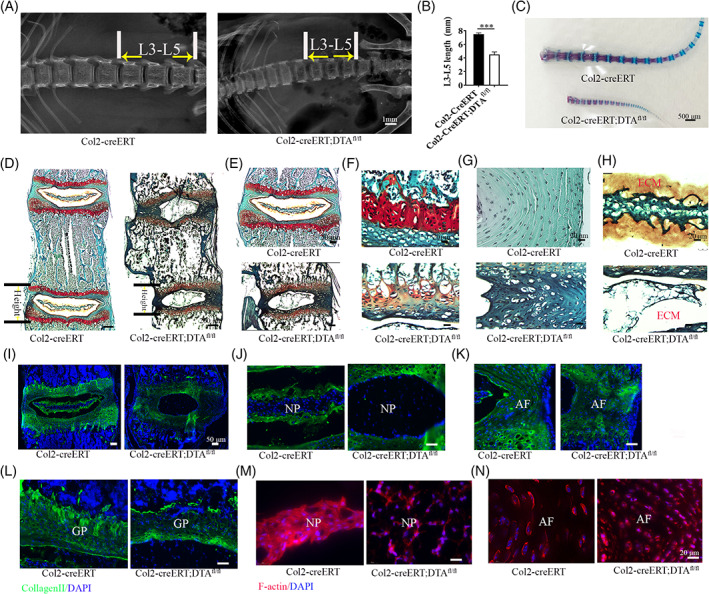
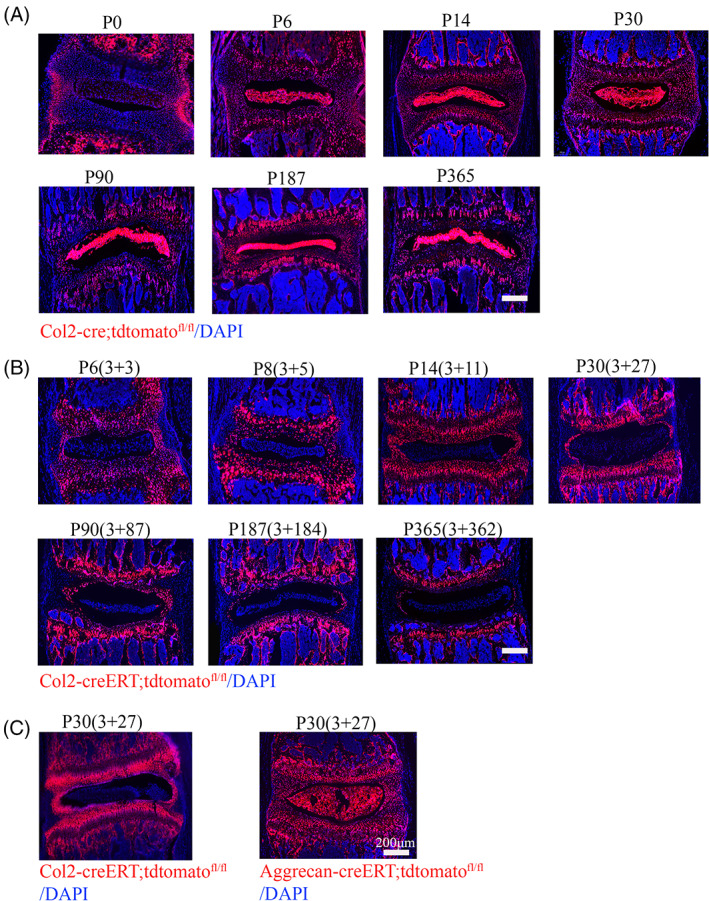
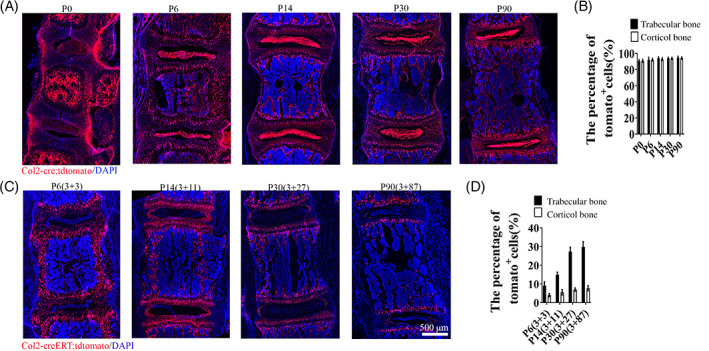
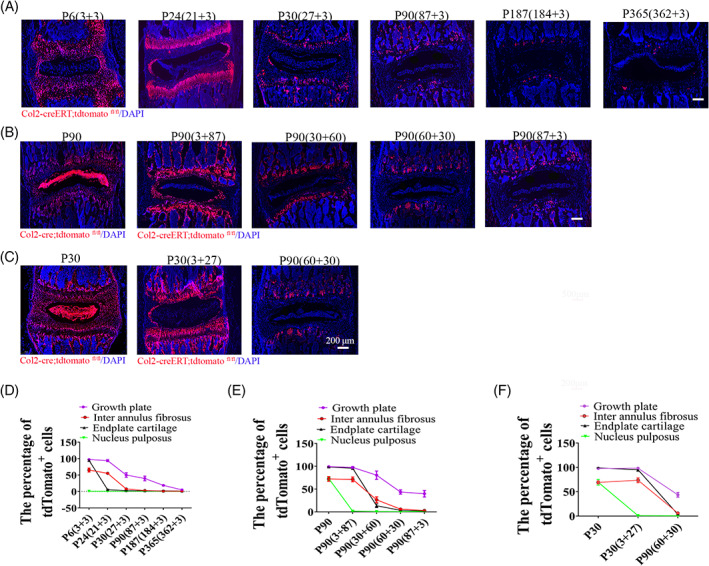
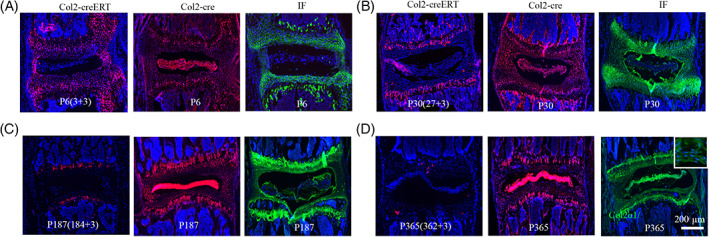
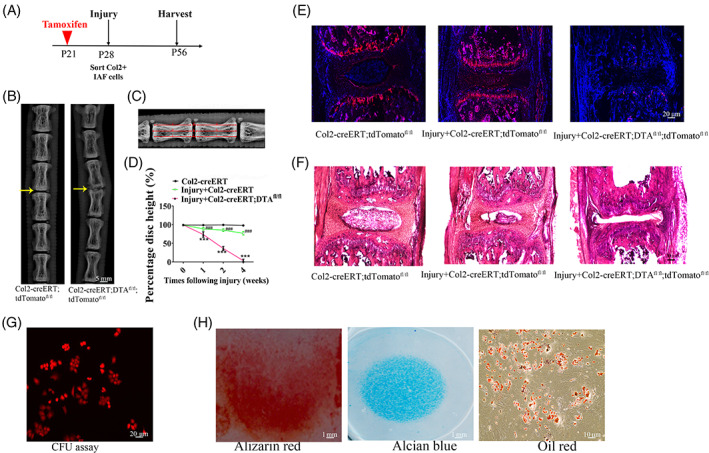
Basic mechanism of spine development is poorly understood. Type II collagen positive (Col2+) cells have been reported to encompass early mesenchymal progenitors that continue to become chondrocytes, osteoblasts, stromal cells, and adipocytes in long bone. However, the function of Col2+ cells in spine and intervertebral disc (IVD) development is largely unknown. To further elucidate the function of Col2+ progenitors in spine, we generated the mice with ablation of Col2+ cells either at embryonic or at postnatal stage. Embryonic ablation of Col2+ progenitors caused the mouse die at newborn with the absence of all spine and IVD. Moreover, postnatal deletion Col2+ cells in spine resulted in a shorter growth plate and endplate cartilage, defected inner annulus fibrosus, a less compact and markedly decreased gel-like matrix in the nucleus pulposus and disorganized cell alignment in each compartment of IVD. Genetic lineage tracing IVD cell populations by using inducible Col2-creERT;tdTomato reporter mice and non-inducible Col2-cre;tdTomato reporter mice revealed that the numbers and differentiation ability of Col2+ progenitors decreased with age. Moreover, immunofluorescence staining showed type II collagen expression changed from extracellular matrix to cytoplasm in nucleus pulposus between 6 month and 1-year-old mice. Finally, fate-mapping studies revealed that Col2+ progenitors are essential for IVD repair in IVD injured model. In summary, embryonic Col2+ cells are the major source of spine development and Col2+ progenitors are the important contributors for IVD repair and regeneration.
Keywords: intervertebral disc; lineage-tracing; nucleus pulposus; stem cell; type II collagen.
© 2021 The Authors. STEM CELLS TRANSLATIONAL MEDICINE published by Wiley Periodicals LLC on behalf of AlphaMed Press.
Conflict of interest statement
The authors declared no potential conflicts of interest.
Figures
Similar articles
-
Spatial distribution of type II collagen gene expression in the mouse intervertebral disc.JOR Spine. 2019 Dec 19;2(4):e1070. doi: 10.1002/jsp2.1070. eCollection 2019 Dec. JOR Spine. 2019. PMID: 31891119 Free PMC article.
-
Ciliary IFT80 is essential for intervertebral disc development and maintenance.FASEB J. 2020 May;34(5):6741-6756. doi: 10.1096/fj.201902838R. Epub 2020 Mar 30. FASEB J. 2020. PMID: 32227389 Free PMC article.
-
Therapeutic Effect of Human Bone Marrow- and Adipose-Derived Stem Cells on Intervertebral Disc Degeneration: A Comparative Study on Rats.Discov Med. 2023 Oct;35(178):831-844. doi: 10.24976/Discov.Med.202335178.78. Discov Med. 2023. PMID: 37811621
-
Treatment of the degenerated intervertebral disc; closure, repair and regeneration of the annulus fibrosus.J Tissue Eng Regen Med. 2015 Oct;9(10):1120-32. doi: 10.1002/term.1866. Epub 2014 Feb 25. J Tissue Eng Regen Med. 2015. PMID: 24616324 Review.
-
Diversity of intervertebral disc cells: phenotype and function.J Anat. 2012 Dec;221(6):480-96. doi: 10.1111/j.1469-7580.2012.01521.x. Epub 2012 Jun 11. J Anat. 2012. PMID: 22686699 Free PMC article. Review.
Cited by
-
Constitutive and conditional gene knockout mice for the study of intervertebral disc degeneration: Current status, decision considerations, and future possibilities.JOR Spine. 2023 Jan 7;6(1):e1242. doi: 10.1002/jsp2.1242. eCollection 2023 Mar. JOR Spine. 2023. PMID: 36994464 Free PMC article. Review.
-
The Contribution of Meckel's Cartilage-Derived Type II Collagen-Positive Cells to the Jawbone Development and Repair.J Histochem Cytochem. 2024 Jun 5;72(6):221554241259059. doi: 10.1369/00221554241259059. Online ahead of print. J Histochem Cytochem. 2024. PMID: 38836522 Free PMC article.
-
Lactic acid promotes nucleus pulposus cell senescence and corresponding intervertebral disc degeneration via interacting with Akt.Cell Mol Life Sci. 2024 Jan 12;81(1):24. doi: 10.1007/s00018-023-05094-y. Cell Mol Life Sci. 2024. PMID: 38212432 Free PMC article.
-
Role of oxidative stress in mitochondrial dysfunction and their implications in intervertebral disc degeneration: Mechanisms and therapeutic strategies.J Orthop Translat. 2024 Oct 16;49:181-206. doi: 10.1016/j.jot.2024.08.016. eCollection 2024 Nov. J Orthop Translat. 2024. PMID: 39483126 Free PMC article. Review.
-
Trp53 controls chondrogenesis and endochondral ossification by negative regulation of TAZ activity and stability via β-TrCP-mediated ubiquitination.Cell Death Discov. 2022 Jul 12;8(1):317. doi: 10.1038/s41420-022-01105-2. Cell Death Discov. 2022. PMID: 35831272 Free PMC article.
References
-
- Kaplan KM, Spivak JM, Bendo JA. Embryology of the spine and associated congenital abnormalities. Spine J. 2005;5(5):564‐576. - PubMed
-
- Grimme JD, Castillo M. Congenital anomalies of the spine. Neuroimaging Clin N Am. 2007;17(1):1‐16. - PubMed
-
- Chen S, Feng J, Zhang H, Jia M, Shen Y, Zong Z. Key role for the transcriptional factor, osterix, in spine development. Spine J. 2014;14(4):683‐694. - PubMed
-
- Fleming A, Kishida MG, Kimmel CB, Keynes RJ. Building the backbone: the development and evolution of vertebral patterning. Development. 2015;142(10):1733‐1744. - PubMed
-
- Scaal M. Early development of the vertebral column. Semin Cell Dev Biol. 2016;49:83‐91. - PubMed
Publication types
MeSH terms
Substances
Grants and funding
LinkOut - more resources
Full Text Sources
Other Literature Sources
