. 2021 Jun 10;125(22):5823-5831.
doi: 10.1021/acs.jpcb.1c02917. Epub 2021 May 25.

Protein-Ligand Binding Volume Determined from a Single 2D NMR Spectrum with Increasing Pressure

Affiliations

Protein-Ligand Binding Volume Determined from a Single 2D NMR Spectrum with Increasing Pressure

Gediminas Skvarnavičius et al. J Phys Chem B. .

Abstract

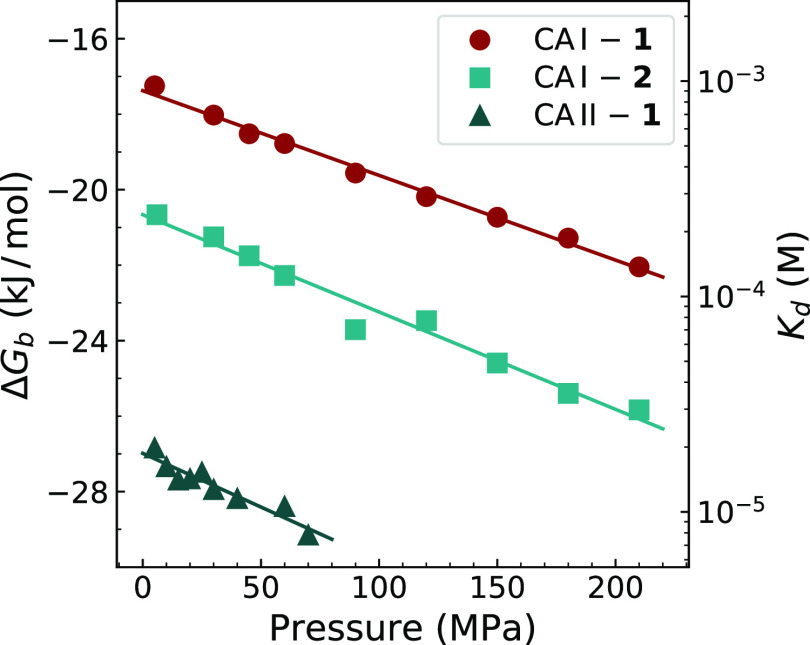
Proteins undergo changes in their partial volumes in numerous biological processes such as enzymatic catalysis, unfolding-refolding, and ligand binding. The change in the protein volume upon ligand binding-a parameter termed the protein-ligand binding volume-can be extensively studied by high-pressure NMR spectroscopy. In this study, we developed a method to determine the protein-ligand binding volume from a single two-dimensional (2D) 1H-15N heteronuclear single quantum coherence (HSQC) spectrum at different pressures, if the exchange between ligand-free and ligand-bound states of a protein is slow in the NMR time-scale. This approach required a significantly lower amount of protein and NMR time to determine the protein-ligand binding volume of two carbonic anhydrase isozymes upon binding their ligands. The proposed method can be used in other protein-ligand systems and expand the knowledge about protein volume changes upon small-molecule binding.


Conflict of interest statement

The authors declare no competing financial interest.

Figures

Figure 1
Figure 1
Illustration of the protein–ligand binding volume ΔVb., W denotes water molecules that the protein (P) and ligand (L) release into bulk water after their partial dehydration upon binding.
Figure 2
Figure 2
Compounds that were used to measure the protein–ligand binding volume.
Figure 3
Figure 3
1H–15N HSQC spectrum overlay of CA I (0.52 mM) without a ligand (black) and with 0.70 mM compound 1 (red) at 5 MPa. Magnified peaks of His 107, Gly 111, Gly 145, and Tyr 194 amino acid residues highlight that in the presence of compound 1, both ligand-bound and ligand-free states of the protein were observed in the spectrum of CA I. The resonance assignment was taken from doi:10.13018/BMR4022.
Figure 4
Figure 4
Ligand- and pressure-induced shifts of the Tyr 194 residue peak position in the 1H–15N HSQC spectra. The concentrations of Compound 1 ranged from 0 to 2.0 mM (left panels) and pressure values ranged from 5 to 180 MPa (right panels).
Figure 5
Figure 5
Crystal structures of the carbonic anhydrase complex with compound 1: (A) CA I (PDB ID: 1CZM) and (B) CA II (PDB ID: 6RL9). Molecules of compound 1 are shown as blue sticks. Residues that were mostly affected by binding of 1 are colored red and labeled.
Figure 6
Figure 6
(A) Fractions of the ligand-bound CA I protein determined from 1H–15N HSQC spectra at different pressures. The inset shows a pressure scale with black color corresponding to low pressure and red color corresponding to high pressure. The concentrations of Compound 1 were 0.53, 0.70, 1.3, 1.5, and 2.0 mM. Solid lines show fits to experimental data using eq 4 that yielded Kd values at different pressures. (B) Calculated ΔGb = RT ln(Kd) plotted as a function of pressure. The error bars denote standard errors obtained from the nonlinear fitting of experimental data in panel A.
Figure 7
Figure 7
Comparison of ΔVb calculations. Colored circles represent ΔGb values calculated from 1H–15N HSQC spectra of CA I that were recorded at 0.70, 1.3, and 2.0 mM concentrations of the added ligand. Data shown as open circles were replotted from Figure 6B to compare different approaches to obtain ΔGbs.
Figure 8
Figure 8
Change in the Gibbs energy of the protein–ligand binding versus applied pressure at a fixed concentration of the added ligand. ΔGb values were obtained from the intensity ratio of peaks in the 1H–15N HSQC spectrum corresponding to ligand-free and ligand-bound states of the protein and averaged over an ensemble of binding-affected residues. The scale on the right shows Kd values that correspond to the ΔGb scale at T = 25 °C.
Figure 9
Figure 9
Comparison of calculated ΔVb values of the CA I-1 interaction, if analysis was performed on the reduced ensembles of ligand binding-affected residues. Cases 1–4 are described in the text.
Figure 10
Figure 10
Response of CA I (0.52 mM) residues to the applied pressure in the absence (open circles) and presence (solid circles) of compound 1 (0.70 mM).

Similar articles

References

    1. Chalikian T. V.; Breslauer K. J. On Volume Changes Accompanying Conformational Transitions of Biopolymers. Biopolymers 1996, 39, 619–626. 10.1002/(SICI)1097-0282(199611)39:5<619::AID-BIP1>3.0.CO;2-Z. - DOI - PubMed
    1. Frye K. J.; Royer C. A. Probing the Contribution of Internal Cavities to the Volume Change of Protein Unfolding Under Pressure. Protein Sci. 1998, 7, 2217–2222. 10.1002/pro.5560071020. - DOI - PMC - PubMed
    1. Chalikian T. V.; Filfil R. How Large Are the Volume Changes Accompanying Protein Transitions and Binding?. Biophys. Chem. 2003, 104, 489–499. 10.1016/S0301-4622(03)00037-1. - DOI - PubMed
    1. Roche J.; Caro J. A.; Norberto D. R.; Barthe P.; Roumestand C.; Schlessman J. L.; Garcia A. E.; E B. G.-M.; Royer C. A. Cavities Determine the Pressure Unfolding of Proteins. Proc. Natl. Acad. Sci. U.S.A. 2012, 109, 6945–6950. 10.1073/pnas.1200915109. - DOI - PMC - PubMed
    1. Dellarole M.; Kobayashi K.; Rouget J.-B.; Caro J. A.; Roche J.; Islam M. M.; Garcia-Moreno E B.; Kuroda Y.; Royer C. A. Probing the Physical Determinants of Thermal Expansion of Folded Proteins. J. Phys. Chem. B 2013, 117, 12742–12749. 10.1021/jp401113p. - DOI - PubMed

Publication types