. 2021 Jul 8;6(13):e149271.
doi: 10.1172/jci.insight.149271.

Placental mTOR complex 1 regulates fetal programming of obesity and insulin resistance in mice

Affiliations

Placental mTOR complex 1 regulates fetal programming of obesity and insulin resistance in mice

Brian Akhaphong et al. JCI Insight. .

Abstract

Fetal growth restriction, or low birth weight, is a strong determinant for eventual obesity and type 2 diabetes. Clinical studies suggest placental mechanistic target of rapamycin (mTOR) signaling regulates fetal birth weight and the metabolic health trajectory of the offspring. In the current study, we used a genetic model with loss of placental mTOR function (mTOR-KOPlacenta) to test the direct role of mTOR signaling on birth weight and metabolic health in the adult offspring. mTOR-KOPlacenta animals displayed reduced placental area and total weight, as well as fetal body weight at embryonic day (E) 17.5. Birth weight and serum insulin levels were reduced; however, β cell mass was normal in mTOR-KOPlacenta newborns. Adult mTOR-KOPlacenta offspring, under a metabolic high-fat challenge, displayed exacerbated obesity and metabolic dysfunction compared with littermate controls. Subsequently, we tested whether enhancing placental mTOR complex 1 (mTORC1) signaling, via genetic ablation of TSC2, in utero would improve glucose homeostasis in the offspring. Indeed, increased placental mTORC1 conferred protection from diet-induced obesity in the offspring. In conclusion, placental mTORC1 serves as a mechanistic link between placental function and programming of obesity and insulin resistance in the adult offspring.

Keywords: Diabetes; Endocrinology; Islet cells; Metabolism; Obesity.


Conflict of interest statement

Conflict of interest: The authors have declared that no conflict of interest exists.

Figures

Figure 1
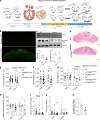
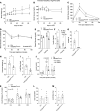
Figure 1. Reduced placental weight and fetal body weight in mTOR-KOPlacenta embryos.
Schematic diagram and timeline of the mTOR-KO study (A). Endogenous GFP reporter (CAG-ZsGreen1) in control (CYP19Cre), positive control (CYP19Cre+) experimental placentas (B). Representative Western blot of E15.5 placenta lysates for mTOR and phosphorylated S6 (Ser 240) and respective quantifications normalized to vinculin (C). H&E staining of control (Ctrl) and mTOR-KOPlacenta (D, junctional zone [JZ] and labyrinth zone [LZ]). Placental weight of E17.5 males (n = 25 Ctrl, 16 mTOR-KOPlacenta) and females (n = 24 Ctrl, 18 mTOR-KOPlacenta, E). E17.5 fetal weight separated by male (n = 25 Ctrl, 16 mTOR-KOPlacenta) and female (n = 23 Ctrl, 18 mTOR-KOPlacenta, F). P0 (within 12 hours of birth) body weight separated by male (n = 13 Ctrl, 5 mTOR-HETPlacenta, 11 mTOR-KOPlacenta) and female (n = 10 Ctrl, 4 mTOR-HETPlacenta, 5 mTOR-KOPlacenta, G). Random blood glucose was measured from trunk blood of P0 males (n = 13 Ctrl, 5 mTOR-HETPlacenta, 10 mTOR-KOPlacenta) and females (n = 10 Ctrl, 4 mTOR-HETPlacenta, 5 mTOR-KOPlacenta, H). Random insulin serum was measured from trunk blood of P0 Ctrl, mTOR-HETPlacenta, and mTOR-KOPlacenta pups (n = 25, 13, 10, respectively) from 5 dams (I). Random insulin serum was measured from trunk blood of P0 Ctrl, mTOR-HETPlacenta, and mTOR-KOPlacenta males (n = 17, 6, 10, respectively) and females (n = 10, 7, 9, respectively) from 5 dams (J). Fetal 3H-Leucine uptake after 10 minutes of leucine placental perfusion in utero (n = 4–6) from 3 dams (K). Statistical analysis was performed using 2-tailed Mann-Whitney (C, I, and K) and 2-way ANOVA with Sidak’s multiple comparisons (EG, H, and J). Error bars represent mean ± SEM. *P < 0.05 Ctrl vs. mTOR-KOPlacenta. Scale bars in images (B and D) are 200 μm.
Figure 2
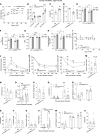
Figure 2. mTOR-KOPlacenta females become obese, glucose intolerant, and insulin resistant after HFD treatment.
Weight of Ctrl versus mTOR-KOPlacenta over 90 days of HFD starting at 17 weeks of age (n = 6, 7, respectively; A). EchoMRI body composition measurements after 11 weeks of HFD (n = 6, 7, B) and body fat percentage (C). Food consumed per gram body weight over 48 hours (n = 4, 6, D). VO2 of Ctrl versus mTOR-KOPlacenta at 11 weeks of HFD (n = 6, E). VCO2, RER, and energy expenditure (n = 6, FH). Random blood glucose of HFD (n = 6, 7, I). Intraperitoneal glucose tolerance test (IPGTT) after 16 hours of fasting on HFD at 6 weeks (n = 6, 7, J). Insulin tolerance test (ITT) after 6 hours of fasting at 8 weeks of HFD (n = 6, 7, K). ITT after 6 hours of fasting at 12 weeks of HFD (n = 6, 7, L). Random serum insulin at 10 weeks of HFD (n = 6, 7, M). β Cell mass at 13 weeks of HFD (n = 4 each group, N). In vivo GSIS and secretory ratio at 10 weeks of HFD (n = 4 Ctrl, 5 mTOR-KOPlacenta, O and P). In vivo GSIS on NCD, 12 weeks old (n = 8 each group, Q). In vitro GSIS on normal chow, 12 weeks old (n = 5 each group, R), and islet insulin content (n = 5 each group, S). β Cell mass at 12 weeks old (n = 3 Ctrl, 3 mTOR-KOPlacenta, T). Random insulin serum of normal chow at 70 weeks old (n = 4 each group, U). In vivo and in vitro GSIS of normal chow 70-week-old mice (n = 4 each group, V and W). Islet insulin content of normal chow 70-week-old mice (n = 4 each group, X). LG, low glucose; HG, high glucose. Statistical analysis was performed using 2-tailed Mann-Whitney (C, D, M, N, P, SU, and X) and 2-way ANOVA Sidak’s multiple comparisons (A, B, EL, O, Q, R, V, and W) with repeated measures when appropriate. Error bars represent mean ± SEM. *P < 0.05, **P < 0.01, ***P < 0.001, Ctrl vs. mTOR-KOPlacenta. #P < 0.05, ##P < 0.01, ###P < 0.001 vs. time point 0 or LG (within genotype).
Figure 3
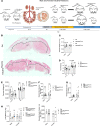
Figure 3. TSC2-KOPlacenta newborn offspring have normal placental weight and β cell mass.
Schematic diagram and timeline of the TSC2-KO study (A). H&E staining of E17.5 Ctrl and TSC2-KOPlacenta (B). Placental weights of male Ctrl versus TSC2-KOPlacenta (n = 7, 6) and female Ctrl versus TSC2-KOPlacenta (n = 7, 8) mice at E17.5 (C). Fetal weights of male (nE17.5 = 8, 5; nP0 = 10, 6) and female (nE17.5 = 7, 8; nP0 = 6, 9) Ctrl vs. TSC2-KOPlacenta mice at E17.5 and P0 (D). Pancreas weights of male (nE17.5 = 8, 5; nP0 = 8, 6) and female (nE17.5 = 7, 8; nP0 = 6, 9) mice measured at E17.5 and P0 (E). Random blood glucose of males (n = 8, 6) and females (n = 6, 9) at P0 (F). Random serum insulin of males (n = 4, 6) and females (n = 4, 6) at P0 (G). β Cell mass of males (n = 4 Ctrl, 2 TSC2-HETPlacenta, 3 TSC2-KOPlacenta) and females at P0 (n = 7 Ctrl, 4 TSC2-HETPlacenta, 5 TSC2-KOPlacenta, H). Whole pancreatic insulin content of males (n = 4 Ctrl, 6 TSC2-KOPlacenta) and females (n = 5 Ctrl, 6 TSC2-KOPlacenta) at P0 (I). Statistical analysis was performed using 2-way ANOVA with Sidak’s multiple comparisons (CI). Error bars represent mean ± SEM. Scale bars in images are 500 μm. *P < 0.05 Ctrl vs. TSC2-KOPlacenta.
Figure 4
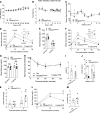
Figure 4. Adult male TSC2-KOPlacenta mice are protected from obesity-induced metabolic dysfunction.
Weight progression of Ctrl versus TSC2-KOPlacenta male mice fed with HFD over 9 weeks starting at 17 weeks of age (n = 4, 5, respectively, A). Food intake measurements of HFD male mice (n = 4, 5, B). Random blood glucose of HFD male mice (n = 4, 5, C). IPGTT after 16 hours of fasting at 2 weeks HFD (n = 4, 5, D) and corresponding random and fasting blood glucose (n = 4, 5, E). IPGTT after 16 hours of fasting at 4 weeks of HFD (n = 4, 5, F) in addition to random and fasting blood glucose (n = 4, 5, G). ITT at 5 weeks of HFD after 6 hours of fasting (n = 4, 5, H). HOMA-IR of HFD males at 6 weeks (n = 4, 5, I). Random insulin serum levels at 1 and 4 weeks of HFD (n = 4, 4–5, J). In vivo GSIS on males at 6 weeks of HFD (n = 4, 5, K) and concurrent IPGTT (n = 4, 5, L). β Cell mass of males at 10 weeks of HFD (n = 4, 5, M). Statistical analysis was performed using 2-tailed Mann-Whitney (I and M) and 2-way ANOVA with Sidak’s multiple comparisons (AH and JL) with repeated measures when appropriate. Error bars represent mean ± SEM. *P < 0.05, **P < 0.01 Ctrl vs. TSC2-KOPlacenta. ##P < 0.01 vs. time point 0 (within genotype).
Figure 5
Figure 5. Adult female TSC2-KOPlacenta offspring are protected from obesity-induced metabolic dysfunction.
Weight progression of female mice fed with HFD over the course of 12 weeks starting at 8 weeks old (n = 6 Ctrl, 4 TSC2-KOPlacenta, A). Random blood glucose of HFD females over the duration of treatment (n = 6, 4, B). Female IPGTT after 16-hour fast at 6 weeks of HFD (n = 6, 4, C). Female ITT after 6-hour fast at 8 weeks of HFD (n = 6, 4, D). Blood glucose and insulin serum measurements at random and fasting times of 8-week HFD females (n = 6, 4, E; n = 5, 3, F). HOMA-IR of HFD females at 8 weeks (n = 5, 3, G). Pancreas weight (n = 6, 4, H) and β cell mass (n = 6, 4, I) of females at 12 weeks of HFD. In vivo GSIS of aged Ctrl versus TSC2-KOPlacenta females under normal diet (n = 3, 5, J). In vitro GSIS of 12-week-old female islets under low glucose, high glucose, high glucose plus palmitate, and KCl stimulation (n = 7, 6, K). Insulin content normalized to DNA (n = 7, 6, L). β Cell mass of female Ctrl versus TSC2-KOPlacenta under normal chow (n = 3, 4, M). Statistical analysis was performed using 2-tailed Mann-Whitney (GI, L, and M) and 2-way ANOVA with Sidak’s multiple comparisons in (AF, J, and K) with repeated measures when appropriate. Error bars represent mean ± SEM. *P < 0.05, **P < 0.01, ***P < 0.001 Ctrl vs. TSC2-KOPlacenta. #P < 0.05 vs. time point 0 or LG (within genotype).

References

    1. Danaei G, et al. National, regional, and global trends in fasting plasma glucose and diabetes prevalence since 1980: systematic analysis of health examination surveys and epidemiological studies with 370 country-years and 2.7 million participants. Lancet. 2011;378(9785):31–40. doi: 10.1016/S0140-6736(11)60679-X. - DOI - PubMed
    1. Lango H, et al. Assessing the combined impact of 18 common genetic variants of modest effect sizes on type 2 diabetes risk. Diabetes. 2008;57(11):3129–3135. doi: 10.2337/db08-0504. - DOI - PMC - PubMed
    1. Morris AP, et al. Large-scale association analysis provides insights into the genetic architecture and pathophysiology of type 2 diabetes. Nat Genet. 2012;44(9):981–990. doi: 10.1038/ng.2383. - DOI - PMC - PubMed
    1. Alejandro EU, et al. Maternal diet-induced microRNAs and mTOR underlie beta cell dysfunction in offspring. J Clin Invest. 2014;124(10):4395–4410. doi: 10.1172/JCI74237. - DOI - PMC - PubMed
    1. Sandovici I, et al. Developmental and environmental epigenetic programming of the endocrine pancreas: consequences for type 2 diabetes. Cell Mol Life Sci. 2013;70(9):1575–1595. doi: 10.1007/s00018-013-1297-1. - DOI - PMC - PubMed

Publication types