

Taxed and untaxed beverage intake by South African young adults after a national sugar-sweetened beverage tax: A before-and-after study
- PMID: 34032809
- PMCID: PMC8148332
- DOI: 10.1371/journal.pmed.1003574
Taxed and untaxed beverage intake by South African young adults after a national sugar-sweetened beverage tax: A before-and-after study
Abstract
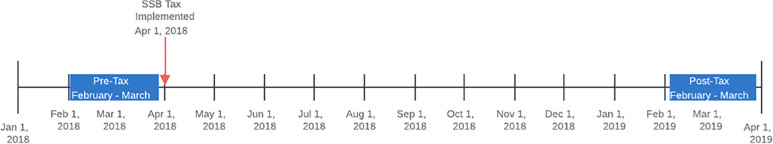
Background: In an effort to prevent and reduce the prevalence rate of people with obesity and diabetes, South Africa implemented a sugar-content-based tax called the Health Promotion Levy in April 2018, one of the first sugar-sweetened beverage (SSB) taxes to be based on each gram of sugar (beyond 4 g/100 ml). This before-and-after study estimated changes in taxed and untaxed beverage intake 1 year after the tax, examining separately, to our knowledge for the first time, the role of reformulation distinct from behavioral changes in SSB intake.
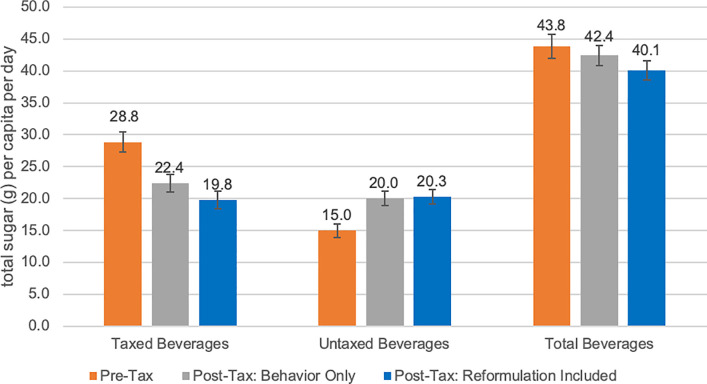
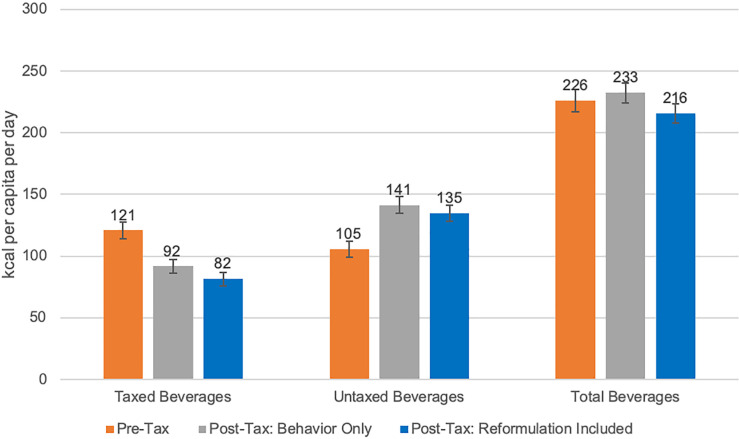
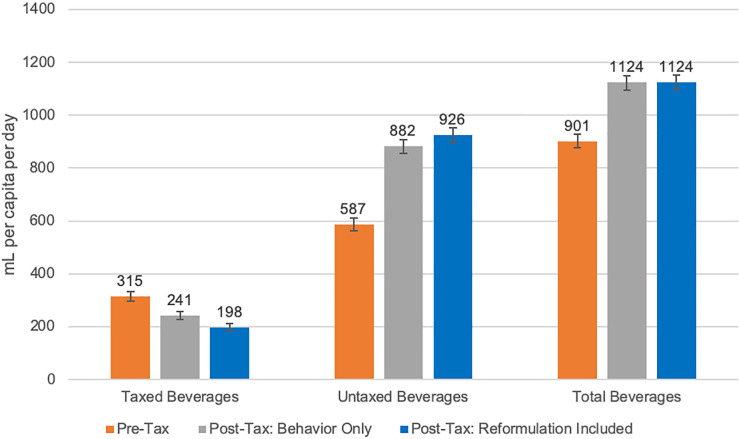
Methods and findings: We collected single-day 24-hour dietary recalls from repeat cross-sectional surveys of adults aged 18-39 years in Langa, South Africa. Participants were recruited in February-March 2018 (pre-tax, n = 2,459) and February-March 2019 (post-tax, n = 2,489) using door-to-door sampling. We developed time-specific food composition tables (FCTs) for South African beverages before and after the tax, linked with the diet recalls. By linking pre-tax FCTs only to dietary intake data collected in the pre-tax and post-tax periods, we calculated changes in beverage intake due to behavioral change, assuming no reformulation. Next, we repeated the analysis using an updated FCT in the post-tax period to capture the marginal effect of reformulation. We estimated beverage intake using a 2-part model that takes into consideration the biases in using ordinary least squares or other continuous variable approaches with many individuals with zero intake. First, a probit model was used to estimate the probability of consuming the specific beverage category. Then, conditional on a positive outcome, a generalized linear model with a log-link was used to estimate the continuous amount of beverage consumed. Among taxed beverages, sugar intake decreased significantly (p < 0.0001) from 28.8 g/capita/day (95% CI 27.3-30.4) pre-tax to 19.8 (95% CI 18.5-21.1) post-tax. Energy intake decreased (p < 0.0001) from 121 kcal/capita/day (95% CI 114-127) pre-tax to 82 (95% CI 76-87) post-tax. Volume intake decreased (p < 0.0001) from 315 ml/capita/day (95% CI 297-332) pre-tax to 198 (95% CI 185-211) post-tax. Among untaxed beverages, sugar intake increased (p < 0.0001) by 5.3 g/capita/day (95% CI 3.7 to 6.9), and energy intake increased (p < 0.0001) by 29 kcal/capita/day (95% CI 19 to 39). Among total beverages, sugar intake decreased significantly (p = 0.004) by 3.7 (95% CI -6.2 to -1.2) g/capita/day. Behavioral change accounted for reductions of 24% in energy, 22% in sugar, and 23% in volume, while reformulation accounted for additional reductions of 8% in energy, 9% in sugar, and 14% in volume from taxed beverages. The key limitations of this study are an inability to make causal claims due to repeat cross-sectional data collection, and that the magnitude of reduction in taxed beverage intake may not be generalizable to higher income populations.
Conclusions: Using a large sample of a high-consuming, low-income population, we found large reductions in taxed beverage intake, separating the components of behavioral change from reformulation. This reduction was partially compensated by an increase in sugar and energy from untaxed beverages. Because policies such as taxes can incentivize reformulation, our use of an up-to-date FCT that reflects a rapidly changing food supply is novel and important for evaluating policy effects on intake.
Conflict of interest statement
We have read and understood PLOS Medicine’s policy on declaration of interests and ME, LST, TF, SWN, and ECS declare that they have no competing interests. BP is on the PLOS Medicine editorial board and otherwise has no competing interests.
Figures
References
Publication types
MeSH terms
Grants and funding
LinkOut - more resources
Full Text Sources
Other Literature Sources
Miscellaneous
