. 2021 Jul 5;220(7):e202102005.
doi: 10.1083/jcb.202102005. Epub 2021 May 25.

Mechanism of p38 MAPK-induced EGFR endocytosis and its crosstalk with ligand-induced pathways

Affiliations

Mechanism of p38 MAPK-induced EGFR endocytosis and its crosstalk with ligand-induced pathways

Mireia Perez Verdaguer et al. J Cell Biol. .

Abstract

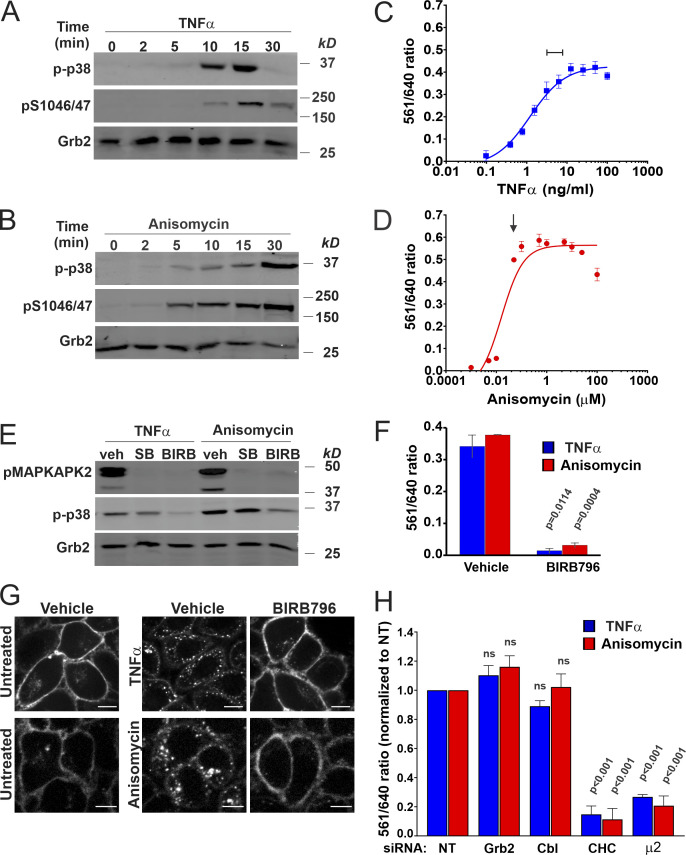
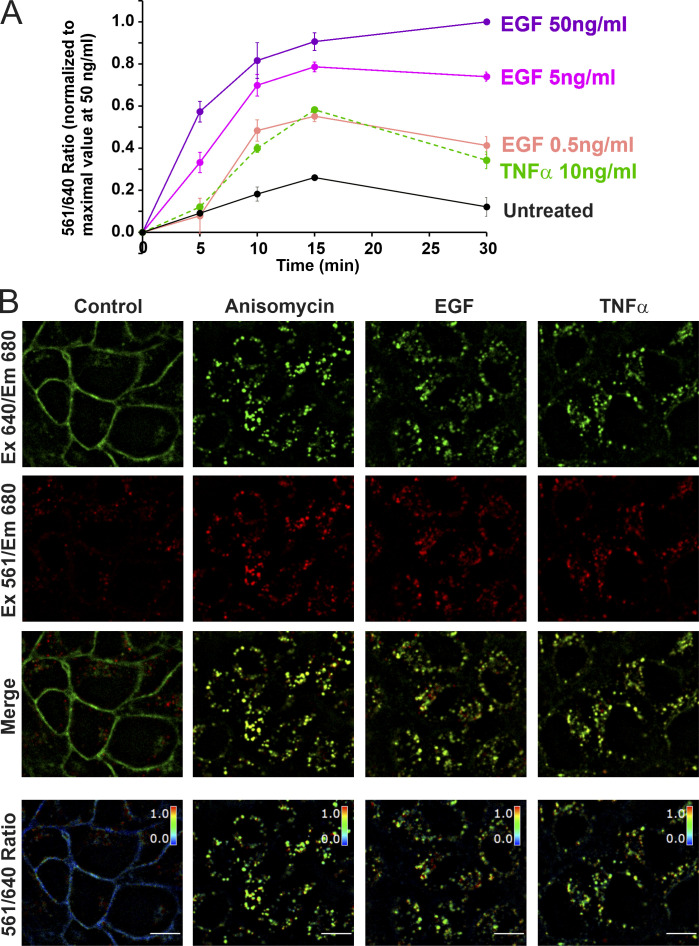
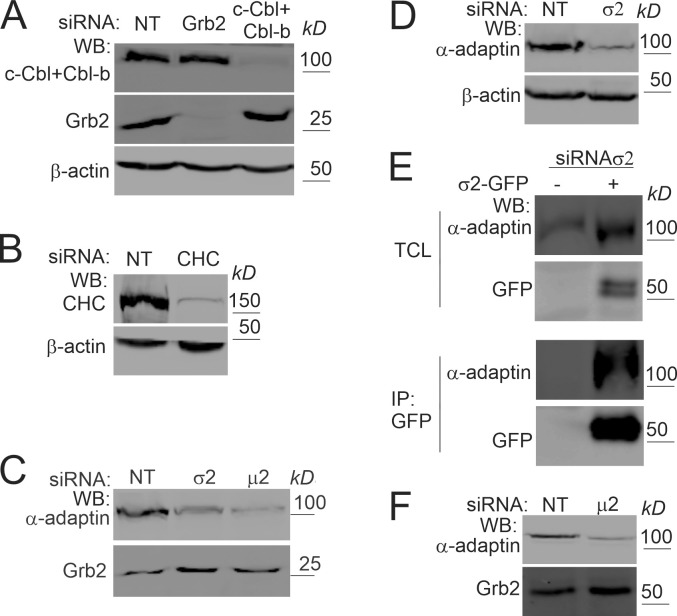
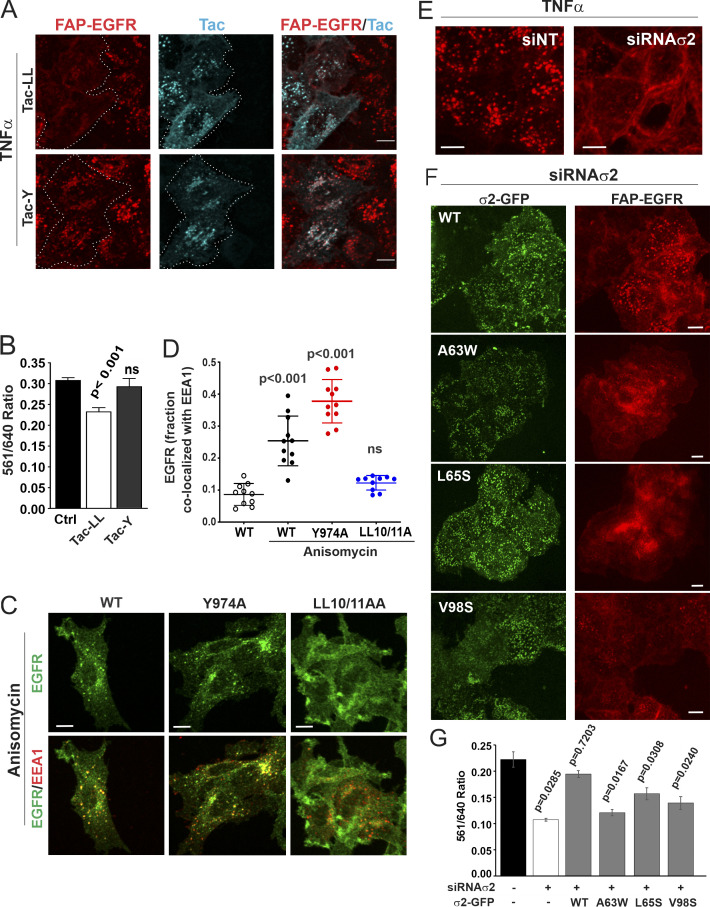
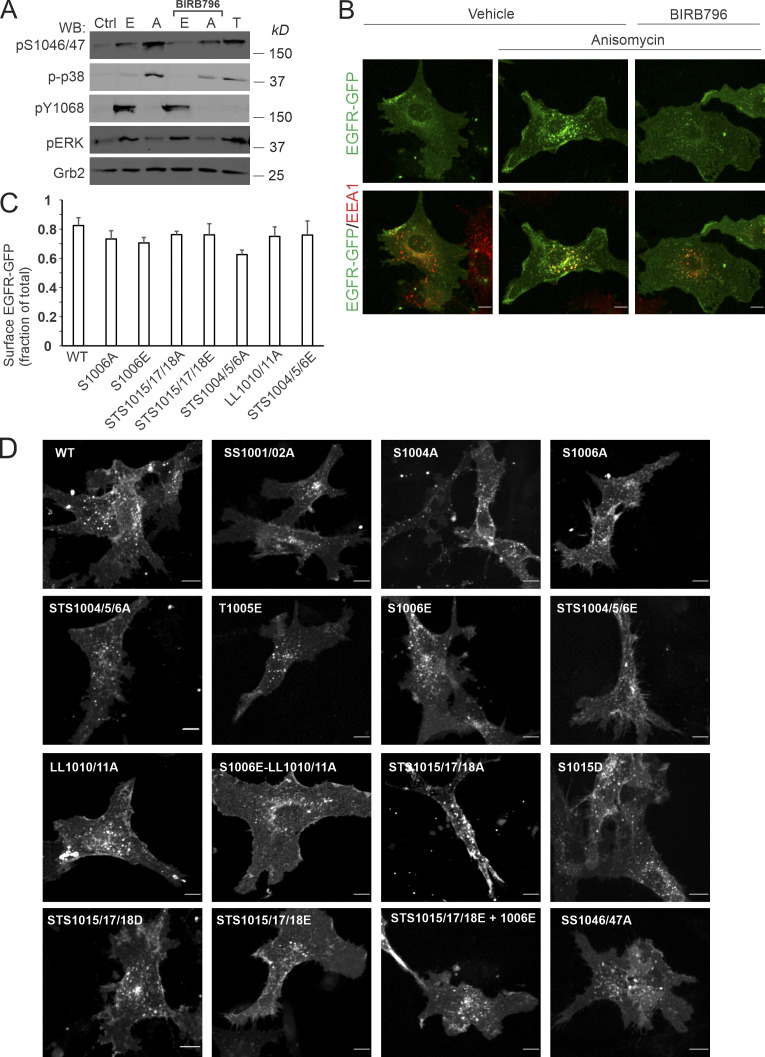
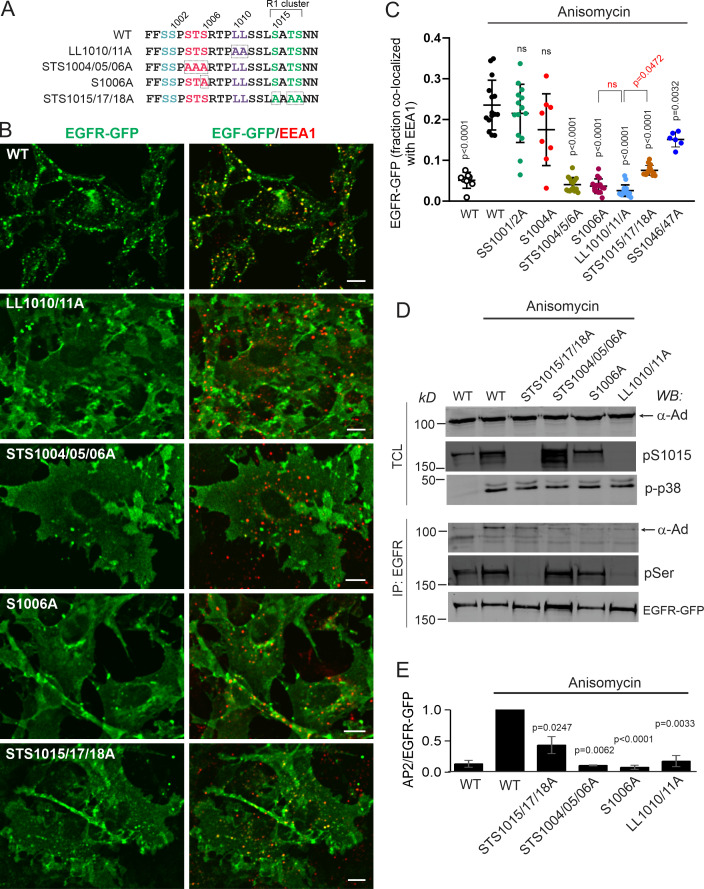
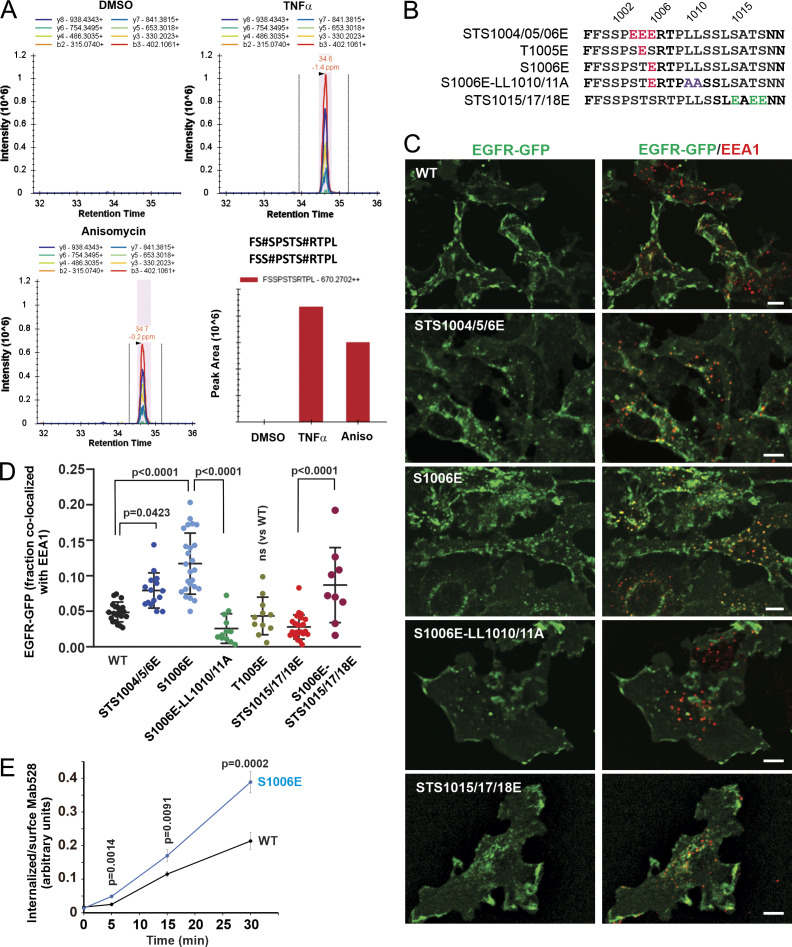
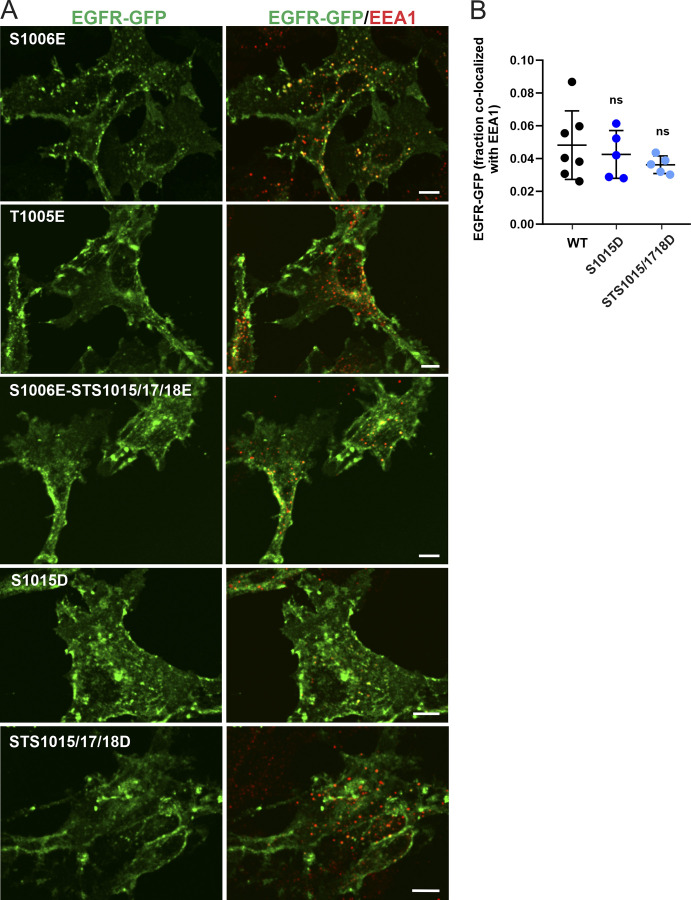
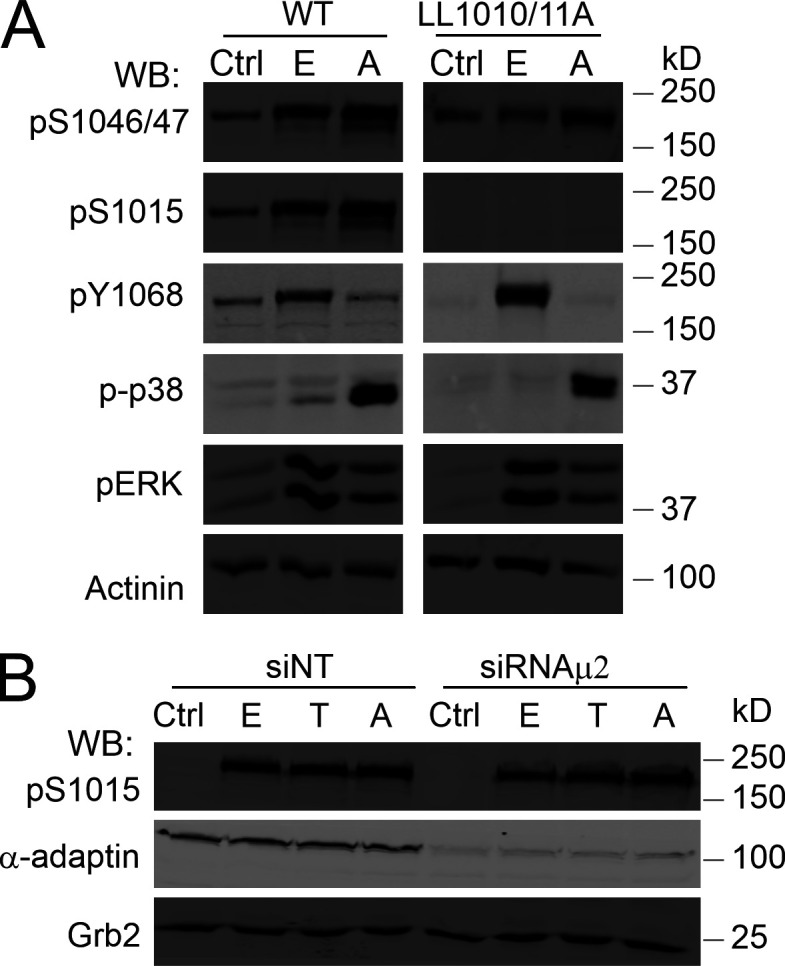
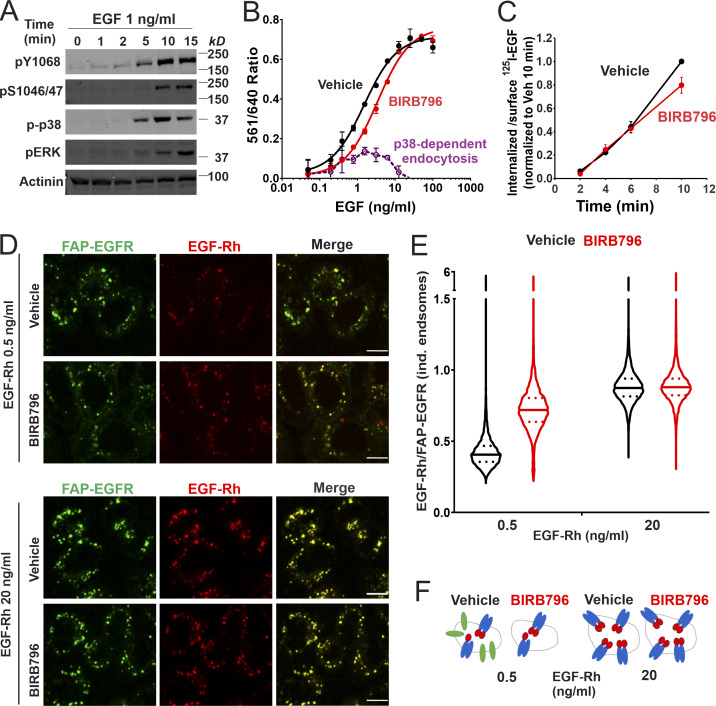
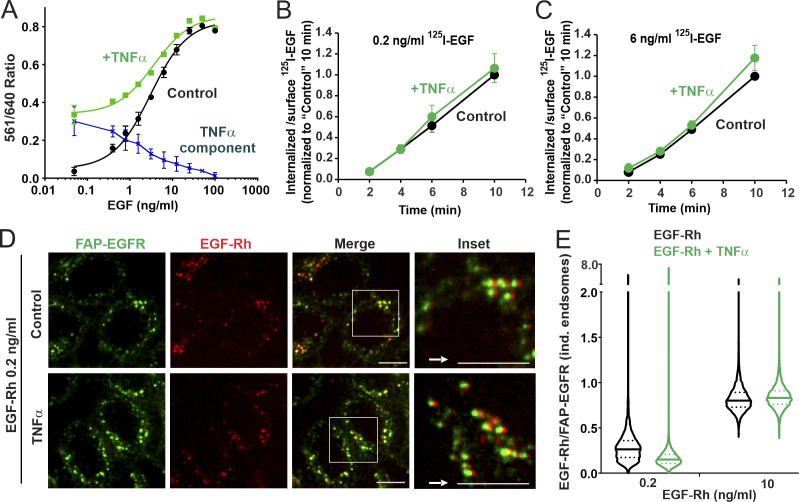
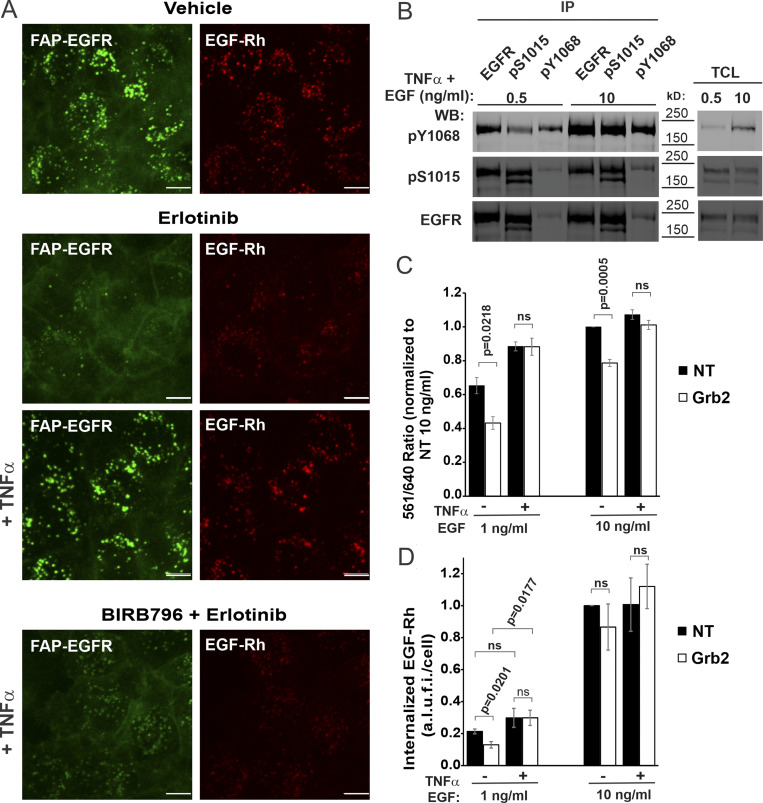
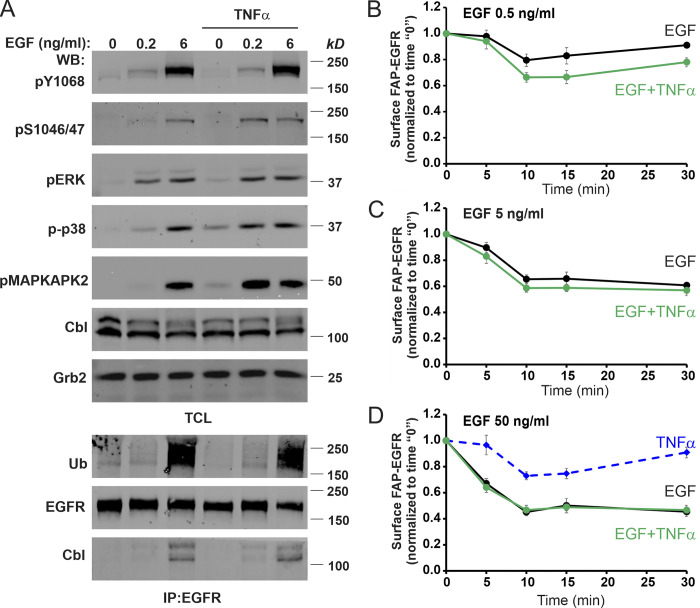
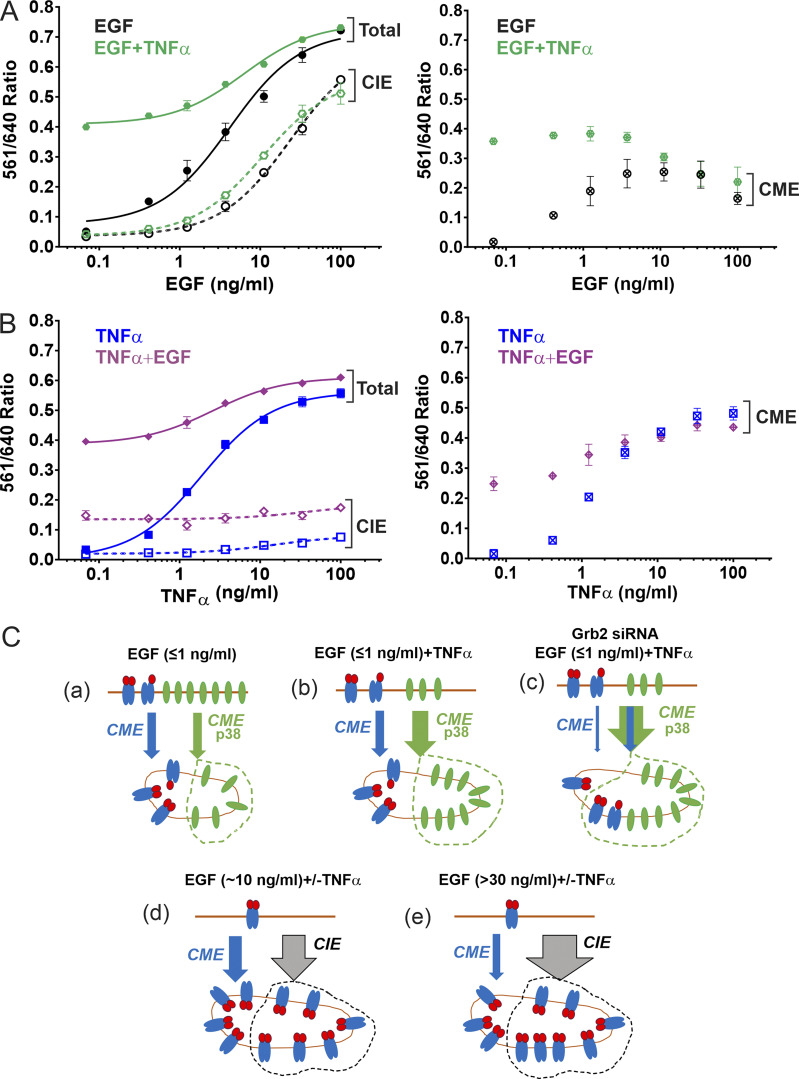
Ligand binding triggers clathrin-mediated and, at high ligand concentrations, clathrin-independent endocytosis of EGFR. Clathrin-mediated endocytosis (CME) of EGFR is also induced by stimuli activating p38 MAPK. Mechanisms of both ligand- and p38-induced endocytosis are not fully understood, and how these pathways intermingle when concurrently activated remains unknown. Here we dissect the mechanisms of p38-induced endocytosis using a pH-sensitive model of endogenous EGFR, which is extracellularly tagged with a fluorogen-activating protein, and propose a unifying model of the crosstalk between multiple EGFR endocytosis pathways. We found that a new locus of p38-dependent phosphorylation in EGFR is essential for the receptor dileucine motif interaction with the σ2 subunit of clathrin adaptor AP2 and concomitant receptor internalization. p38-dependent endocytosis of EGFR induced by cytokines was additive to CME induced by picomolar EGF concentrations but constrained to internalizing ligand-free EGFRs due to Grb2 recruitment by ligand-activated EGFRs. Nanomolar EGF concentrations rerouted EGFR from CME to clathrin-independent endocytosis, primarily by diminishing p38-dependent endocytosis.


Figures

Figure 1.
Figure 1.
p38 activation triggers clathrin- and AP2-dependent FAP-EGFR internalization in HeLa/FAP-EGFR cells. (A and B) Cells were incubated with 3 ng/ml TNFα (A) or 100 nM anisomycin (B) for indicated times and lysed. Cell lysates were resolved by electrophoresis and probed by Western blotting with antibodies to phosphorylated p38 (p-p38), pS1046/47 EGFR, and Grb2 (loading control). (C and D) FAP-EGFR internalization was measured using FERI assay in cells treated with TNFα (0.48–100 ng/ml) or anisomycin (0.001–100 µM) for 15 min. Mean values of the 561/640 ratio with SEM of duplicates are plotted against the log of concentrations. TNFα or anisomycin concentrations used in subsequent experiments are indicated by the bar in C and the arrow in D. (E) Cells were pretreated with DMSO (veh) for 90 min, 10 µM SB202190 for 30 min (SB), or 100 nM BIRB796 for 90 min (BIRB), and further incubated with 3 ng/ml TNFα or 100 nM anisomycin for 15 min in the presence of inhibitors. Cell lysates were resolved by electrophoresis and immunoblotted with antibodies to active p38 (p-p38), phosphorylated MAPKAPK2 (pMAPKAPK2), and Grb2 (loading control). (F) FERI internalization assay was performed in cells pretreated with DMSO (vehicle) or 100 nM BIRB796 for 90 min and then incubated with 3 ng/ml TNFα (blue) or 100 nM anisomycin (red). Mean values of the 561/640 ratio with SEM of duplicates are plotted. P values against vehicle were calculated using the unpaired Student’s t test. (G) Cells were pretreated with DMSO (vehicle) or 100 nM BIRB796 for 90 min and labeled with MG-B-Tau, and then left untreated or treated with 10 ng/ml TNFα or 100 nM anisomycin for 15 min. 3D images were acquired through the 640-nm channel. Representative confocal sections through the middle of the cell are shown. Scale bars, 10 µm. (H) Cells were reverse-transfected with nontargeting siRNA (NT) or siRNAs targeting CHC, Grb2, c-Cbl/Cbl-b (Cbl), or the μ2 subunit of AP2. FERI assay was performed 4 d later, after TNFα or anisomycin stimulation. Values of the 561/640 ratio were normalized by this value in NT-transfected cells. Mean values with SEM from three independent experiments are shown. P values against NT were calculated using the unpaired Student’s t test. The efficiency of protein depletion is shown in Fig. S2.
Figure S1.
Figure S1.
EGF and TNFα stimulated endocytosis of FAP-EGFR demonstrated using FERI assay and single-cell imaging. (A) Time course of FAP-EGFR internalization. HeLa/FAP-EGFR cells were labeled with MG-Bis-SA and further incubated in starvation medium (Untreated) or stimulated with either EGF (0.5, 5, or 50 ng/ml) or TNFα (10 ng/ml) for indicated times. The 561/640 ratio was measured using the FERI internalization assay. In each experiment, the background ratio at time “zero” was determined by y-intersection of the linear regression slope calculated using ratio values in untreated cells incubated for 5 and 10 min. This ratio value was subtracted from raw ratio values in each experiment, and the resulting background-subtracted ratio values were normalized to the ratio in cells stimulated with 50 ng/ml EGF for 30 min in each time-course experiment. The data in the graph represent mean values with SEMs (n = 3 independent experiments). SEMs are not shown if they are smaller than markers. (B) Examples of single-cell FAP-EGFR ratiometric imaging. Cells labeled with MG-Bis-SA were either untreated or treated with 100 nM anisomycin, 4 ng/ml EGF, or 3 ng/ml TNFα for 15 min at 37°C. 3D stacks of x-y confocal images were acquired from living cells through the 640-nm channel (Ex 640/Em 680; pH-independent) and the FRET channel (Ex 561/Em 680, pH-sensitive). Individual confocal sections through the middle of cells are presented. The 561/640 ratio is presented as pseudocolored image modulated to the intensity of the 640-nm channel. Scale bar, 10 µm. Em, emission; Ex, excitation.
Figure S2.
Figure S2.
Efficiencies of siRNAs knockdowns and σ2-GFP assembly into AP2 in cells transfected with σ2 siRNA. (A–D) Typical efficiencies of protein depletion in siRNA experiments in HeLa/FAP-EGFR cells described in Figs. 1, 2, 7, and 9. HeLa/FAP-EGFR cells were transfected with nontargeting (NT) siRNA and Grb2 (A), c-Cbl and Cbl-b (A), CHC (B), μ2 (C), or σ2 (C and D) siRNAs. Cells were lysed 3–4 d after transfections, and lysates were blotted with indicated antibodies. β-Actin and Grb2 are loading controls. (E) HeLa/FAP-EGFR cells were transfected with σ2 siRNA for 2 d and then transfected with WT σ2-GFP plasmid. 2 d later, cells were lysed, and σ2-GFP was immunoprecipitated using the GFP antibody. Lysates (total cell lysates [TCL]) and immunoprecipitates (IP) were probed by Western blotting (WB) with GFP and α-adaptin antibodies to demonstrate the assembly of WT σ2-GFP into AP2 complexes. (F) PAE/EGFR-GFP cells were transfected with μ2 siRNAs as described in Materials and methods. Cells were lysed 5 d after two transfections, and lysates were blotted with α-adaptin and Grb2 (loading control) antibodies.
Figure 2.
Figure 2.
p38-dependent EGFR internalization is mediated by the interaction of the dileucine motif with the σ2 subunit of AP2. (A and B) HeLa/FAP-EGFR cells were mock-transfected (Ctrl) or transfected with Tac-LL or Tac-Y chimeric constructs, and used for experiments 2 d later. In A, cells were labeled with MG-B-Tau, incubated with 3 ng/ml TNFα for 15 min, and fixed. Tac was immunolabeled using secondary FITC-conjugated antibodies. 3D imaging was performed through the 488-nm (cyan, Tac) and 640-nm (red, MG-B-Tau) channels. Maximum intensity projections of 3D images are shown. Borders of cells expressing Tac chimeras are indicated by white lines. Scale bars, 10 µm. The expression levels of Tac-Y and Tac-LL chimeric proteins were similar. In B, cells were labeled with MG-Bis-SA, treated with 3 ng/ml TNFα for 15 min, and analyzed using the FERI assay. Bar graph represents mean values of the 561/640 ratio with SEM from quadruplicates. P values were calculated using the unpaired Student’s t test against control. (C) PAE cells stably expressing WT, LL1010/11A, or 974A EGFR mutants were treated with 100 nM anisomycin for 15 min and immunolabeled with EGFR (AB_2246311) and EEA1 antibodies. 3D images were acquired through the 488-nm (green, EGFR) and 640-nm (red, EEA1) channels. Individual confocal sections through the middle of z-stacks are shown. Scale bars, 10 µm. (D) Quantification of the fraction of EGFR (WT or mutants as indicated) colocalized with EEA1 endosomes in images exemplified in C. Scatter dot plot represents mean values with SDs (n = 10). P values against untreated WT were determined by multiple-comparison one-way ANOVA. (E–G) HeLa/FAP-EGFR cells were reverse-transfected with nontargeting (siNT) or σ2 siRNA (siRNAσ2). 2 d later, the cells were either not transfected (E), or transfected with WT σ2-GFP or its mutants (A63W, L65S, or V98D; F and G), and assayed after an additional 2 d. The efficiency of σ2 depletion is shown in Fig. S2. In E and F, the cells labeled with MG-B-Tau were treated with TNFα for 15 min and imaged through 640-nm (red, FAP-EGFR) and 488-nm (green, GFP) channels. Maximum intensity projections of 3D images are shown. Scale bars, 10 µm. In G, the cells were labeled with MG-Bis-SA and treated with TNFα for 15 min, and the FERI assay was performed. Bar graph represents mean values of the 561/640 ratio with SEM of quadruplicates. P values against siNT were determined by multiple-comparison one-way ANOVA.
Figure S3.
Figure S3.
PAE cells as a cell model for studying p38-dependent endocytosis of EGFR-GFP and its mutants: activation of p38, steady-state EGFR-GFP subcellular distribution, and p38-dependent and EGF-stimulated EGFR-GFP endocytosis. (A) PAE cells stably expressing EGFR-GFP were incubated with 10 ng/ml EGF (E), 20 ng/ml TNFα (T), or 100 nM anisomycin (A) for 15 min at 37°C after preincubation with DMSO (vehicle) or BIRB976 for 90 min. Cells were lysed, and lysates were probed by Western blotting (WB) with antibodies to p1046/47, active p38 (p-p38), pY1068, pERK1/2, and Grb2 (loading control). (B) PAE cells stably expressing EGFR-GFP were incubated with 100 nM anisomycin for 15 min at 37°C after preincubation with DMSO (vehicle) or BIRB976 for 90 min. Cells were immunolabeled with the EEA1 antibody to mark early endosomes. 3D images were acquired through the 488-nm (green, EGFR-GFP) and 640-nm (red, EEA1) channels. Maximum intensity projections are shown. Scale bars, 10 µm. (C) PAE cells stably expressing either WT or indicated EGFR-GFP mutants were fixed and immunolabeled with EGFR antibody Mab528 to label cell-surface EGFR-GFP followed by secondary antibodies conjugated to Cy5. 3D images were acquired through 488-nm (GFP, total EGFR-GFP) and 640-nm (Cy5, surface EGFR-GFP) channels. The ratio of Cy5 to GFP fluorescence intensities corresponds to the fraction of cell-surface EGFR-GFP. Bar graph represents mean values with SDs (n = 10–14). (D) PAE cells expressing either WT or indicated EGFR-GFP mutants were stimulated with 1 ng/ml EGF-Rh for 15 min at 37°C. Cells were 3D-imaged through the 488-nm channel (GFP) and the 561-nm channel (EGF-Rh, not shown). Maximum intensity projection images are presented. Scale bars, 10 µm. Ctrl, control.
Figure 3.
Figure 3.
Serine 1006 and the R1 serine/threonine cluster are necessary for p38-induced, LL1010/1011-mediated EGFR internalization. (A) Schematic representation of EGFR region encompassed by residues 999–1020 including the dileucine motif and surrounding clusters of serines and threonines. Residues 1015–1018 are designated as the R1 cluster per Tanaka et al. (2018). Key mutations and mutant names are indicated. (B) PAE cells stably expressing EGFR-GFP (WT or indicated mutants) were treated with 100 nM anisomycin for 15 min and immunolabeled with the EEA1 antibody. 3D images were acquired through the 488-nm (green, EGFR-GFP) and 640-nm (red, EEA1) channels. Maximum intensity projections of three consecutive confocal sections are shown. Scale bars, 10 µm. (C) Quantification of the fraction of EGFR-GFP colocalized with EEA1 endosomes in images exemplified in B. Scatter dot plot represents mean values with SDs (n = 8–15). P values were determined by multiple-comparison one-way ANOVA. P values against “WT plus anisomycin” are shown in black. P values against LL1010/11A mutant are shown in red. (D and E) PAE cells stably expressing EGFR-GFP (WT or mutants as indicated) were treated with anisomycin for 15 min and lysed, and EGFR-GFP was immunoprecipitated. In D, total cell lysates (TCL) and immunoprecipitates (IP) were probed by Western blotting (WB) with antibodies to α-adaptin subunit of AP2 (α-Ad), pS1015, phosphorylated p38 (p-p38), total phosphoserine (pSer), and GFP. The identity of α-adaptin band was confirmed by immunoblotting analysis of cells depleted of AP2 by μ2 siRNA (Fig. S2 F). In E, the amount of AP2 coimmunoprecipitated with EGFR-GFP was normalized by the amount of immunoprecipitated EGFR-GFP, and the values of the AP2/EGFR-GFP ratio were further normalized to this value obtained in immunoprecipitates from anisomycin-treated WT cells in each independent experiment. Bar graph represents mean values with SEM (n = 2–4 independent experiments). P values against WT treated with anisomycin were determined by the unpaired Student’s t test.
Figure 4.
Figure 4.
Mass spectrometry and phosphomimetic mutations demonstrate the importance of serine 1006 phosphorylation for p38-induced EGFR endocytosis. (A) HeLa/FAP-EGFR cells were untreated or treated with 10 ng/ml TNFα or 100 nM anisomycin (Aniso) for 15 min, and lysed. EGFR was immunoprecipitated, and immunoprecipitates were resolved by SDS-PAGE. Mass spectrometry analysis of corresponding gel bands was performed. Peaks corresponding to the peptides containing phosphoS1006 are shown. These peptides were also phosphorylated at S1001 or S1002. See Table S1. (B) Main phosphomimetic mutations with mutant names indicated. (C) PAE cells stably expressing EGFR-GFP (WT or mutants as indicated) were immunostained with the EEA1 antibody. 3D images were acquired through the 488-nm (green, EGFR-GFP) and 640-nm (red, EEA1) channels. Maximum intensity projections of three consecutive confocal sections are shown. Scale bars, 10 µm. (D) Quantification of the fraction of EGFR-GFP (WT and mutants as indicated) colocalized with EEA1 endosomes in images exemplified in C and Fig. S4. Scatter dot plot represents mean values with SDs (n = 8–21). P values were determined by multiple-comparison one-way ANOVA. (E) The antibody-uptake endocytosis assay was performed in PAE cells expressing WT or the S1006E EGFR-GFP mutant. The cells were preincubated with the EGFR antibody Mab528 for 10 min at RT, and then incubated at 37°C for indicated times. Cell-surface and internalized Mab528 was labeled with secondary antibodies conjugated with, respectively, Cy5 and Cy3, as described in Materials and methods. 3D images were acquired through 640-nm (surface Mab528) and 561-nm (internalized Mab528) channels. The ratio of internalized/surface EGFR (Cy3/Cy5) was calculated, and mean values with SEM (n = 13–16) were plotted against time. P values were determined by the unpaired Student’s t test.
Figure S4.
Figure S4.
Effect of phosphomimetic mutations on EGFR-GFP localization. (A) PAE cells stably expressing EGFR-GFP mutants S1006E, T1005E, S1006E-STS1015/17/18E, S1015D, or STS1015/17/18D were fixed and immunolabeled with the EEA1 antibody to mark early endosomes. 3D images were acquired through the 488-nm (green, EGFR-GFP) and 640-nm (red, EEA1) channels. Maximal intensity projections of three consecutive confocal sections are shown. Scale bars, 10 µm. (B) Quantification of the fraction of EGFR-GFP (WT and indicated mutants) colocalized with EEA1 endosomes. Scatter dot plot represents mean values with SDs (n = 5–7 images, each depicting multiple cells). P values were determined by multiple-comparison one-way ANOVA.
Figure S5.
Figure S5.
p38-induced phosphorylation of EGFR Ser1015 is dependent on LL1010/1011 and independent on AP2. (A) PAE cells expressing WT EGFR-GFP or the LL1010/11A mutant were incubated with vehicle (Ctrl), 10 ng/ml EGF (E), or 100 nM anisomycin (A) for 15 min at 37°C. Cells were lysed, and lysates were probed by Western blotting (WB) with antibodies to pS1046/47, pS1015, pY1068, activated p38 (p-p38), pERK1/2, and α-actinin (loading control). (B) HeLa/FAP-EGFR cells were transfected with nontargeting (NT) or μ2 siRNAs. 4 d later, the cells were stimulated with vehicle (Ctrl), 4 ng/ml EGF (E), 10 ng/ml TNFα (T), or 100 nM anisomycin (A). Cells were lysed, and lysates were immunoblotted with antibodies to pS1015, α-adaptin, and Grb2 (loading control).
Figure 5.
Figure 5.
EGF-induced p38-independent and p38-dependent internalization target ligand-occupied and free EGFRs to the same endosomes. (A) HeLa/FAP-EGFR cells were treated with 1 ng/ml EGF for indicated times at 37°C and lysed. Lysates were probed by Western blotting with pY1068, pS1046/47, phospho-p38 (p-p38), phospho-ERK1/2 (pERK), and α-actinin antibodies (loading control). (B) HeLa/FAP-EGFR cells were incubated with DMSO (vehicle, black) or 100 nM BIRB796 (red) for 90 min and then treated with 0.48–100 ng/ml EGF for 15 min. FAP-EGFR internalization was measured using the FERI assay. Mean values with SEM of duplicates are plotted against log of EGF concentrations. Mean values of the 561/640 ratio in cells treated with BIRB796 were subtracted from those values in vehicle-treated cells to estimate the relative contribution of the p38-dependent internalization (dashed violet). This experiment is representative of three independent experiments. (C) HeLa/FAP-EGFR cells were pretreated with DMSO (vehicle, black) or 100 nM BIRB796 (red) for 90 min, and then incubated with 1 ng/ml 125I-EGF for indicated times at 37°C. Surface-bound and internalized 125I-EGF was measured, and the ratio of the amounts of internalized and surface ligand is plotted against time. The data are normalized to the maximum value of the internalized/surface 125I-EGF ratio at the 10-min time point. Mean values with SDs from two independent experiments are presented. The difference between internalization rates in vehicle- and BIRB796-treated cells is not statistically significant. (D–F) HeLa/FAP-EGFR cells were pretreated for 90 min with DMSO (vehicle) or 100 nM BIRB796, labeled with MG-B-Tau, and stimulated with 0.5 ng/ml or 20 ng/ml EGF-Rh for 15 min. Cells were fixed, and 3D imaging through 640-nm (green, EGFR) and 561-nm (red, EGF-Rh) channels was performed. In D, single confocal sections are shown. Scale bars, 10 µm. In E, the ratio of EGF-Rh and MG-B-Tau fluorescence (EGF-Rh/FAP-EGFR) in individual (ind.) endosomes was calculated in 3D images generated as in D. Median and quartiles are shown on the violin graph; n is >5,000 endosomes. In F, the interpretation of the data in E is proposed. Stimulation with 0.5 ng/ml EGF results in internalization of EGF:EGFR dimers and monomeric ligand-free receptors (in a p38-dependent manner) to the same endosomes. Inhibition of p38 results in endocytosis of only EGF:EGFR complexes but not ligand-free receptors, which leads to an apparent increase of the EGF/EGFR ratio per endosome. When cells are stimulated with the saturating concentration of EGF (20 ng/ml), p38-dependent internalization of free EGFR is negligible, and therefore, BIRB796 does not change the EGF:EGFR ratio in endosomes. A considerable fraction of EGF:EGFR dimers with 1:2 stoichiometry may exist in cells treated with 0.5 ng/ml EGFR (Macdonald and Pike, 2008).
Figure 6.
Figure 6.
Simultaneous cell stimulation with EGF and TNFα enhances ligand-free EGFR internalization only at low concentrations of EGF and targets ligand-bound and free EGFRs to the same endosomes. (A) HeLa/FAP-EGFR cells were treated with 0.48–100 ng/ml EGF in the absence (black) or presence (green) of 3 ng/ml TNFα for 15 min, and the FERI internalization assay was performed. Mean values of the 561/640 ratio with SEM of duplicates are plotted against log of EGF concentration. Values obtained in the absence of TNFα were subtracted from those in the presence of TNFα to estimate the contribution of TNFα-induced internalization of FAP-EGFR (dotted blue). This experiment is representative of several independent experiments. (B and C) HeLa/FAP-EGFR cells were incubated with 0.2 ng/ml (B) or 6 ng/ml (C) of 125I-EGF in the absence or presence of 3 ng/ml TNFα for 10 min at 37°C. Surface-bound and internalized 125I-EGF were measured, and the ratio of internalized and surface 125I-EGF is plotted against time. The data were normalized to the value of the internalized/surface 125I-EGF ratio at the 10-min point in the absence of TNFα. Mean values with SDs from three independent experiments are presented. Differences between internalization rates in control and TNFα-stimulated cells are not statistically significant. (D and E) HeLa/FAP-EGFR cells were labeled with MG-B-Tau and treated with 0.2 ng/ml or 10 ng/ml EGF-Rh for 15 min in the absence or presence of 3 ng/ml TNFα. After fixation, 3D images were acquired through 640-nm (green, FAP-EGFR) and 561-nm (red, EGF-Rh) channels. In D, single confocal sections of cells treated with 0.2 ng/ml EGF-Rh are shown. Insets are higher magnification images of regions marked by white rectangles in which the 561-nm channel image (red, EGF-Rh) was shifted by 3 pixels as indicated by the white arrow for better visualization of EGF-Rh and FAP-EGFR colocalization in individual (ind.) endosomes. Scale bars, 10 µm. In E, the ratio of EGF-Rh and MG-B-Tau fluorescence (EGF-Rh/FAP-EGFR) in individual endosomes calculated in images generated as in D. Median and quartiles are shown on the violin graph; n > 5,000 endosomes.
Figure 7.
Figure 7.
p38 activation by TNFα rescues inhibited EGFR internalization in Grb2-depleted HeLa/FAP-EGFR cells. (A) After pretreatment with DMSO (vehicle) or BIRB796 for 90 min, the cells were simultaneously labeled with MG-B-Tau and treated with DMSO (vehicle) or erlotinib (1 µM) for 10 min. The cells were then stimulated with 1 ng/ml EGF-Rh alone or together with 10 ng/ml TNFα for 15 min. Live-cell imaging was performed through 640-nm (green, FAP-EGFR) and 561-nm channels (red, EGF-Rh). Scale bars, 10 µm. (B) The cells were treated with 0.5 or 10 ng/ml EGF in the presence of 10 ng/ml TNFα for 15 min at 37°C. Cell lysates were immunoprecipitated with EGFR Mab528, pS1015 or pY1068 antibodies. Both total cell lysates (TCL) and immunoprecipitates (IP) were probed by immunoblotting with pY1068, pS1015, and EGFR (AB_631420) antibodies. (C and D) 3 d after transfection with nontargeting (NT) or Grb2 siRNAs, cells were stimulated with 1 or 10 ng/ml EGF (C) or EGF-Rh (D) in the absence or presence of 10 ng/ml TNFα. In C, FAP-EGFR internalization was examined using the FERI assay. For each treatment variant, the value of the 561/640 ratio was normalized to that ratio in NT-transfected cells treated with 10 ng/ml EGF. In D, FAP-EGFR was labeled with MG-B-Tau. 3D images were acquired through 640-nm (green, FAP-EGFR) and 561-nm (red, EGF-Rh) channels. The amount of EGF-Rh in FAP-EGFR–containing endosomes per cell was quantified. These values were normalized by maximum values obtained in NT cells treated with 10 ng/ml EGF-Rh in each experiment. Graph bars in C and D represent mean values with SEMs (n = 3 independent experiments). P values of Grb2 against NT were calculated using the unpaired Student’s t test. a.l.u.f.i., arbitrary linear unit of fluorescence intensity; WB, Western blot.
Figure 8.
Figure 8.
Moderate/high EGF concentrations minimize p38-dependent down-regulation of cell-surface FAP-EGFR without affecting p38 signaling. (A) HeLa/FAP-EGFR cells were incubated with 0, 0.2, or 6 ng/ml EGF for 10 min, in the absence or presence of 3 ng/ml TNFα. Cells were solubilized, and EGFR was immunoprecipitated from cell lysates. Aliquots of lysates (total cell lysates [TCL]) and immunoprecipitates (IP) were immunoblotted with pY1068, pS1046/47, pERK, p-p38, pMAPKAPK2, ubiquitin (Ub), Cbl, EGFR, and Grb2 (loading control) antibodies. (B–D) Cells were left untreated or treated with 0.5, 5, or 50 ng/ml EGF without (black lines) or with 10 ng/ml TNFα (green lines), or with TNFα alone (dashed blue) for 5–30 min. Cell-surface FAP-EGFR was then labeled by incubation with MG-B-Tau at 4°C, and MG-B-Tau fluorescence intensity was measured. All values of fluorescence intensity in treated cells were normalized to that value measured in untreated cells in each experiment. Values from untreated cells were used as 0 time points. The data represent mean values with SEM from four independent experiments plotted against time. WB, Western blot.
Figure 9.
Figure 9.
Clathrin-dependence of EGF- and TNFα-induced EGFR internalization and a working model of the relationships between various pathways of EGFR endocytosis. (A and B) HeLa/FAP-EGFR cells were transfected with nontargeting (NT; solid lines) or CHC siRNAs (dashed lines). 3 d later, FERI assay was performed after 15-min treatment with (A) 0.48–100 ng/ml EGF in the absence (black) or presence of 3 ng/ml TNFα (green); (B) 0.48–100 ng/ml TNFα in the absence (blue) or presence of 3 ng/ml EGF (purple). Mean values of 561/640 ratio obtained in cells depleted of CHC (internalization through CIE) were subtracted from those values in NT-transfected cells (total internalization) to estimate the amount of internalization via CME. Mean values with SEM from duplicates are shown in the graphs on the right. Experiments in A and B are representative of several independent experiments. (C) Working model of the relationships between distinct pathways of EGFR endocytosis in the presence of EGF and TNFα. The distribution of ligand-bound (red and blue) and free (green) EGFRs after 15-min stimulation is shown. Blue arrows, CME of ligand-bound EGFR; green arrows, CME of ligand-free EGFR; gray arrow, CIE of EGFR. The widths of arrows roughly correspond to the relative contribution of specific endocytic pathways in the total internalization of EGFR. Receptors internalized through a p38-dependent pathway or CIE are indicated by green or gray dotted lines, respectively. See Discussion for the description of the model. The model does not account for heterodimerization of EGFR with ErbB2 given a relatively low level of ErbB2 expression in HeLa cells and an impaired internalization of heterodimers.

References

    1. Ahmad, G., Mohapatra B.C., Schulte N.A., Nadeau S.A., Luan H., Zutshi N., Tom E., Ortega-Cava C., Tu C., Sanada M., et al. . 2014. Cbl-family ubiquitin ligases and their recruitment of CIN85 are largely dispensable for epidermal growth factor receptor endocytosis. Int. J. Biochem. Cell Biol. 57:123–134. 10.1016/j.biocel.2014.10.019 - DOI - PMC - PubMed
    1. Barbieri, M.A., Roberts R.L., Gumusboga A., Highfield H., Alvarez-Dominguez C., Wells A., and Stahl P.D.. 2000. Epidermal growth factor and membrane trafficking. EGF receptor activation of endocytosis requires Rab5a. J. Cell Biol. 151:539–550. 10.1083/jcb.151.3.539 - DOI - PMC - PubMed
    1. Ben-Levy, R., Leighton I.A., Doza Y.N., Attwood P., Morrice N., Marshall C.J., and Cohen P.. 1995. Identification of novel phosphorylation sites required for activation of MAPKAP kinase-2. EMBO J. 14:5920–5930. 10.1002/j.1460-2075.1995.tb00280.x - DOI - PMC - PubMed
    1. Boucrot, E., Ferreira A.P., Almeida-Souza L., Debard S., Vallis Y., Howard G., Bertot L., Sauvonnet N., and McMahon H.T.. 2015. Endophilin marks and controls a clathrin-independent endocytic pathway. Nature. 517:460–465. 10.1038/nature14067 - DOI - PubMed
    1. Burke, P.M., and Wiley H.S.. 1999. Human mammary epithelial cells rapidly exchange empty EGFR between surface and intracellular pools. J. Cell. Physiol. 180:448–460. 10.1002/(SICI)1097-4652(199909)180:3<448::AID-JCP16>3.0.CO;2-8 - DOI - PubMed

Publication types