. 2021 May 25;17(5):e1009576.
doi: 10.1371/journal.pgen.1009576. eCollection 2021 May.

Whole-genome analysis of Malawian Plasmodium falciparum isolates identifies possible targets of allele-specific immunity to clinical malaria

Affiliations

Whole-genome analysis of Malawian Plasmodium falciparum isolates identifies possible targets of allele-specific immunity to clinical malaria

Zalak Shah et al. PLoS Genet. .

Abstract

Individuals acquire immunity to clinical malaria after repeated Plasmodium falciparum infections. Immunity to disease is thought to reflect the acquisition of a repertoire of responses to multiple alleles in diverse parasite antigens. In previous studies, we identified polymorphic sites within individual antigens that are associated with parasite immune evasion by examining antigen allele dynamics in individuals followed longitudinally. Here we expand this approach by analyzing genome-wide polymorphisms using whole genome sequence data from 140 parasite isolates representing malaria cases from a longitudinal study in Malawi and identify 25 genes that encode possible targets of naturally acquired immunity that should be validated immunologically and further characterized for their potential as vaccine candidates.


Conflict of interest statement

The authors have declared that no competing interests exist.

Figures

Fig 1
Fig 1. Relationship between proportion of symptomatic infections and age.
Scatterplot, including linear regression line (blue), shows the relationship between the proportion of symptomatic infections per individual over the course of the study and age of the individual at enrollment. The dashed line shows median proportion of symptomatic infections, which was used to define the high and low immunity groups.
Fig 2
Fig 2. Genetic differentiation between parasites from high immunity vs. low immunity groups.
a) Genome-wide genetic differentiation (FST) between parasites from individuals with higher immunity vs. lower immunity. Each point represents a variable, non-synonymous site. Results are plotted as–log10 p-values on the y-axis. The color of each point represents the FST value, with darker points indicating higher FST values. The dashed line denotes statistical significance (p-value = 0.0095), with p-value determined by permutation. b) Nucleotide diversity for significantly differentiated SNPs in parasites from individuals with higher immunity and lower immunity. c) Box-plot of mean allele frequency per individual based on SNPs in the whole genome sequences, and which are significantly differentiated SNPs from (a). Red indicates the high immunity group and blue color indicates the low immunity group.
Fig 3
Fig 3. Analysis of mismatches in paired samples within and between individuals.
a) Illustration of analysis to identify regions of the genome that vary more in parasites causing illness within the same individual over time (within individuals) compared to random pairs of parasites in the population (between individuals). b) Distribution of differences in the proportion of mismatched alleles in the within group and the between group. The difference was calculated as the proportion of mismatches at each non-synonymous SNP in the within group minus the proportion of mismatches at each non-synonymous SNP in the between group. The dashed black line indicates the threshold for the top 1% most different SNPs in the within group compared to the between group.
Fig 4
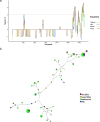
Fig 4. Global diversity of clag8.
a) Tajima’s D along the clag8 gene in samples from Thailand, PNG, Malawi, and Ghana. The dotted red lines represent a positive Tajima’s D value (≥ 2), suggestive of balancing selection. b) Haplotype network of clag8 using P. falciparum sequence data.

References

    1. WHO | World malaria report 2018 [Internet]. WHO. [cited 2019 May 30]. Available from: http://www.who.int/malaria/publications/world-malaria-report-2018/report...
    1. Marsh K, Kinyanjui S. Immune effector mechanisms in malaria. Parasite Immunol. 2006;28(1–2):51–60. doi: 10.1111/j.1365-3024.2006.00808.x - DOI - PubMed
    1. Cowman AF, Healer J, Marapana D, Marsh K. Malaria: Biology and Disease. Cell. 2016. Oct 20;167(3):610–24. doi: 10.1016/j.cell.2016.07.055 - DOI - PubMed
    1. Ryg-Cornejo V, Ly A, Hansen DS. Immunological processes underlying the slow acquisition of humoral immunity to malaria. Parasitology. 2016. Feb;143(2):199–207. doi: 10.1017/S0031182015001705 - DOI - PubMed
    1. Portugal S, Pierce SK, Crompton PD. Young Lives Lost as B Cells Falter: What We Are Learning About Antibody Responses in Malaria. J Immunol. 2013. Apr 1;190(7):3039–46. doi: 10.4049/jimmunol.1203067 - DOI - PMC - PubMed

Publication types

LinkOut - more resources