. 2021 Aug;191(8):1442-1453.
doi: 10.1016/j.ajpath.2021.05.005. Epub 2021 May 23.

Deep-Learning-Driven Quantification of Interstitial Fibrosis in Digitized Kidney Biopsies

Affiliations

Deep-Learning-Driven Quantification of Interstitial Fibrosis in Digitized Kidney Biopsies

Yi Zheng et al. Am J Pathol. 2021 Aug.

Abstract

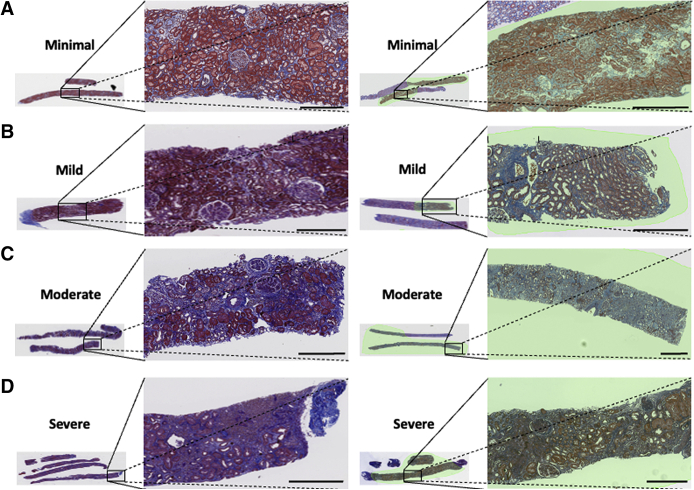
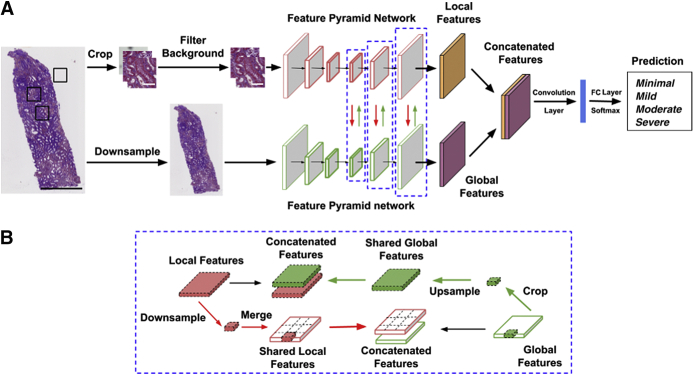
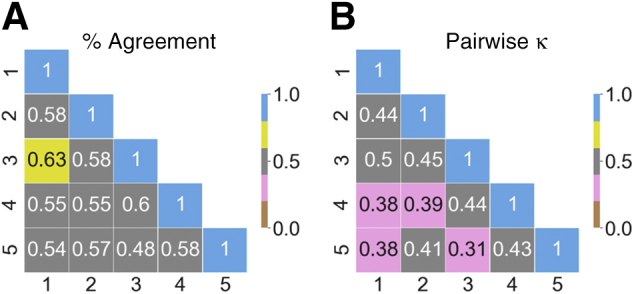
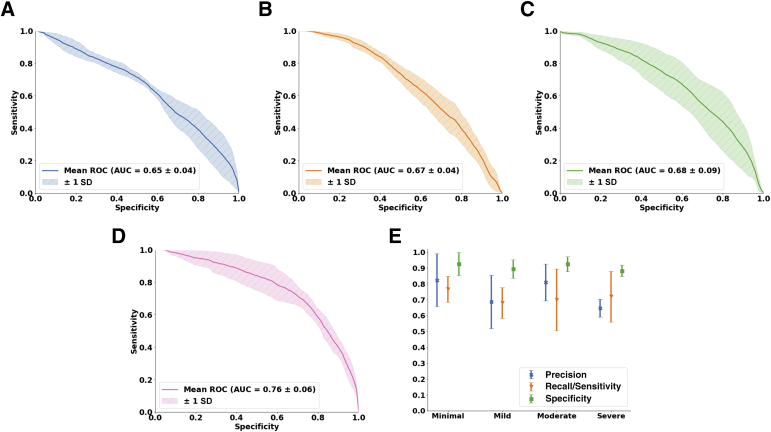
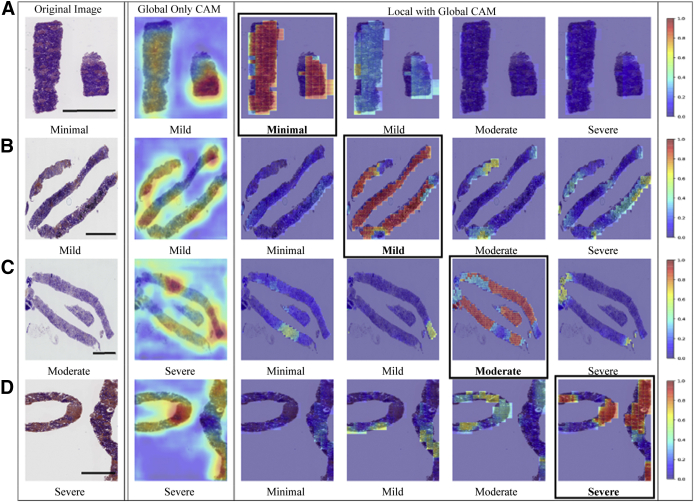
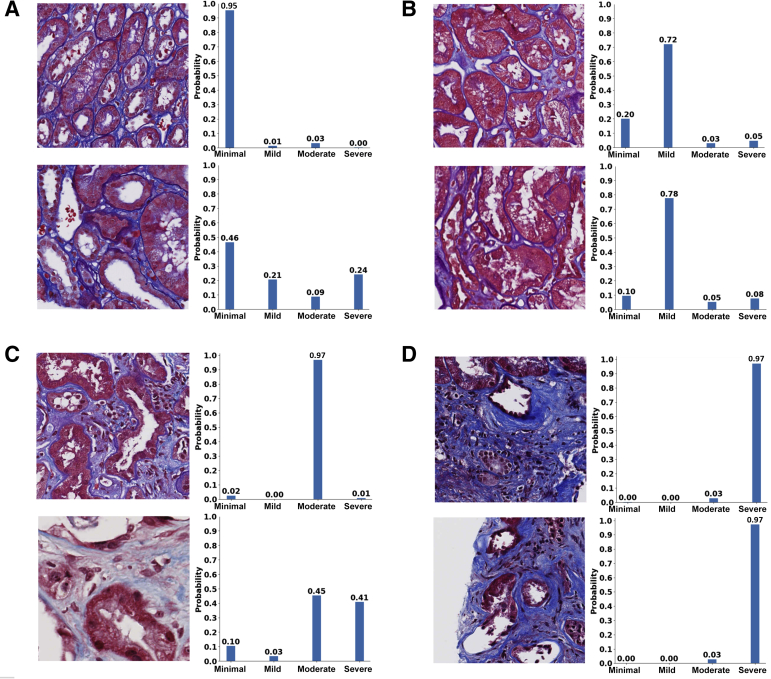
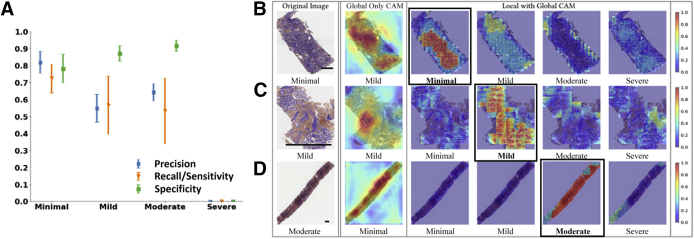
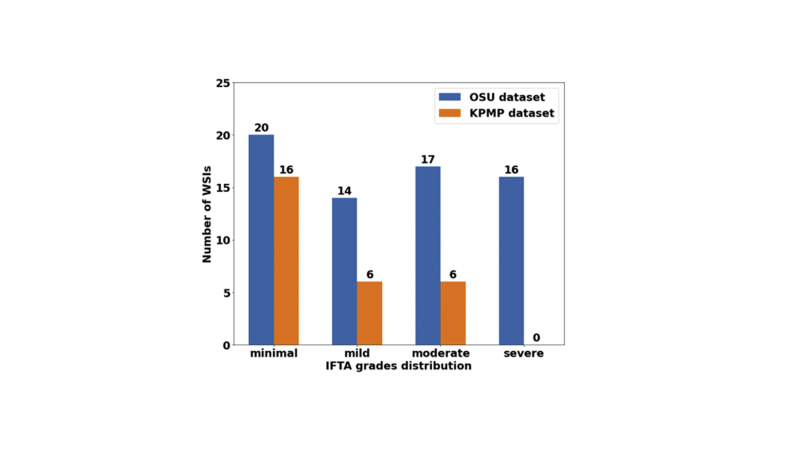
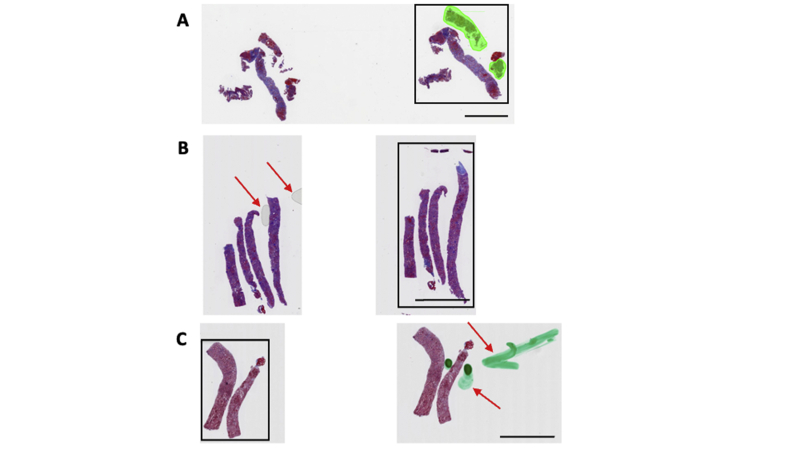
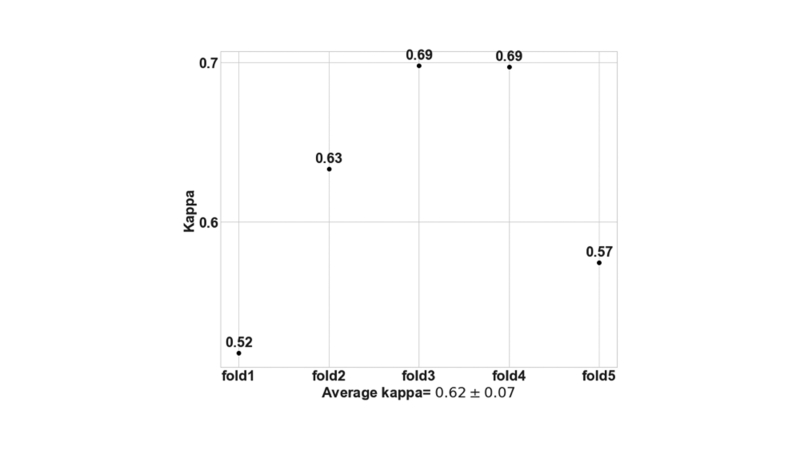
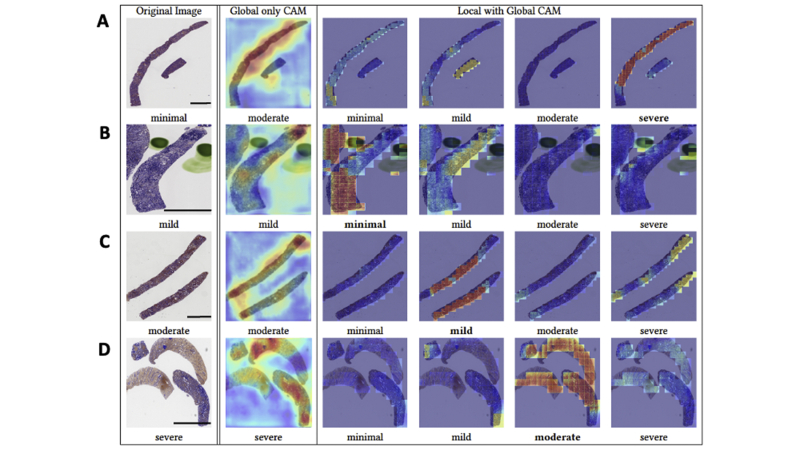
Interstitial fibrosis and tubular atrophy (IFTA) on a renal biopsy are strong indicators of disease chronicity and prognosis. Techniques that are typically used for IFTA grading remain manual, leading to variability among pathologists. Accurate IFTA estimation using computational techniques can reduce this variability and provide quantitative assessment. Using trichrome-stained whole-slide images (WSIs) processed from human renal biopsies, we developed a deep-learning framework that captured finer pathologic structures at high resolution and overall context at the WSI level to predict IFTA grade. WSIs (n = 67) were obtained from The Ohio State University Wexner Medical Center. Five nephropathologists independently reviewed them and provided fibrosis scores that were converted to IFTA grades: ≤10% (none or minimal), 11% to 25% (mild), 26% to 50% (moderate), and >50% (severe). The model was developed by associating the WSIs with the IFTA grade determined by majority voting (reference estimate). Model performance was evaluated on WSIs (n = 28) obtained from the Kidney Precision Medicine Project. There was good agreement on the IFTA grading between the pathologists and the reference estimate (κ = 0.622 ± 0.071). The accuracy of the deep-learning model was 71.8% ± 5.3% on The Ohio State University Wexner Medical Center and 65.0% ± 4.2% on Kidney Precision Medicine Project data sets. Our approach to analyzing microscopic- and WSI-level changes in renal biopsies attempts to mimic the pathologist and provides a regional and contextual estimation of IFTA. Such methods can assist clinicopathologic diagnosis.


Figures

Figure 1
Figure 1
Trichrome-stained whole-slide images of human renal biopsies. Sample trichrome images are shown on cases graded as minimal interstitial fibrosis and tubular atrophy (IFTA; A), mild IFTA (B), moderate IFTA (C), and severe IFTA (D). For each grade, two different images are shown. Left panels: Images had no annotations because the entire image was composed of the cortical region. Right panels: On the images, a nephropathologist (C.A.C.) annotated the cortical regions. For cases with no annotations, the entire image served as inputs to the deep-learning (DL) model; and for cases with annotations, the annotated regions were segmented, which served as inputs to the DL model. The final IFTA grading was derived by performing majority voting on the ratings obtained from five nephropathologists. Scale bars = 400 μm (AD).
Figure 2
Figure 2
Deep-learning architecture. A: The proposed deep neural network uses a novel approach that learns from both local and global image features to predict the output label of interest. The local features are learned at the level of image patches, and the global features are learned on a downsampled version of the whole image. The local and global feature maps are fused at each layer, where each layer is highlighted using a blue dashed boxed area. The black boxed areas on the whole-slide image (far left) denote the locations where image patches are extracted for further processing. B: A schematic representing local and global feature sharing is shown. Scale bars: 800 μm (A, black); 50 μm (A, white).
Figure 3
Figure 3
Pathologist-level interstitial fibrosis and tubular atrophy grading. A: Pairwise values of percentage agreement between the nephropathologists are shown on the cases obtained from The Ohio State University Wexner Medical Center (OSUWMC). The values were normalized to lie between 0 and 1. B: Pairwise κ scores between the nephropathologists on the OSUWMC data are shown. The κ values range from 0 to 1, where 0 indicates no agreement and 1 indicates perfect agreement.
Figure 4
Figure 4
Deep-learning model performance on The Ohio State University Wexner Medical Center data set. A–D: Patch-level performance of the fivefold cross-validated model is shown for each interstitial fibrosis and tubular atrophy (IFTA) grade. A: The receiver operating characteristic (ROC) curve for the minimal grade is shown. B: The ROC curve for the mild grade is shown. C and D: The ROC curves for moderate and severe grades, respectively, are shown. E: Model performance, including precision, sensitivity, and specificity on the entire whole-slide images, is shown for each IFTA grade. AUC, area under ROC curve.
Figure 5
Figure 5
Visualization of discriminatory regions within the pathology images. The first column represents the original whole-slide images (WSIs) along with the ground truth labels derived using majority voting on the pathologists' interstitial fibrosis and tubular atrophy (IFTA) grades. The second column shows global class activation maps (CAMs) generated on the entire WSI and the global CAM-based model predictions. The third to sixth columns show CAMs derived by combining local and global representations for each class label along with their corresponding model predictions. The CAM indicating the correct prediction is indicated with a black border around it. A: In the first row, a case with a minimal IFTA grade is shown. The approach that used global CAMs only predicted the IFTA grade as mild, whereas the approach using local and global CAMs correctly predicted the IFTA grade as minimal. B: In the second row, a case with a mild IFTA grade is shown. Both the approaches that used global CAMs only and the one that used local and global CAMs correctly predicted the IFTA grade as mild. C: In the third row, a case with a moderate IFTA grade is shown. The approach that used global CAMs only predicted the IFTA grade as severe, whereas the approach using local and global CAMs correctly predicted the IFTA grade as moderate. D: In the fourth row, a case with a severe IFTA grade is shown. Both the approaches that used global CAMs only and the one that used local and global CAMs correctly predicted the IFTA grade as severe. All these cases were obtained from The Ohio State University Wexner Medical Center. Scale bars = 1300 μm (AD).
Figure 6
Figure 6
Patch-level probabilities of the deep-learning model. Selected image patches and their corresponding probability values for each interstitial fibrosis and tubular atrophy (IFTA) grade are shown. A: The set of image patches shows the ones with minimal IFTA. B: The patches indicate the ones with mild IFTA. C: The cases show image patches with moderate IFTA. D: The image patches indicate the cases with severe IFTA. All the image patches and their corresponding probability values were reviewed by a nephropathologist (C.A.C.). All patches are of the same scale. Scale bars = 50 μm (AD).
Figure 7
Figure 7
Deep-learning model performance on the Kidney Precision Medicine Project data set. A: Model performance, including precision, sensitivity, and specificity on the entire whole-slide images (WSIs), is shown for each interstitial fibrosis and tubular atrophy (IFTA) grade. Note that performance scores for the severe IFTA label were not computed because none of the cases was graded as severe IFTA. B–D: Class activation maps (CAMs) were generated on the data set. The first column represents the original WSIs along with the ground truth labels derived using majority voting on the pathologists' IFTA grades. The second column shows global CAMs generated on the entire WSI and the global CAM-based model predictions. The third to sixth columns show CAMs derived by combining local and global representations for each class label along with their corresponding model predictions. The CAM indicating the correct prediction is indicated with a black border around it. B: In the first row, a case with a minimal IFTA grade is shown. The approach that used global CAMs only predicted the IFTA grade as mild, whereas the approach using local and global CAMs correctly predicted the IFTA grade as minimal. C: In the second row, a case with a mild IFTA grade is shown. Both the approaches that used global CAMs only and the one that used local and global CAMs correctly predicted the IFTA grade as mild. D: In the third row, a case with a moderate IFTA grade is shown. The approach that used global CAMs only predicted the IFTA grade as minimal, whereas the approach using local and global CAMs correctly predicted the IFTA grade as moderate. n = 28 (A). Scale bar = 400 μm (BD).
Supplemental Figure S1
Whole-slide image (WSI) distribution. Numbers of WSIs per interstitial fibrosis and tubular atrophy (IFTA) grade in The Ohio State University (OSU) Wexner Medical Center and Kidney Precision Medicine Project (KPMP) data sets are shown.
Supplemental Figure S2
Quality check and region of interest selection. A manual quality check was performed by a nephropathologist to identify and select whole-slide image regions that served as inputs to the deep-learning model. A: In this case, the core on the extreme right, containing both the cortex and the medulla, was selected for further analysis. B: This case shows the presence of air bubbles (red arrows) on the second core. The third core was selected for further analysis. C: This case shows staining artifacts (red arrows) on the second core. The first core was selected for further analysis. Scale bar = 3000 μm (AC).
Supplemental Figure S3
Model agreement with the ground truth. Fivefold cross validation was performed on The Ohio State University Wexner Medical Center data set to evaluate the deep-learning model. For each fold, κ was computed to evaluate the agreement of the model with the ground truth, defined using majority voting on the interstitial fibrosis and tubular atrophy grading performed by the nephropathologists.
Supplemental Figure S4
Visualization of discriminatory regions within the pathology images. The first column represents the original whole-slide images (WSIs) along with the ground truth labels derived using majority voting on the pathologists' interstitial fibrosis and tubular atrophy (IFTA) grades. The second column shows global class activation maps (CAMs) generated on the entire WSI and the global CAM-based model predictions. The third to sixth columns show CAMs derived by combining local and global representations for each class label along with their corresponding model predictions. A: In the first row, a case with a minimal IFTA grade is shown. The approach that used global CAMs only predicted the IFTA grade as moderate, whereas the approach using local and global CAMs predicted the IFTA grade as severe. B: In the second row, a case with a mild IFTA grade is shown. In this case, the global only CAM-based model correctly predicted the IFTA grade, whereas the local and global CAM-based approach predicted the IFTA grade as minimal. C: In the third row, a case with a moderate IFTA grade is shown. The approach that used global CAMs only correctly predicted the IFTA grade as moderate, whereas the approach using local and global CAMs incorrectly predicted the IFTA grade as mild. D: In the fourth row, a case with a severe IFTA grade is shown. The approach that used global CAMs only correctly predicted the IFTA grade as severe, whereas the approach using local and global CAMs correctly predicted the IFTA grade as moderate. All these cases were obtained from The Ohio State University Wexner Medical Center. Scale bar = 1300 μm (AD).

References

    1. Amann K., Haas C.S. What you should know about the work-up of a renal biopsy. Nephrol Dial Transpl. 2006;21:1157–1161. - PubMed
    1. Farris A.B., Alpers C.E. What is the best way to measure renal fibrosis?: a pathologist's perspective. Kidney Int Suppl (2011) 2014;4:9–15. - PMC - PubMed
    1. Farris A.B., Adams C.D., Brousaides N., Della Pelle P.A., Collins A.B., Moradi E., Smith R.N., Grimm P.C., Colvin R.B. Morphometric and visual evaluation of fibrosis in renal biopsies. J Am Soc Nephrol. 2011;22:176–186. - PMC - PubMed
    1. Becker J.U., Mayerich D., Padmanabhan M., Barratt J., Ernst A., Boor P., Cicalese P.A., Mohan C., Nguyen H.V., Roysam B. Artificial intelligence and machine learning in nephropathology. Kidney Int. 2020;98:65–75. - PMC - PubMed
    1. Barisoni L., Lafata K.J., Hewitt S.M., Madabhushi A., Balis U.G.J. Digital pathology and computational image analysis in nephropathology. Nat Rev Nephrol. 2020;16:669–685. - PMC - PubMed

Publication types