. 2021 Aug:203:102077.
doi: 10.1016/j.pneurobio.2021.102077. Epub 2021 May 24.

Altered maturation and atypical cortical processing of spoken sentences in autism spectrum disorder

Affiliations

Altered maturation and atypical cortical processing of spoken sentences in autism spectrum disorder

Jussi Alho et al. Prog Neurobiol. 2021 Aug.

Abstract

Autism spectrum disorder (ASD) is associated with widespread receptive language impairments, yet the neural mechanisms underlying these deficits are poorly understood. Neuroimaging has shown that processing of socially-relevant sounds, including speech and non-speech, is atypical in ASD. However, it is unclear how the presence of lexical-semantic meaning affects speech processing in ASD. Here, we recorded magnetoencephalography data from individuals with ASD (N = 22, ages 7-17, 4 females) and typically developing (TD) peers (N = 30, ages 7-17, 5 females) during unattended listening to meaningful auditory speech sentences and meaningless jabberwocky sentences. After adjusting for age, ASD individuals showed stronger responses to meaningless jabberwocky sentences than to meaningful speech sentences in the same left temporal and parietal language regions where TD individuals exhibited stronger responses to meaningful speech. Maturational trajectories of meaningful speech responses were atypical in temporal, but not parietal, regions in ASD. Temporal responses were associated with ASD severity, while parietal responses were associated with aberrant involuntary attentional shifting in ASD. Our findings suggest a receptive speech processing dysfunction in ASD, wherein unattended meaningful speech elicits abnormal engagement of the language system, while unattended meaningless speech, filtered out in TD individuals, engages the language system through involuntary attention capture.

Keywords: Auditory; Autism; Event-related fields; Language; Magnetoencephalography; Speech.


Figures

Figure 1:
Figure 1:. Spectrograms of stimuli used in the experimental paradigm.
(A) First speech sentence. (B) Second speech sentence. (C) First jabberwocky sentence (corresponding to A). (D) Second jabberwocky sentence (corresponding to B). Transcriptions of the sentences are written above the spectrograms. The participants watched a silenced movie while the sentences were being played in random order via earphones.
Figure 2:
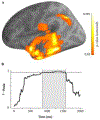
Figure 2:. Delineation of significant group differences in the spatio-temporal domain.
(A) The spatial extent of statistically significant group × condition (speech vs. jabberwocky) interaction depicted on inflated left hemisphere of the brain. Permutation p-values smaller than 0.05 (corrected) are color-coded on a red-yellow scale, with brighter colour indicating a more significant interaction. (B) The 1 – pmin of the group × condition interaction at each time point. The shaded area shows the time window (840 – 1540 ms after stimulus onset) with statistically significant interaction.
Figure 3:
Figure 3:. ERFs to speech and jabberwocky stimuli in TD and ASD in each ROI.
(A) ROIs depicted on an inflated brain surface. From left to right: anterior superior temporal (yellow), anterior middle temporal (blue), posterior superior temporal (cyan), posterior middle temporal (orange), and inferior parietal (white). (B) ERFs from the ROIs for 2000 ms post stimulus onset. The grey areas indicate temporal extents of statistically significant group × condition interaction. The exact times for each grey window are indicated in the subplot’s title.
Figure 4:
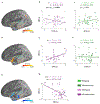
Figure 4:. Correlation between ERFs and age, adjusted for NVIQ and VIQ.
(A-C) Clusters showing significant age vs. speech ERF correlation (at p < 0.05, cluster-corrected) in the TD group plotted on the left hemisphere inflated cortical surface with the ROIs underlaid. (D) Speech ERFs extracted from the cluster in A plotted against age in both groups. (E) Speech ERFs extracted from the cluster in B plotted against age in both groups. (F) Speech ERFs extracted from the cluster in C plotted against age in both groups. (G) Jabberwocky ERFs extracted from the cluster in A plotted against age in both groups. (H) Jabberwocky ERFs extracted from the cluster in B plotted against age in both groups. (I) Jabberwocky ERFs extracted from the cluster in C plotted against age in both groups. In D-I, Pearson correlation coefficients (r) and p-values for within-group correlations, as well as p-values for the difference in correlations between the groups, are displayed above each plot. The plotted values are the z-scored residuals after regressing out NVIQ and VIQ from both the ERFs and ages of participants. Statistically significant correlations are indicated by asterisks (*p<0.05, **p<0.01, ***p<0.001).
Figure 5:
Figure 5:. Group × condition interaction in each ROI.
Plots of group mean ERFs (thick horizontal black line) with kernel density estimation (KDE) of the underlying distribution separately for speech and jabberwocky conditions. The KDEs are limited within the range of the observed data. The ERFs were averaged over the ROI-specific significant group × condition interaction time window. Individual responses are overlaid on the KDE plot with the change between speech and jabberwocky ERFs indicated by a connecting line. Error bars around the mean represent standard error of the mean. NVIQ, VIQ, and age of the participants were regressed out from the ERFs and the residuals were normalized between 0 and 1. The F-statistic, p-value, and effect size (partial eta squared, ηp2) for the group × condition interactions are shown above each plot. The observed effects sizes varied from medium (0.6–0.14) to large (>0.14).
Figure 6:
Figure 6:. Correlation between ERFs and behavioral scores, adjusted for age, NVIQ, and VIQ.
(A) Cluster showing significant ICSS vs. speech-jabberwocky contrast ERF correlation in the ASD group. (B) Speech and jabberwocky ERFs extracted from the cluster in A plotted against ICSS in the ASD group. (C) Speech and jabberwocky ERFs extracted from the cluster in A plotted against ICSS in the TD group. (D) Cluster showing significant ASPS vs. speech ERF correlation in the ASD group. (E) Speech and jabberwocky ERFs extracted from the cluster in D plotted against ASPS in the ASD group. (F) Speech and jabberwocky ERFs extracted from the cluster in D plotted against ASPS in the TD group. (G) Clusters showing significant SRS vs. speech ERF correlation in the ASD group. (H) Speech and jabberwocky ERFs extracted from the largest cluster in the anterior superior temporal cortex in G plotted against SRS in the ASD group. In A, D, and G, significant clusters (at p<0.05, cluster-corrected) are plotted on the left hemisphere inflated cortical surface with the ROIs underlaid. Above each plot, Pearson correlation coefficients (r) and p-values for within-condition correlations are shown. In B and C, p-values for the difference between the within-condition correlations are also shown. All plotted values are the z-scored residuals after regressing out age, NVIQ, and VIQ from both the ERFs and behavioral scores. {r1, c17} Statistically significant correlations are indicated by asterisks: *p<0.05, Bonferroni-corrected over the number of independent behavioral scores (N=2; see SI.R.1); **p<0.05, Bonferroni-corrected over the two independent behavioral scores and the two groups (N=4); ***p<0.05, Bonferroni-corrected over all comparisons irrespective of dependence, i.e., two groups, two conditions, and three behavioral scores (N=10, because SRS scores were not collected for the TD participants). S: speech: J: jabberwocky.

References

    1. Ahlfors SP, Han J, Lin FH, Witzel T, Belliveau JW, Hämäläinen MS, Halgren E, 2010. Cancellation of EEG and MEG signals generated by extended and distributed sources. Hum. Brain Mapp 10.1002/hbm.20851 - DOI - PMC - PubMed
    1. Ahtam B, Braeutigam S, Bailey A, 2020. Semantic Processing in Autism Spectrum Disorders Is Associated With the Timing of Language Acquisition: A Magnetoencephalographic Study. Front. Hum. Neurosci 14, 267. 10.3389/fnhum.2020.00267 - DOI - PMC - PubMed
    1. Alaerts K, Nayar K, Kelly C, Raithel J, Milham MP, Di martino A, 2015. Age-related changes in intrinsic function of the superior temporal sulcus in autism spectrum disorders. Soc. Cogn. Affect. Neurosci 10.1093/scan/nsv029 - DOI - PMC - PubMed
    1. Alcántara JI, Weisblatt EJL, Moore BCJ, Bolton PF, 2004. Speech-in-noise perception in high-functioning individuals with autism or Asperger’s syndrome. J. Child Psychol. Psychiatry Allied Discip 10.1111/j.1469-7610.2004.t01-1-00303.x - DOI - PubMed
    1. Bebko JM, Weiss JA, Demark JL, Gomez P, 2006. Discrimination of temporal synchrony in intermodal events by children with autism and children with developmental disabilities without autism. J. Child Psychol. Psychiatry Allied Discip 10.1111/j.1469-7610.2005.01443.x - DOI - PubMed

Publication types