. 2021 May;18(178):20210096.
doi: 10.1098/rsif.2021.0096. Epub 2021 May 26.

Spatial connectivity in mosquito-borne disease models: a systematic review of methods and assumptions

Affiliations

Spatial connectivity in mosquito-borne disease models: a systematic review of methods and assumptions

Sophie A Lee et al. J R Soc Interface. 2021 May.

Abstract

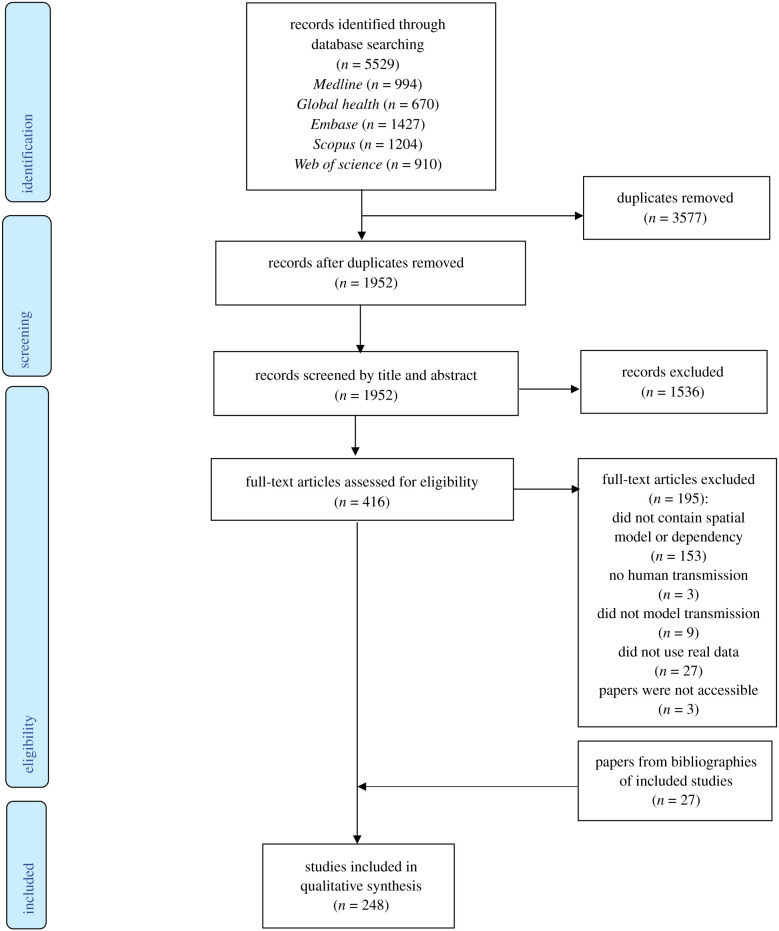
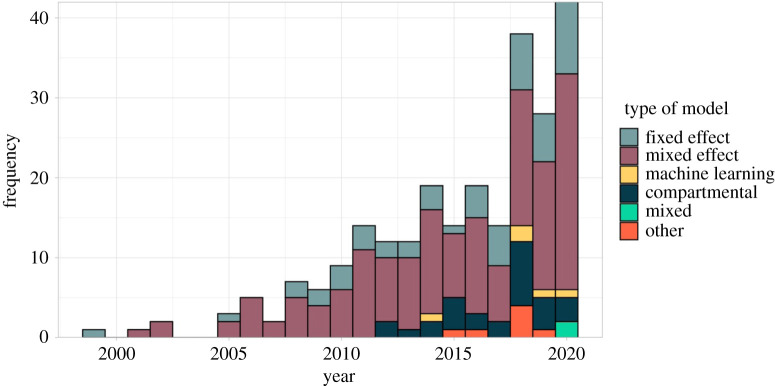
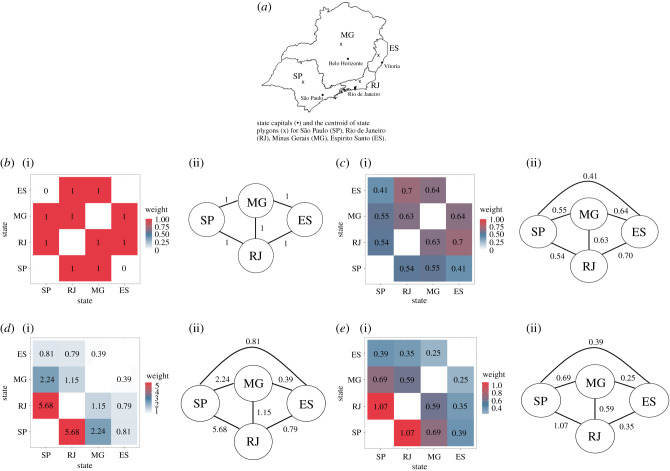
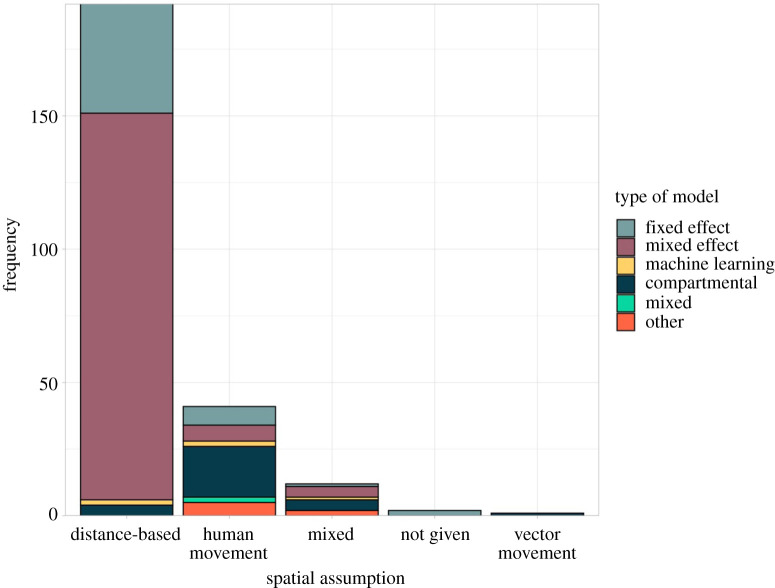
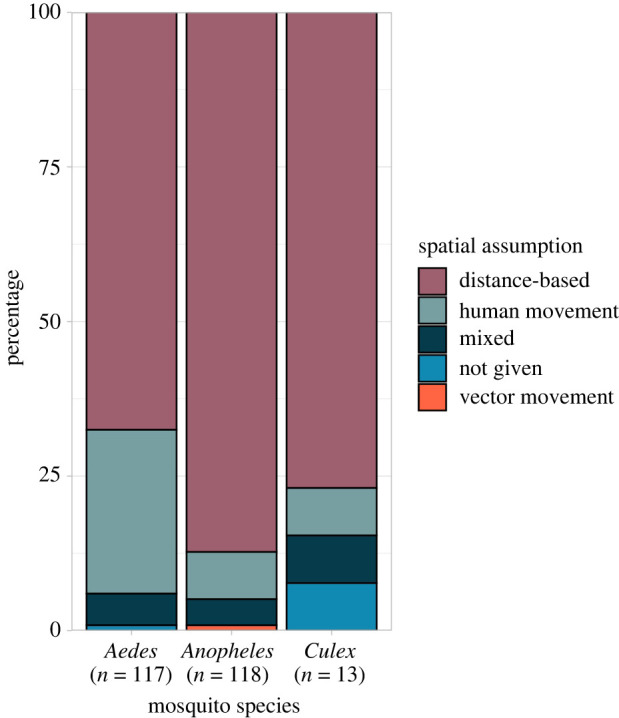
Spatial connectivity plays an important role in mosquito-borne disease transmission. Connectivity can arise for many reasons, including shared environments, vector ecology and human movement. This systematic review synthesizes the spatial methods used to model mosquito-borne diseases, their spatial connectivity assumptions and the data used to inform spatial model components. We identified 248 papers eligible for inclusion. Most used statistical models (84.2%), although mechanistic are increasingly used. We identified 17 spatial models which used one of four methods (spatial covariates, local regression, random effects/fields and movement matrices). Over 80% of studies assumed that connectivity was distance-based despite this approach ignoring distant connections and potentially oversimplifying the process of transmission. Studies were more likely to assume connectivity was driven by human movement if the disease was transmitted by an Aedes mosquito. Connectivity arising from human movement was more commonly assumed in studies using a mechanistic model, likely influenced by a lack of statistical models able to account for these connections. Although models have been increasing in complexity, it is important to select the most appropriate, parsimonious model available based on the research question, disease transmission process, the spatial scale and availability of data, and the way spatial connectivity is assumed to occur.

Keywords: epidemiology; infectious disease dynamics; machine learning; spatial analysis; vector-borne disease.


Figures

Figure 1.
Figure 1.
PRISMA flow diagram of the search and exclusion process.
Figure 2.
Figure 2.
Number of spatial modelling studies published per year by model type. Statistical models were classified as a fixed effect if parameters were treated as fixed, non-random values or mixed effect if they also included random parameters to account for unobserved heterogeneity or clustering (also known as hierarchical or multilevel models). Machine learning models used algorithms to learn patterns from the data. Compartmental models were mechanistic models that simulated the movement of hosts and/or vectors through disease compartments. Models classified as 'other' did not fall into any of these categories, this included mechanistic models that did not explicitly model movement through compartments, or bespoke statistical models.
Figure 3.
Figure 3.
Comparison of spatial connectivity using different data sources and assumptions. The level of connectivity between regions represented in models can differ substantially depending on the assumptions made about how connectivity arises, and the data used to weight connections. The heat plots and connectivity matrices show the strength of connectivity between states in Southeast Brazil (a), represented by nodes in the matrices, using assumptions and methods identified in this review. Numbers within the heat plot and along edges of the connectivity matrix represent the weight of connections. These techniques were used to weight observations in GWR models, to structure random effects and random fields, or to weight movement matrices in neural networks, metapopulation models, and agent-based models. (b) Neighbourhood based: assumes states are connected if and only if they share a border. Application: to structure random effects in a CAR model. (c) Distance-based: assumes connectivity between states decays exponentially as distance between centroids (denoted x on the map) increases, where weight = exp(dij /1000) and dij is the distance between states i and j. Application: used to weight observations from neighbouring regions in a GWR model. (d) Human movement data: assumes connectivity between states arises due to human movement. In this case, based on the number of air travel passengers moving between capital cities of each state. Application: to weight hidden layers within a neural network. (e) Movement model: assumes connectivity between states arises due to human movement, estimated using a movement model (in this case, a gravity model). Application: used to weight movement between nodes in a metapopulation model.
Figure 4.
Figure 4.
Connectivity assumption by model type. The number of spatial modelling studies that assumed connectivity is based on distance, human movement or vector movement (bars) separated by model type. The vast majority of statistical models (fixed and mixed effect models) assumed that connectivity was based on distance, whereas compartmental models were more likely to assume human movement drives connectivity.
Figure 5.
Figure 5.
Connectivity assumptions by mosquito species. The percentage of studies modelling a disease transmitted by each mosquito species that assumed spatial connectivity is related to the distance between regions or observations (using a distance-based function or a neighbourhood structure), human movement or vector movement. Dengue fever, chikungunya, yellow fever and Zika were transmitted by mosquitoes of the Aedes genus; malaria was transmitted by mosquitoes of the Anopheles genus, and Japanese encephalitis, Rift Valley fever and West Nile fever were transmitted by mosquitoes of the Culex genus.

References

    1. World Health Organization. 2017. UNICEF. Global vector control response 2017–2030.
    1. Wilder-Smith A, Gubler DJ, Weaver SC, Monath TP, Heymann DL, Scott TW. 2017. Epidemic arboviral diseases: priorities for research and public health. Lancet Infect. Dis. 17, e101-e106. (10.1016/S1473-3099(16)30518-7) - DOI - PubMed
    1. Paixão ES, Teixeira MG, Rodrigues LC. 2018. Zika, chikungunya and dengue: the causes and threats of new and re-emerging arboviral diseases. BMJ Glob. Health. 3(Suppl. 1), e000530. (10.1136/bmjgh-2017-000530) - DOI - PMC - PubMed
    1. Khan K, et al. 2014. Assessing the origin of and potential for international spread of chikungunya virus from the Caribbean. PLoS Curr. 6. (10.1371/currents.outbreaks.2134a0a7bf37fd8d388181539fea2da5) - DOI - PMC - PubMed
    1. Schaffner F, Mathis A. 2014. Dengue and dengue vectors in the WHO European region: past, present, and scenarios for the future. Lancet Infect. Dis. 14, 1271-1280. (10.1016/S1473-3099(14)70834-5) - DOI - PubMed

Publication types

LinkOut - more resources