. 2021 May 25;22(1):160.
doi: 10.1186/s13059-021-02381-4.

Genome-wide DNA mutations in Arabidopsis plants after multigenerational exposure to high temperatures

Affiliations

Genome-wide DNA mutations in Arabidopsis plants after multigenerational exposure to high temperatures

Zhaogeng Lu et al. Genome Biol. .

Abstract

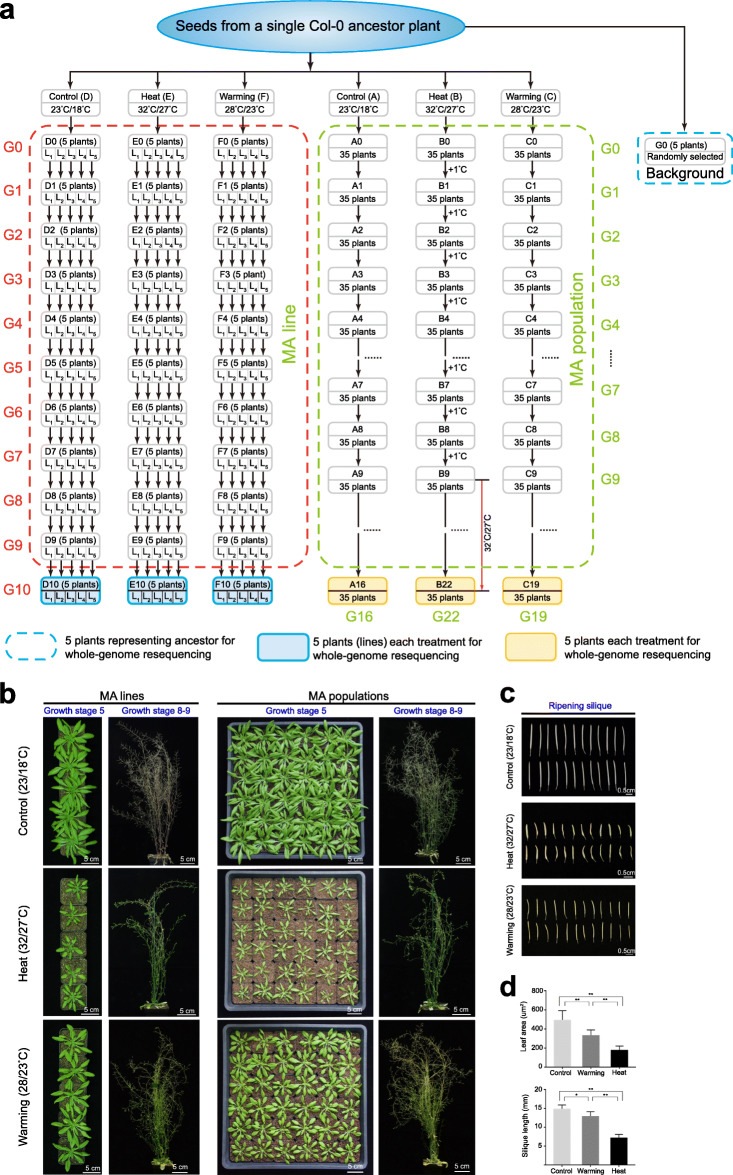
Background: Elevated temperatures can cause physiological, biochemical, and molecular responses in plants that can greatly affect their growth and development. Mutations are the most fundamental force driving biological evolution. However, how long-term elevations in temperature influence the accumulation of mutations in plants remains unknown.

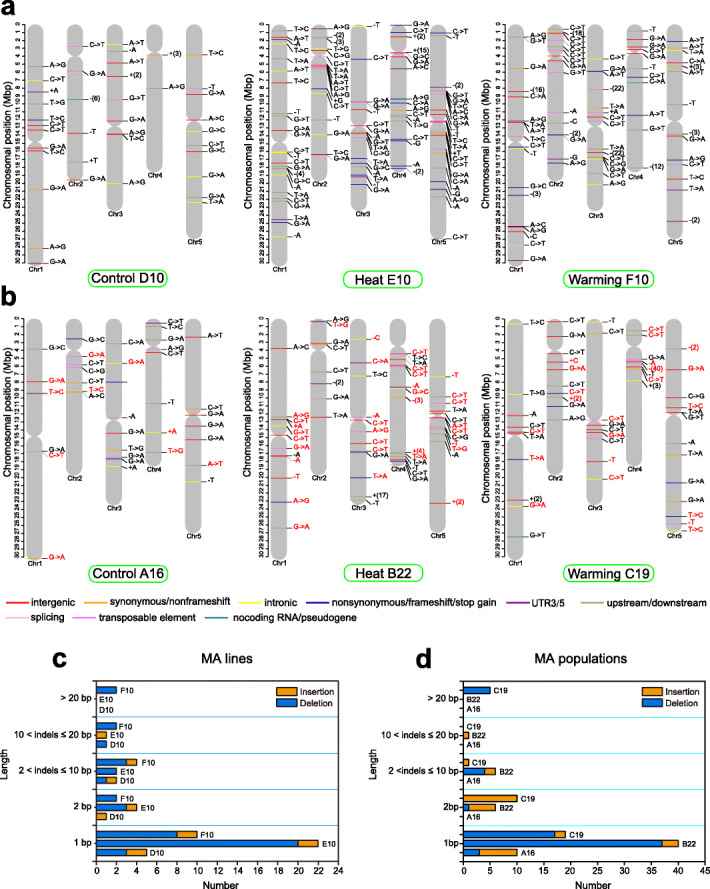
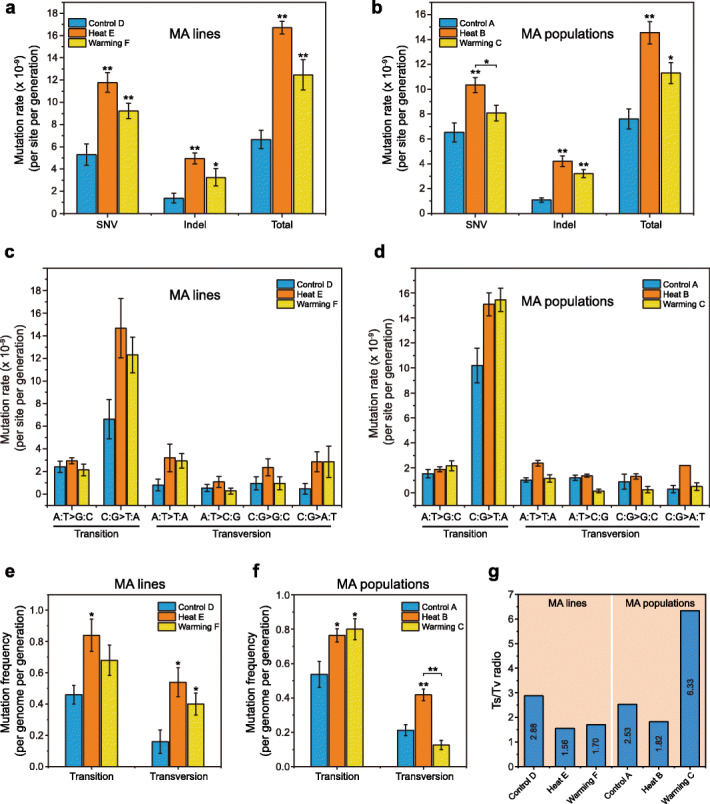
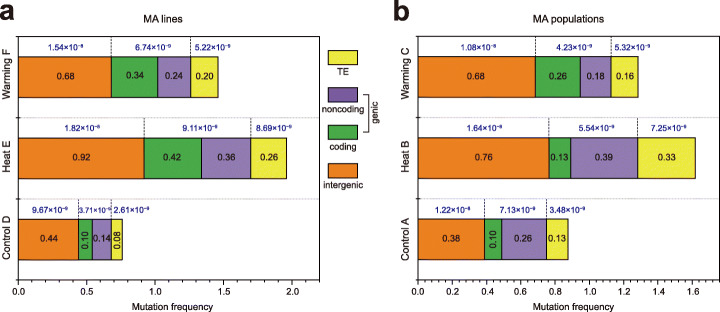
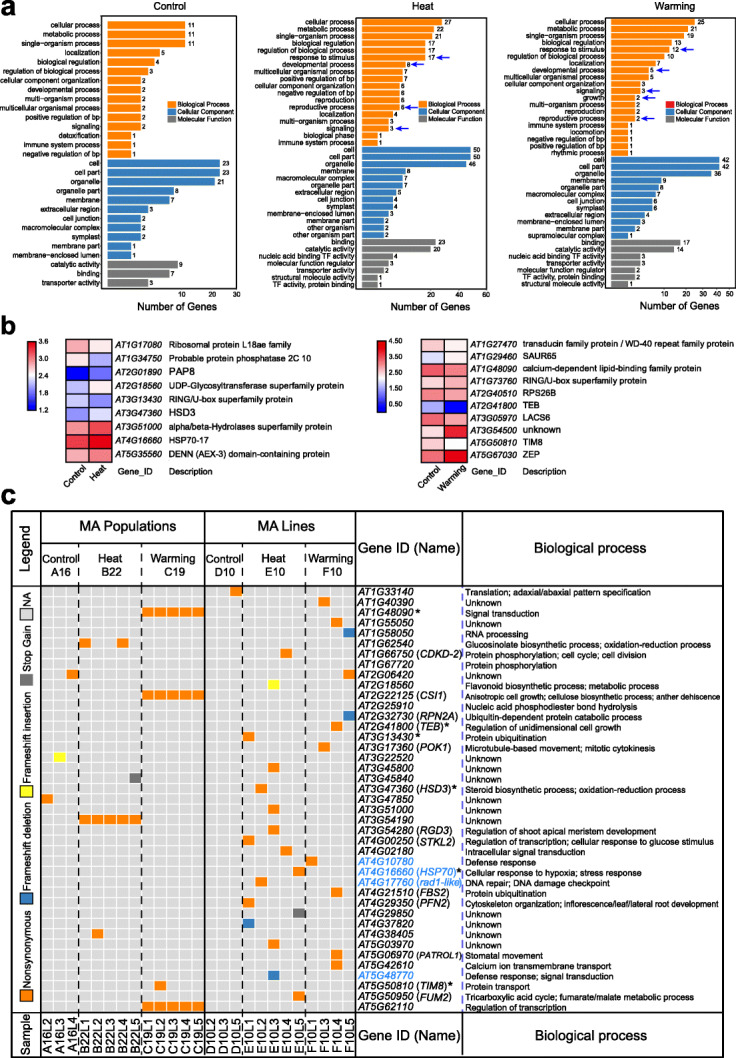
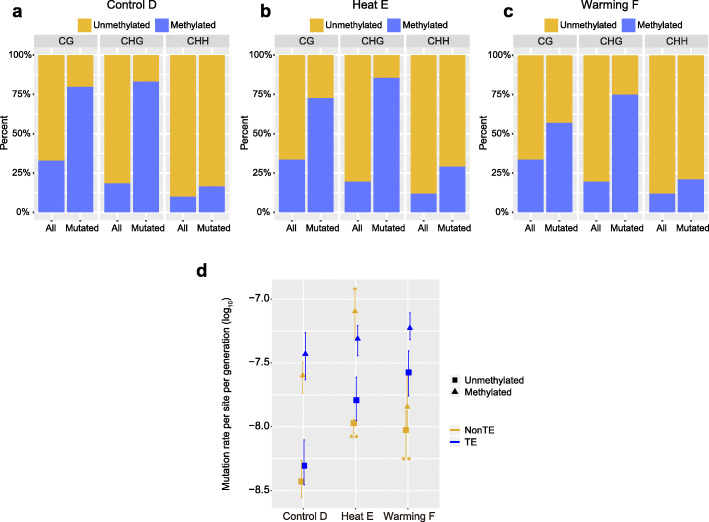
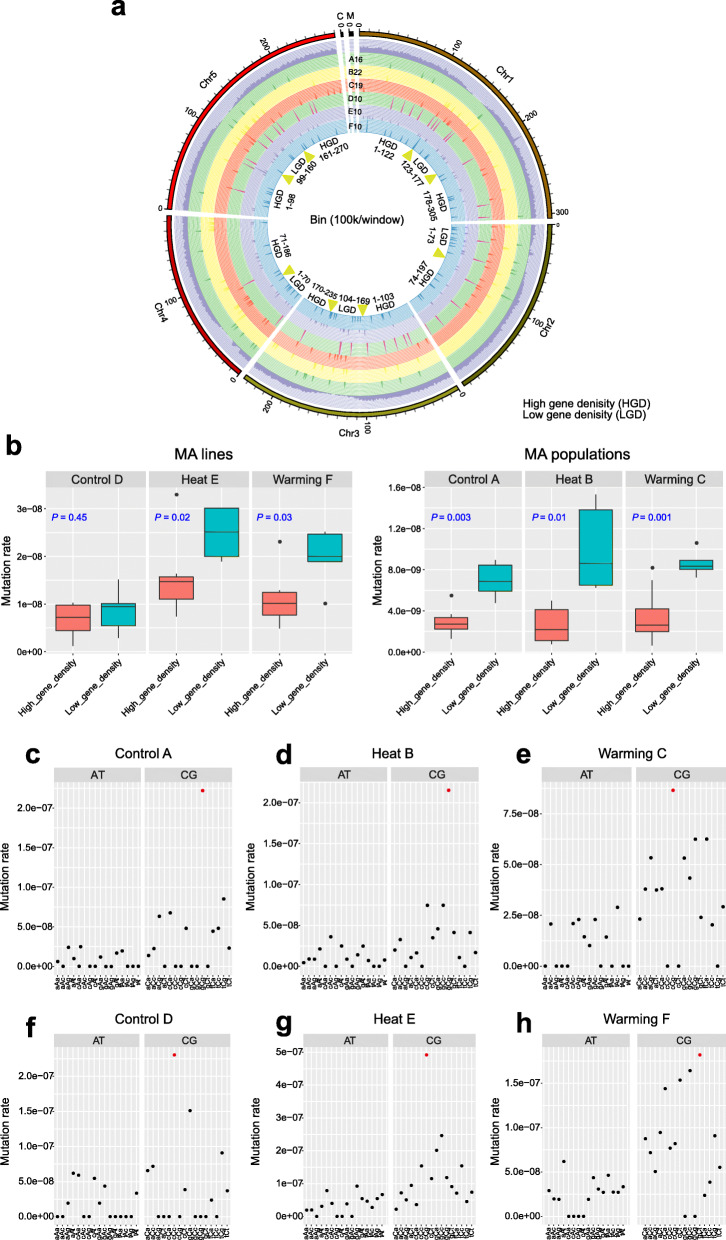
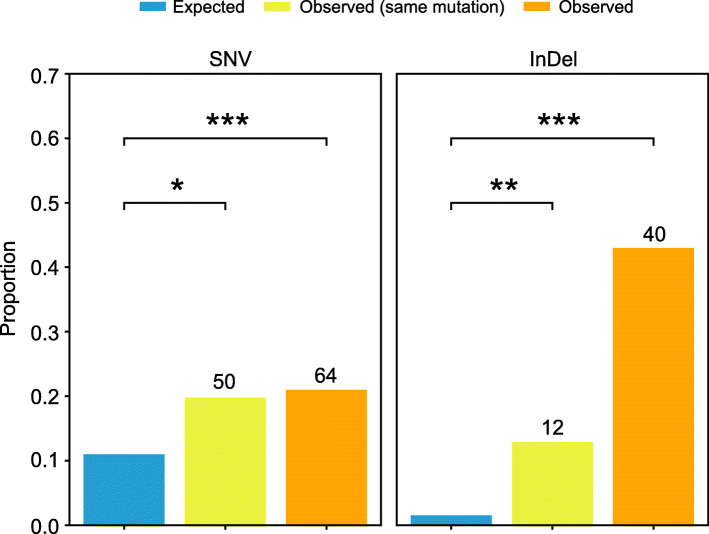
Results: Multigenerational exposure of Arabidopsis MA (mutation accumulation) lines and MA populations to extreme heat and moderate warming results in significantly increased mutation rates in single-nucleotide variants (SNVs) and small indels. We observe distinctive mutational spectra under extreme and moderately elevated temperatures, with significant increases in transition and transversion frequencies. Mutation occurs more frequently in intergenic regions, coding regions, and transposable elements in plants grown under elevated temperatures. At elevated temperatures, more mutations accumulate in genes associated with defense responses, DNA repair, and signaling. Notably, the distribution patterns of mutations among all progeny differ between MA populations and MA lines, suggesting that stronger selection effects occurred in populations. Methylation is observed more frequently at mutation sites, indicating its contribution to the mutation process at elevated temperatures. Mutations occurring within the same genome under elevated temperatures are significantly biased toward low gene density regions, special trinucleotides, tandem repeats, and adjacent simple repeats. Additionally, mutations found in all progeny overlap significantly with genetic variations reported in 1001 Genomes, suggesting non-uniform distribution of de novo mutations through the genome.

Conclusion: Collectively, our results suggest that elevated temperatures can accelerate the accumulation, and alter the molecular profiles, of DNA mutations in plants, thus providing significant insight into how environmental temperatures fuel plant evolution.

Keywords: Arabidopsis thaliana; Heat; Molecular evolution; Mutation accumulation; Mutation bias; Mutation rate; Mutation spectrum; Transposable element; Warming.


Conflict of interest statement

The authors declare that they have no competing interests.

Figures

Fig. 1
Fig. 1
Schematic illustration and morphological comparison of A. thaliana grown under Control, Heat, and Warming conditions. a Schematic illustration of A. thaliana mutation accumulation (MA) lines and populations. Two MA experiments were conducted in this study (see “Methods”). For MA line experiments, seeds from a single Col-0 ancestor plant were grown independently under Control (D), Heat (E), or Warming (F) conditions for 10 successive generations. Five 10th generation (Generation 10, G10) plants (five MA lines) from each treatment (D10, E10, F10) were used for individual whole-genome sequencing. For MA population experiments, seeds from the same ancestor plant as the MA lines were divided into three groups (~ 35 seedlings per group) and planted under Control conditions (A) for 16 generations, Warming conditions (C) for 19 generations, or Heat conditions (B) for 22 generations [the first 9 generations grown under gradual warming, i.e., increase of 1 °C per generation (from 24/18 °C to 32/27 °C [day/night]); the following 13 generations were grown at constant 32/27 °C]. Five 16th, 22th, and 19th generation plants from each treated population were also randomly selected for sequencing. To maximize coverage and provide progenitor background genetic information (reference genome sequence) for MA experiments, five individuals (G0) were combined for sequencing. Genome-sequenced plants from MA lines and populations are highlighted in yellow- and grey-shaded (blue outline) boxes, respectively; see also Additional file 1: Table S1. b Growth status of MA plants exposed to Control, Heat, and Warming conditions at stage 5 (bolting) and stages 8–9 (silique ripening and senescence). Leaves at stage 5 (major axis ≤ 1 cm) were sampled for DNA extraction and sequencing. Scale bar, 5 cm. c Ripened siliques from the Control, Heat, and Warming treatments. Scale bar, 0.5 cm. d Phenotypic statistics of leaf area and silique length under different temperature treatments. Leaves at stage 5 (bolting) and siliques at stage 9 were measured. The experiments were repeated three times and the data are presented as means ± standard errors of the mean (SEMs; n = 30). Significant differences were revealed using analysis of variance (ANOVA) with post hoc tests (*p < 0.05, **p < 0.01 vs. Control or Warming)
Fig. 2
Fig. 2
Distribution across chromosomes of de novo mutations [single-nucleotide variants (SNVs) and small insertions and deletions (indels)] detected in genomes of Arabidopsis from the Heat, Warming, and Control MA lines and populations. a,b Labels indicate the type of mutation; colors indicate the functional class or predicted consequence. Single-base insertions (ins) and deletions (dels) are indicated by base letters preceded by a plus and minus sign, respectively. Large ins and dels are indicated by a plus (with the number of inserted base pairs) and minus sign (with the number of deleted base pairs), respectively. Individual colors indicate intergenic region (red), intron (yellow), synonymous/non-frameshift (orange), nonsynonymous/frameshift/stop gain (blue), UTR3/5 (purple), upstream/downstream (green), splicing (pink), transposable element (violet), and noncoding/pseudogene (lake blue) mutations. Red labels in each MA population indicate the same mutations detected in at least two sequenced samples. c, d Frequencies and categories of ins and dels were determined based on their indel lengths (see also Additional file 1: Table S3)
Fig. 3
Fig. 3
Estimation of mutation rates of observed mutations (SNVs, indels) and molecular spectra in Control, Warming, and Heat MA lines and populations. a, b SNV, indel, and total mutation rates (per site per generation) of de novo mutations in MA lines and populations subjected to different temperature treatments. Significant differences were revealed using a two-tailed Student’s t test (*p < 0.05, **p < 0.01 compared to the Control or Warming treatments). c, d Mutation rates of different mutation types in MA lines and populations subjected to different temperature treatments. Conditional rates of each mutation type per site per generation were estimated by dividing the number of observed mutations by the number of analyzed sites capable of producing a given mutation and the number of generations of MA in each Control, Warming, and Heat lineage and population lineage. Error bars indicate SEM. e, f Mutation frequencies (per genome per generation) of transition and transversion mutations accumulated in MA lines and populations subjected to different temperature treatments. Significant differences were revealed using a two-tailed Student’s t test (*p < 0.05, **p < 0.01 compared to the Control or Warming treatments). g Transition/transversion ratios (Ts/Tv) of SNVs accumulated in MA lines and populations subjected to different temperature treatments
Fig. 4
Fig. 4
Comparison of mutation frequencies in various genomic regions among the Control, Heat, and Warming lines (a) and populations (b). The numerical values in the stacked bar chart indicate the frequencies of total mutations (SNVs and indels) in the genomic regions. The mutation frequency of each region in each sample was calculated using the formula m = n/g, where n is the number of identified mutations and g is the number of generations. Accordingly, the mean mutation frequency of each treatment (five samples) was estimated by the ∑m/5. Numerical values above the bars indicate SNV rates in the genomic regions. The SNV rates of each genomic region (per site per generation) were estimated by dividing the number of observed mutations by the number of analyzed sites capable of producing a given mutation and the number of generations of MA
Fig. 5
Fig. 5
Functional enrichment of mutated genes in MA lines and populations. a GO enrichment of mutated genes in the Control (A and D), Heat (B and E), and Warming (C and F) treatments. The arrow indicates an important biological process. b Expression levels of mutated genes under Heat and Warming differed significantly from the Control (expression dataset obtained from NCBI GSE118298). Log10-transformed FPKM expression values for each treatment were visualized using a heatmap. Red color indicates a high expression level, and blue color indicates a low expression level. c Nonsynonymous (orange), frameshift deletion (blue), frameshift insertion (yellow), and stop gain (grey) mutations in gene coding regions of MA lines and populations. Each gene involved in a putative biological process is shown. Defense response- and DNA repair-associated genes are marked in blue, and asterisks indicate the differentially expressed genes shown in (b)
Fig. 6
Fig. 6
Estimation of the effects of cytosine methylation and TE region on mutation rates in the Control, Heat, and Warming MA lines. ac Comparison of cytosine methylation percentages at all bases in the genome and mutated bases in the Control D (A), Heat E (B), and Warming F (C) lines. H refers to A, T, or G. The methylation percentage is much higher at mutated bases than the corresponding genome-wide occurrence for all three contexts: CG (Fisher’s exact test, p = 4.58 × 10⁻⁸), CHG (Fisher’s exact test, p = 1.92 × 10⁻²¹), and CHH (Fisher’s exact test, p = 1.63 × 10⁻³). d Effects of cytosine methylation and TE region on mutation rates in the Control D (D), Heat E (E), and Warming F (F) lines. The x axis shows log-transformed (log10) mutation rates per site per generation. Mutation rates for non-TE and TE positions are marked in orange and blue, respectively. Mutation rates for nonmethylated and methylated CG positions are indicated with triangles and squares, respectively. Differences in mutation rates among Control D, Heat E, and Warming F lines were assessed using Student’s t test. Error bars indicate SEMs. Asterisks indicate significant differences from Control D at p < 0.05 (*) and p < 0.01 (**), respectively
Fig. 7
Fig. 7
Mutational biases of Control, Heat, and Warming lines and populations. Analysis of correlations between gene density and mutation rates across chromosomes in Control, Heat, and Warming lines and populations. a Distribution of mutations across A. thaliana chromosomes shown in a Circos plot. From outer circle to inner circle, the plot shows the chromosomes, genes (purple bars), and mutations in A16 (green bars), B22 (yellow bars), C19 (red bars), D10 (pink bars), E10 (purple bars), and F10 (blue bars). Each chromosome is divided into multiple bins (bin size = 100 kb), which are grouped into high and low gene density regions. b Comparison of mutation rates between regions with high gene density and those with low gene density. Significant differences were revealed using two-tailed Student’s t test (p < 0.05, high vs. low gene density regions). ch Neighbor-dependent mutation rates at AT and GC bases estimated for the Control, Heat, and Warming MA lines (ce) and populations (fh). The trinucleotide context-dependent mutation rate is shown for each treatment. The x axis shows the focal nucleotides (uppercase, mutation site) and immediate flanking nucleotides (lowercase), regardless of strand orientation (e.g., the tAt class includes the overall mutation rate at tAt and aTa sites). For each treatment, the mutation rates of G/C bases were generally elevated relative to those of A/T bases. Red dots indicate significantly elevated mutation rates
Fig. 8
Fig. 8
Overlap between mutations identified in MA lines/populations (SNVs) and variants detected in the 1001 Genomes population (SNPs). Comparison of expected and observed proportions of SNVs and indels that overlap the SNPs and indels in the 1001 Genomes dataset. Numbers at the tops of the bars are absolute overlap values. Asterisks indicate p < 0.05 (*), p < 0.01 (**), and p < 0.001 (***) based on Fisher’s exact test with Bonferroni correction

Similar articles

Cited by

References

    1. Lee H, Popodi E, Tang H, Foster PL. Rate and molecular spectrum of spontaneous mutations in the bacterium Escherichia coli as determined by whole-genome sequencing. Proc Natl Acad Sci U S A. 2012;109:2774–2783. doi: 10.1073/pnas.1210309109. - DOI - PMC - PubMed
    1. Zhu YO, Siegal ML, Hall DW, Petrov DA. Precise estimates of mutation rate and spectrum in yeast. Proc Natl Acad Sci U S A. 2014;111:2310–2318. doi: 10.1073/pnas.1323011111. - DOI - PMC - PubMed
    1. Kumar S. Molecular clocks: four decades of evolution. Nat Rev Genet. 2005;6:654–662. doi: 10.1038/nrg1659. - DOI - PubMed
    1. Johnson T, Barton N. Theoretical models of selection and mutation on quantitative traits. Philos Trans R Soc Lond B Biol Sci. 2005;360:1411–1425. doi: 10.1098/rstb.2005.1667. - DOI - PMC - PubMed
    1. Lynch M. Evolution of the mutation rate. Trends Genet. 2010;26:345–352. doi: 10.1016/j.tig.2010.05.003. - DOI - PMC - PubMed

Publication types