. 2021 May 25;13(1):118.
doi: 10.1186/s13148-021-01102-9.

Blood DNA methylation and COVID-19 outcomes

Affiliations

Blood DNA methylation and COVID-19 outcomes

Joseph Balnis et al. Clin Epigenetics. .

Abstract

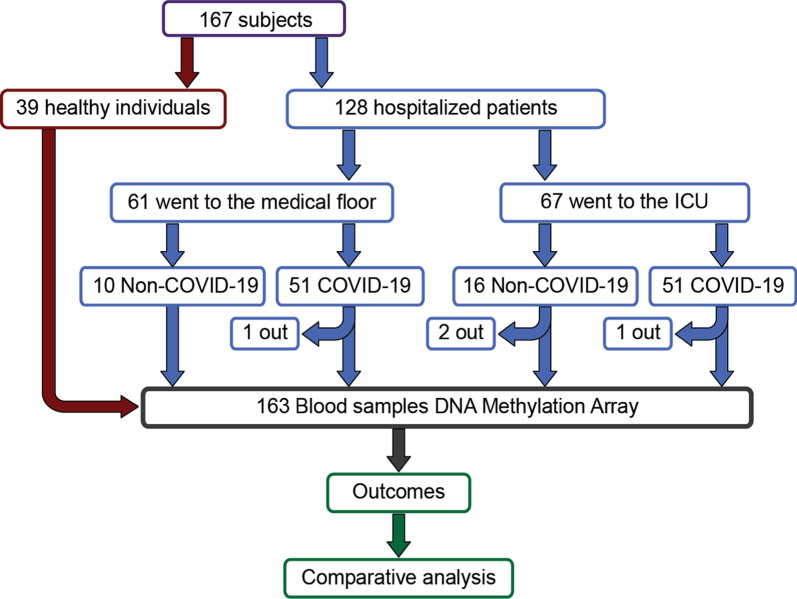
Background: There are no prior reports that compare differentially methylated regions of DNA in blood samples from COVID-19 patients to samples collected before the SARS-CoV-2 pandemic using a shared epigenotyping platform. We performed a genome-wide analysis of circulating blood DNA CpG methylation using the Infinium Human MethylationEPIC BeadChip on 124 blood samples from hospitalized COVID-19-positive and COVID-19-negative patients and compared these data with previously reported data from 39 healthy individuals collected before the pandemic. Prospective outcome measures such as COVID-19-GRAM risk-score and mortality were combined with methylation data.

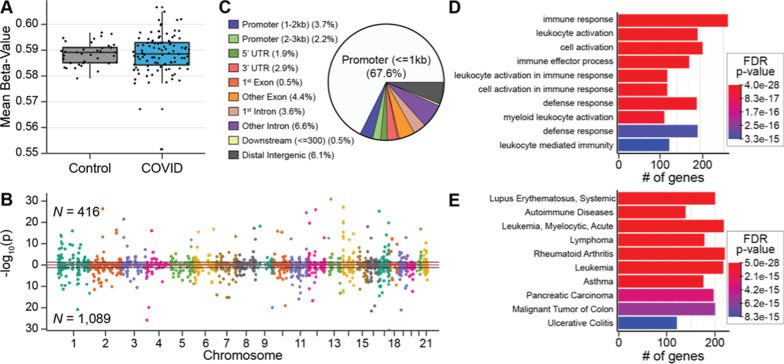
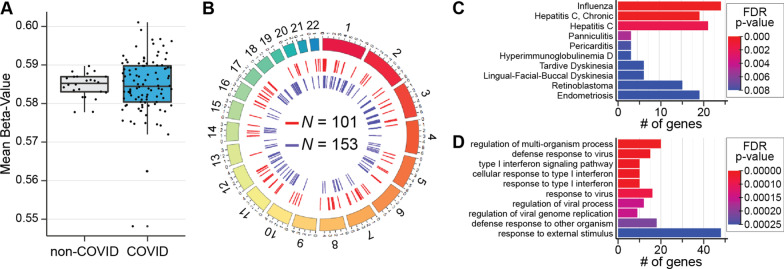
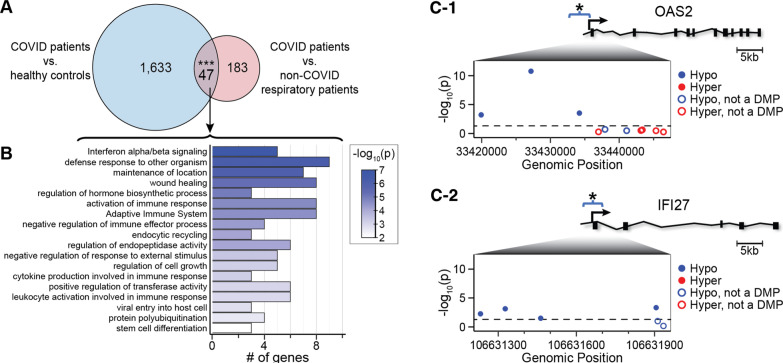
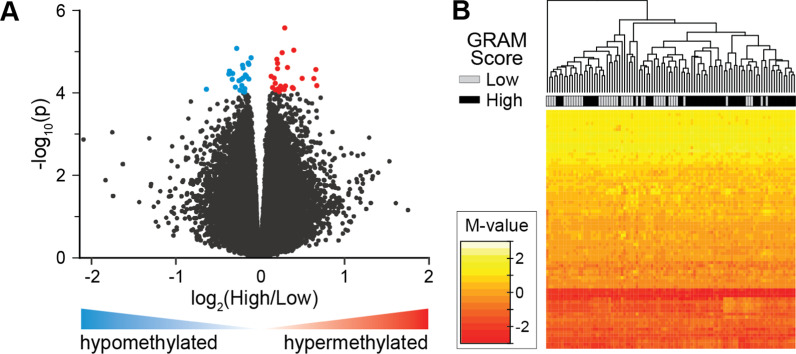
Results: Global mean methylation levels did not differ between COVID-19 patients and healthy pre-pandemic controls. About 75% of acute illness-associated differentially methylated regions were located near gene promoter regions and were hypo-methylated in comparison with healthy pre-pandemic controls. Gene ontology analyses revealed terms associated with the immune response to viral infections and leukocyte activation; and disease ontology analyses revealed a predominance of autoimmune disorders. Among COVID-19-positive patients, worse outcomes were associated with a prevailing hyper-methylated status. Recursive feature elimination identified 77 differentially methylated positions predictive of COVID-19 severity measured by the GRAM-risk score.

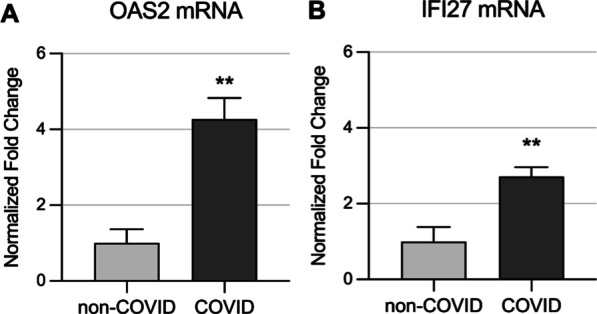
Conclusion: Our data contribute to the awareness that DNA methylation may influence the expression of genes that regulate COVID-19 progression and represent a targetable process in that setting.

Keywords: Acute respiratory distress syndrome (ARDS); COVID-19; DNA methylation; Gene expression; Mortality; Outcomes.


Conflict of interest statement

M.D.R. has financial relationships with CaroGen Corporation, and receives research funding from Gilead Sciences, outside of this work.

Figures

Fig. 1
Fig. 1
Diagram of the entire cohort involved in study: Notice that while the hospitalized patients’ cohort contributed 128 patients, only 124 were part of the analyses due to inadequate quality of 4 samples; see diagram and details in the text
Fig. 2
Fig. 2
Differential SARS-CoV-2 DNA methylation between blood samples from patients on hospital admission for COVID-19 compared to blood samples from healthy controls before the COVID-19 pandemic. A A box and whisker plot depicts the difference in mean global methylation level (y-axis) between COVID-19 patients and healthy controls (x-axis). Each black dot represents the mean methylation level of each participant. These results indicate that global mean methylation levels do not distinguish COVID-19 patients from healthy pre-pandemic controls. B A Manhattan plot of DNA methylation regions shows the distribution of SARS-CoV-2-associated significantly differentially methylated regions (DMRs) across the genome by chromosome number. Hyper-methylated regions are displayed with a positive log10 (p value), and hypo-methylated regions are displayed with a negative log10 (p value). DMRs were ascertained as regions having at least 5 consecutive CpGs where > 75% of the CpGs in the region had an FDR p value < 0.05, and all were either hyper-methylated or hypo-methylated. This approach identified 1505 DMRs, that are displayed above and below the blue lines. Dots alternate colors to depict a change in chromosome. Sex chromosomes were excluded from analysis. These results indicate that 1505 DNA regions are differentially methylated within days of SARS-CoV-2 infection. C A pie chart showing the percent distribution of DMRs to standard genomic features. 5′UTR = 5′ untranslated region 3′UTR = 3′ untranslated region. In keeping with the known role of DNA methylation in regulation of gene expression, a preponderance of DMRs are in gene promoter regions. D Bar graphs of the top ten gene ontological (GO) biological processes related to the COVID-19 differentially methylated genes, ordered by statistical significance. The X-axis indicates the number of COVID-19 DMR-associated genes that contribute to each GO term. Bar color indicates the FDR P-value using a Fischer test. These results indicate that the observed DMRs occur in genes that participate in leukocyte activation and immune responses. E Bar Graph of the top 10 disease ontological (DO) processes related to the COVID-19-associated differentially methylated genes, ordered by statistical significance. The X-axis indicates the number of COVID-19 DMR-associated genes contributing to each GO term. Bar color indicates the FDR P-value using a Fischer test. These results indicate that the observed DMRs occur in genes that participate in the pathogenesis of inflammatory and leukocyte disorders
Fig. 3
Fig. 3
DMRs in blood samples from COVID-19 patients on hospital admission are distinct from patients with non-COVID-19 respiratory illness in genes that participate in virus-related pathways and disorders. A Box and whisker plot depicts the difference in mean global methylation level (y-axis) between COVID-19 and non-COVID-19 respiratory ill patients (1 and 0, respectively; x-axis). Each black dot represents the mean methylation level of each participant. These results indicate that global mean methylation levels do not distinguish COVID-19 from non-COVID-19 respiratory ill patients. B Circos plot depicts genomic distribution of differentially methylated regions (DMRs) across the human genome. (Outer ring) Each chromosome is shown as a different color. The relative chromosome size is represented by the arc bar length. (Inner rings) Hyper-methylated DMRs are shown in red and hypo-methylated regions are shown in blue. Sex chromosomes were omitted from the analysis. These results indicate that 254 DNA differentially methylated regions distinguish SARS-Cov-2 infection from non-COVID-19 respiratory illness. C Bar Graph of the top ten disease ontological (DO) biological processes related to the SARS-CoV-2-associted differentially methylated genes, ordered by statistical significance. The X-axis indicates the number of SARS-CoV-2 DMR-associated genes that contribute to each DO term. Bar color indicates the FDR p value using a Fischer test. These results indicate that the observed DMRs occur in genes that participate in inflammatory and host-defense processes. D Bar Graph of the top ten gene ontological (GO) processes related to the SARS-CoV-2-associated differentially methylated genes, ordered by statistical significance. The X-axis indicates the number of SARS-CoV-2 DMR-associated genes that contribute to each GO term. BAR color indicates the FDR P-value by using a Fischer test. These results indicate that the observed DMRs occur in genes that participate in the pathology of influenza, other viral infections and inflammatory disorders
Fig. 4
Fig. 4
Overlap of COVID-19 DMR-associated genes in blood. A Venn diagram of the overlap of COVID-19 DMR-associated genes identified by comparison of DMRs between COVID-19 patients and healthy pre-pandemic controls, and DMRs between COVID-19 and non-COVID-19 respiratory illness patients on admission. Asterisks indicate overlap that is significant at p value < 0.001. Twenty-five of the 47 overlapping genes with DMRs encode proteins that participate in leukocyte viral defense, inflammation and immune responses. B Ontology analysis of the 47 overlapping genes with DMRs indicate a role in viral defense mechanisms. C Relative positions of COVID-19-associated DMRs in the promoter region of OAS2 (C-1) and IFI27 (C-2) with a schematic depicted for each gene. The relative positions of probes measuring methylation levels of CpG sites annotated to each gene with their genomic 5′-3′ positions are provided (inset panel; x-axis) versus the -log10 of the p value (y-axis). The p value < 0.05 is displayed as a black dashed line. Probes residing in a COVID-19-associated DMR are shown as hypo-methylation (blue dots) and hyper-methylation (red dots). Probes not meeting a p value < 0.05 at the individual CpG level are shown as hollow dots. These results indicate that the DMRs comprise a cluster of differentially methylated positions within days of SARS-CoV-2 infection
Fig. 5
Fig. 5
Transcriptional expression of prototypical interferon stimulated genes (ISGs) -IFI27 and OAS2- correlates with methylation status of their gene promoter regions. RNA from circulating leukocytes obtained from the same COVID-19 positive and negative patients presented in Fig. 4 was used to interrogate expression level of two ISGs. A OAS2 and B IFI27 expression levels are significantly higher in hospitalized patients with COVID-19, which correlates with their gene promoter regions predominant hypomethylation. GAPDH was used as a reference gene; see methods for details. **; p value < 0.01
Fig. 6
Fig. 6
DNA methylation is associated with COVID-19 outcomes. A Volcano plot shows genes associated with dichotomized GRAM-risk scores, either hyper-methylated (red) or hypo-methylated (blue). B DNA methylation levels at 77 differentially methylated positions (DMPs) correlate with disease severity in COVID-19 patients. DMRs (N = 19) associated with the GRAM-score were identified in COVID-19 patients (N = 100). DMRs were ascertained as regions with at least 3 consecutive CpGs where > 75% of the CpGs in the region had a FDR p value < 0.05 and all were either hyper-methylated or hypo-methylated. DNA methylation levels of the DMPs (N = 145) residing in the DMRs were subjected to recursive feature elimination to identify CpGs that best distinguish GRAM-score risk. Shown is a hierarchical cluster using the DNA methylation data from the 77 DMPS (see Additional file 1: Table S8), that are shown as a heatmap of the M-values. Low GRAM-score risk (gray) and high GRAM-score risk (black) are indicated. These results indicate that DNA methylation levels at these 77 DMPs may be useful as biomarkers of the severity of COVID-19 patients. (see Additional file 1: Table S6-1 and S6-2)

References

    1. Zhou F, et al. Clinical course and risk factors for mortality of adult inpatients with COVID-19 in Wuhan, China: a retrospective cohort study. Lancet. 2020;395:1054–1062. doi: 10.1016/S0140-6736(20)30566-3. - DOI - PMC - PubMed
    1. Wu C, et al. Risk factors associated with acute respiratory distress syndrome and death in patients with coronavirus disease 2019 pneumonia in Wuhan, China. JAMA Intern Med. 2020 doi: 10.1001/jamainternmed.2020.0994. - DOI - PMC - PubMed
    1. Wang Y, et al. Clinical course and outcomes of 344 intensive care patients with COVID-19. Am J Respir Crit Care Med. 2020;201:1430–1434. doi: 10.1164/rccm.202003-0736LE. - DOI - PMC - PubMed
    1. Lucas C, et al. Longitudinal analyses reveal immunological misfiring in severe COVID-19. Nature. 2020 doi: 10.1038/s41586-020-2588-y. - DOI - PMC - PubMed
    1. Zhang X, et al. Viral and host factors related to the clinical outcome of COVID-19. Nature. 2020;583:437–440. doi: 10.1038/s41586-020-2355-0. - DOI - PubMed

Publication types