

Clinical and epigenetic features of colorectal cancer patients with somatic POLE proofreading mutations
- PMID: 34034807
- PMCID: PMC8146650
- DOI: 10.1186/s13148-021-01104-7
Clinical and epigenetic features of colorectal cancer patients with somatic POLE proofreading mutations
Abstract
Background: Mutations in the POLE gene result in an ultra-hypermutated phenotype in colorectal cancer (CRC); however, the molecular characterisation of epigenetic alterations remains unclear. We examined the genetic and epigenetic profiles of POLE-mutant CRC to elucidate the clinicopathological features of the associated genetic and epigenetic alterations.
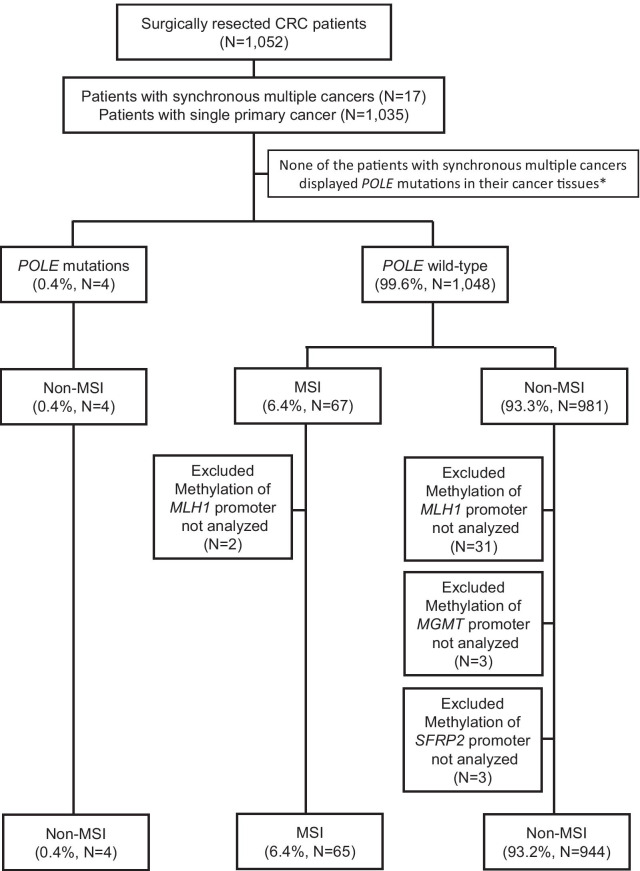
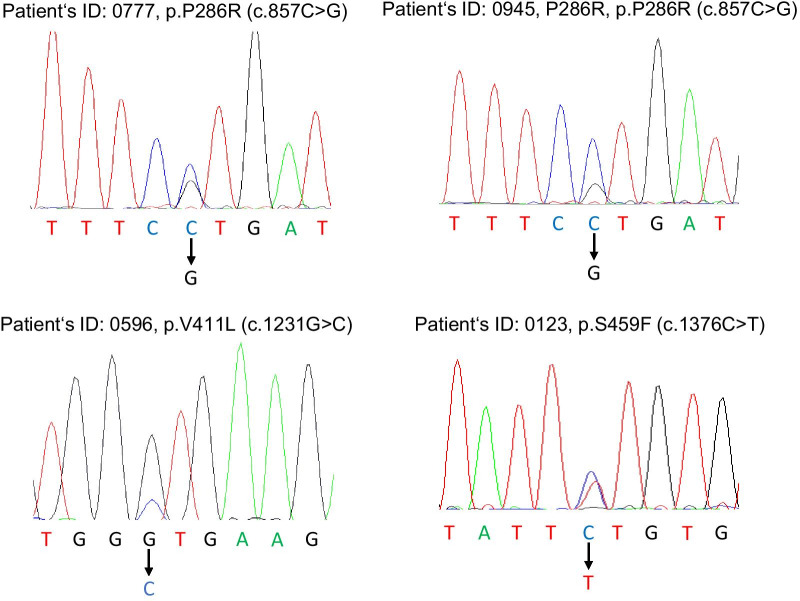
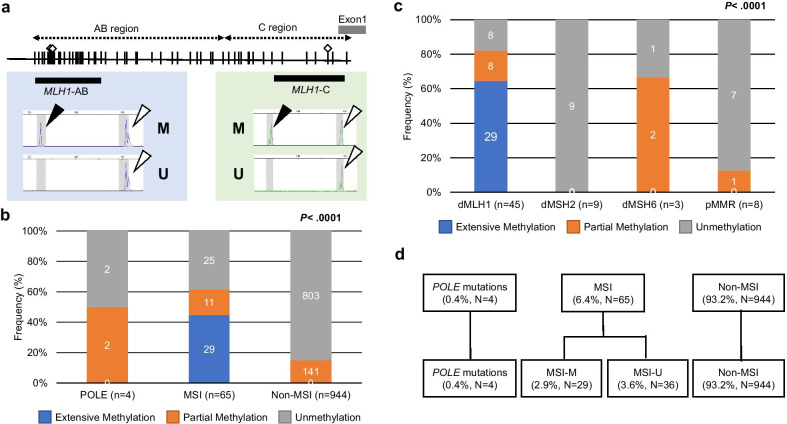
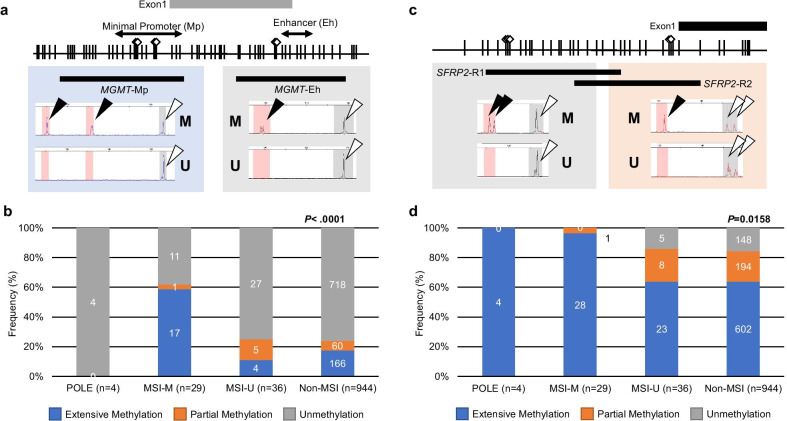
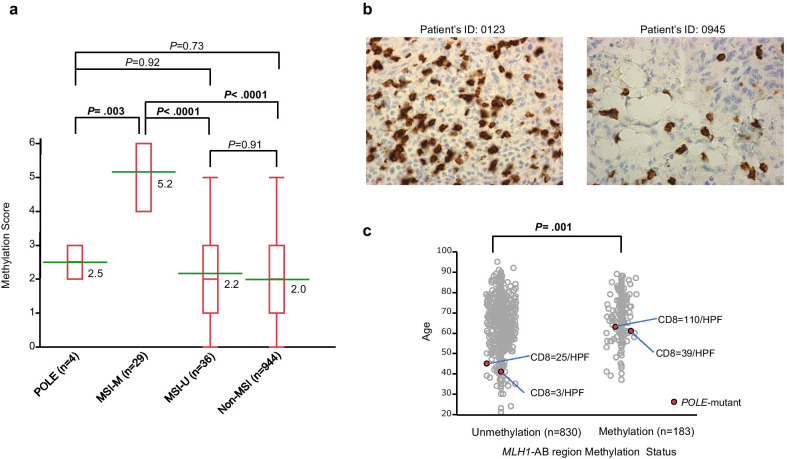
Results: Tumour tissues (1,013) obtained from a cohort of patients with CRC were analysed to determine associations between the proofreading domain mutations of POLE with various clinicopathological variables, microsatellite instability (MSI) status, BRAF and KRAS mutations, and the methylation status of key regions of MLH1, MGMT, and SFRP2 promoters by calculating the methylation scores (range 0-6). Only four cases (0.4%) exhibited pathogenic POLE hotspot mutations (two p.P286R [c.857C > G], one p.V411L [c.1231G > C], and p.S459F [c.1376C > T] each), which were mutually exclusive to BRAF and KRAS mutations and MSI. CRC patients were divided into four subgroups: patients with POLE mutations (POLE, 0.4%, n = 4), patients with both MSI and extensive methylation in MLH1 (MSI-M, 2.9%, n = 29), patients with MSI but no extensive methylation in MLH1 (MSI-U, 3.6%, n = 36), and patients without MSI (non-MSI, 93.2%, n = 944). The POLE group was younger at diagnosis (median 52 years, P < 0.0001), with frequent right-sided tumour localisation (frequency of tumours located in the right colon was 100%, 93.1%, 36.1%, and 29.9% in POLE, MSI-M, MSI-U, and non-MSI, respectively; P < 0.0001), and was diagnosed at an earlier stage (frequency of stages I-II was 100%, 72.4%, 77.8%, and 46.6% in POLE, MSI-M, MSI-U, and non-MSI, respectively, P < 0.0001). The mean methylation score in POLE was not different from that in MSI-U and non-MSI, but the methylation signature was distinct from that of the other subgroups. Additionally, although the examined number of POLE-mutant tumours was small, the number of CD8-positive cells increased in tumours with partial methylation in the MLH1 gene.
Conclusions: CRC patients with POLE proofreading mutations are rare. Such mutations are observed in younger individuals, and tumours are primarily located in the right colon. Diagnosis occurs at an earlier stage, and distinct epigenetic alterations may be associated with CD8 cell infiltration.
Keywords: Colorectal cancer; MLH1; Methylation; Microsatellite instability; POLE.
Conflict of interest statement
The authors declare that they have no competing interests.
Figures
Similar articles
-
POLE somatic mutations in advanced colorectal cancer.Cancer Med. 2017 Dec;6(12):2966-2971. doi: 10.1002/cam4.1245. Epub 2017 Oct 26. Cancer Med. 2017. PMID: 29072370 Free PMC article.
-
Somatic POLE proofreading domain mutation, immune response, and prognosis in colorectal cancer: a retrospective, pooled biomarker study.Lancet Gastroenterol Hepatol. 2016 Nov;1(3):207-216. doi: 10.1016/S2468-1253(16)30014-0. Epub 2016 Jul 20. Lancet Gastroenterol Hepatol. 2016. PMID: 28404093
-
BRAF, KRAS and PIK3CA mutations in colorectal serrated polyps and cancer: primary or secondary genetic events in colorectal carcinogenesis?BMC Cancer. 2008 Sep 9;8:255. doi: 10.1186/1471-2407-8-255. BMC Cancer. 2008. PMID: 18782444 Free PMC article.
-
Ultra-mutated colorectal cancer patients with POLE driver mutations exhibit distinct clinical patterns.Cancer Med. 2021 Jan;10(1):135-142. doi: 10.1002/cam4.3579. Epub 2020 Oct 30. Cancer Med. 2021. PMID: 33125191 Free PMC article.
-
Polymerase proofreading domain mutations: New opportunities for immunotherapy in hypermutated colorectal cancer beyond MMR deficiency.Crit Rev Oncol Hematol. 2017 May;113:242-248. doi: 10.1016/j.critrevonc.2017.03.027. Epub 2017 Mar 23. Crit Rev Oncol Hematol. 2017. PMID: 28427513 Review.
Cited by
-
Distinct clinical pattern of colorectal cancer patients with POLE mutations: A retrospective study on real-world data.Front Genet. 2022 Nov 21;13:963964. doi: 10.3389/fgene.2022.963964. eCollection 2022. Front Genet. 2022. PMID: 36479248 Free PMC article.
-
Reprogrammed Lipid Metabolism and the Lipid-Associated Hallmarks of Colorectal Cancer.Cancers (Basel). 2022 Jul 29;14(15):3714. doi: 10.3390/cancers14153714. Cancers (Basel). 2022. PMID: 35954376 Free PMC article. Review.
-
Deep learning for dual detection of microsatellite instability and POLE mutations in colorectal cancer histopathology.NPJ Precis Oncol. 2024 May 23;8(1):115. doi: 10.1038/s41698-024-00592-z. NPJ Precis Oncol. 2024. PMID: 38783059 Free PMC article.
-
Clinicopathologic Analysis of Five Patients with POLE-Mutated Colorectal Cancer in a Single Korean Institute.Diagnostics (Basel). 2025 Apr 11;15(8):972. doi: 10.3390/diagnostics15080972. Diagnostics (Basel). 2025. PMID: 40310397 Free PMC article.
-
Whole-Exome Sequencing Analysis of Inflammatory Bowel Disease-Associated Serrated Dysplasia.Int J Mol Sci. 2025 Jun 13;26(12):5704. doi: 10.3390/ijms26125704. Int J Mol Sci. 2025. PMID: 40565166 Free PMC article.
References
-
- Goel A, Nagasaka T, Arnold CN, Inoue T, Hamilton C, Niedzwiecki D, Compton C, Mayer RJ, Goldberg R, Bertagnolli MM, et al. The CpG island methylator phenotype and chromosomal instability are inversely correlated in sporadic colorectal cancer. Gastroenterology. 2007;132(1):127–138. doi: 10.1053/j.gastro.2006.09.018. - DOI - PubMed
-
- Tao Y, Kang B, Petkovich DA, Bhandari YR, In J, Stein-O'Brien G, Kong X, Xie W, Zachos N, Maegawa S, et al. Aging-like spontaneous epigenetic silencing facilitates wnt activation, stemness, and braf(V600E)-induced tumorigenesis. Cancer Cell. 2019;35(2):315–328. doi: 10.1016/j.ccell.2019.01.005. - DOI - PMC - PubMed
Publication types
MeSH terms
Substances
Grants and funding
LinkOut - more resources
Full Text Sources
Other Literature Sources
Medical
Research Materials
Miscellaneous
