

Monogenic Diabetes and Integrated Stress Response Genes Display Altered Gene Expression in Type 1 Diabetes
- PMID: 34035041
- PMCID: PMC8385619
- DOI: 10.2337/db21-0070
Monogenic Diabetes and Integrated Stress Response Genes Display Altered Gene Expression in Type 1 Diabetes
Abstract
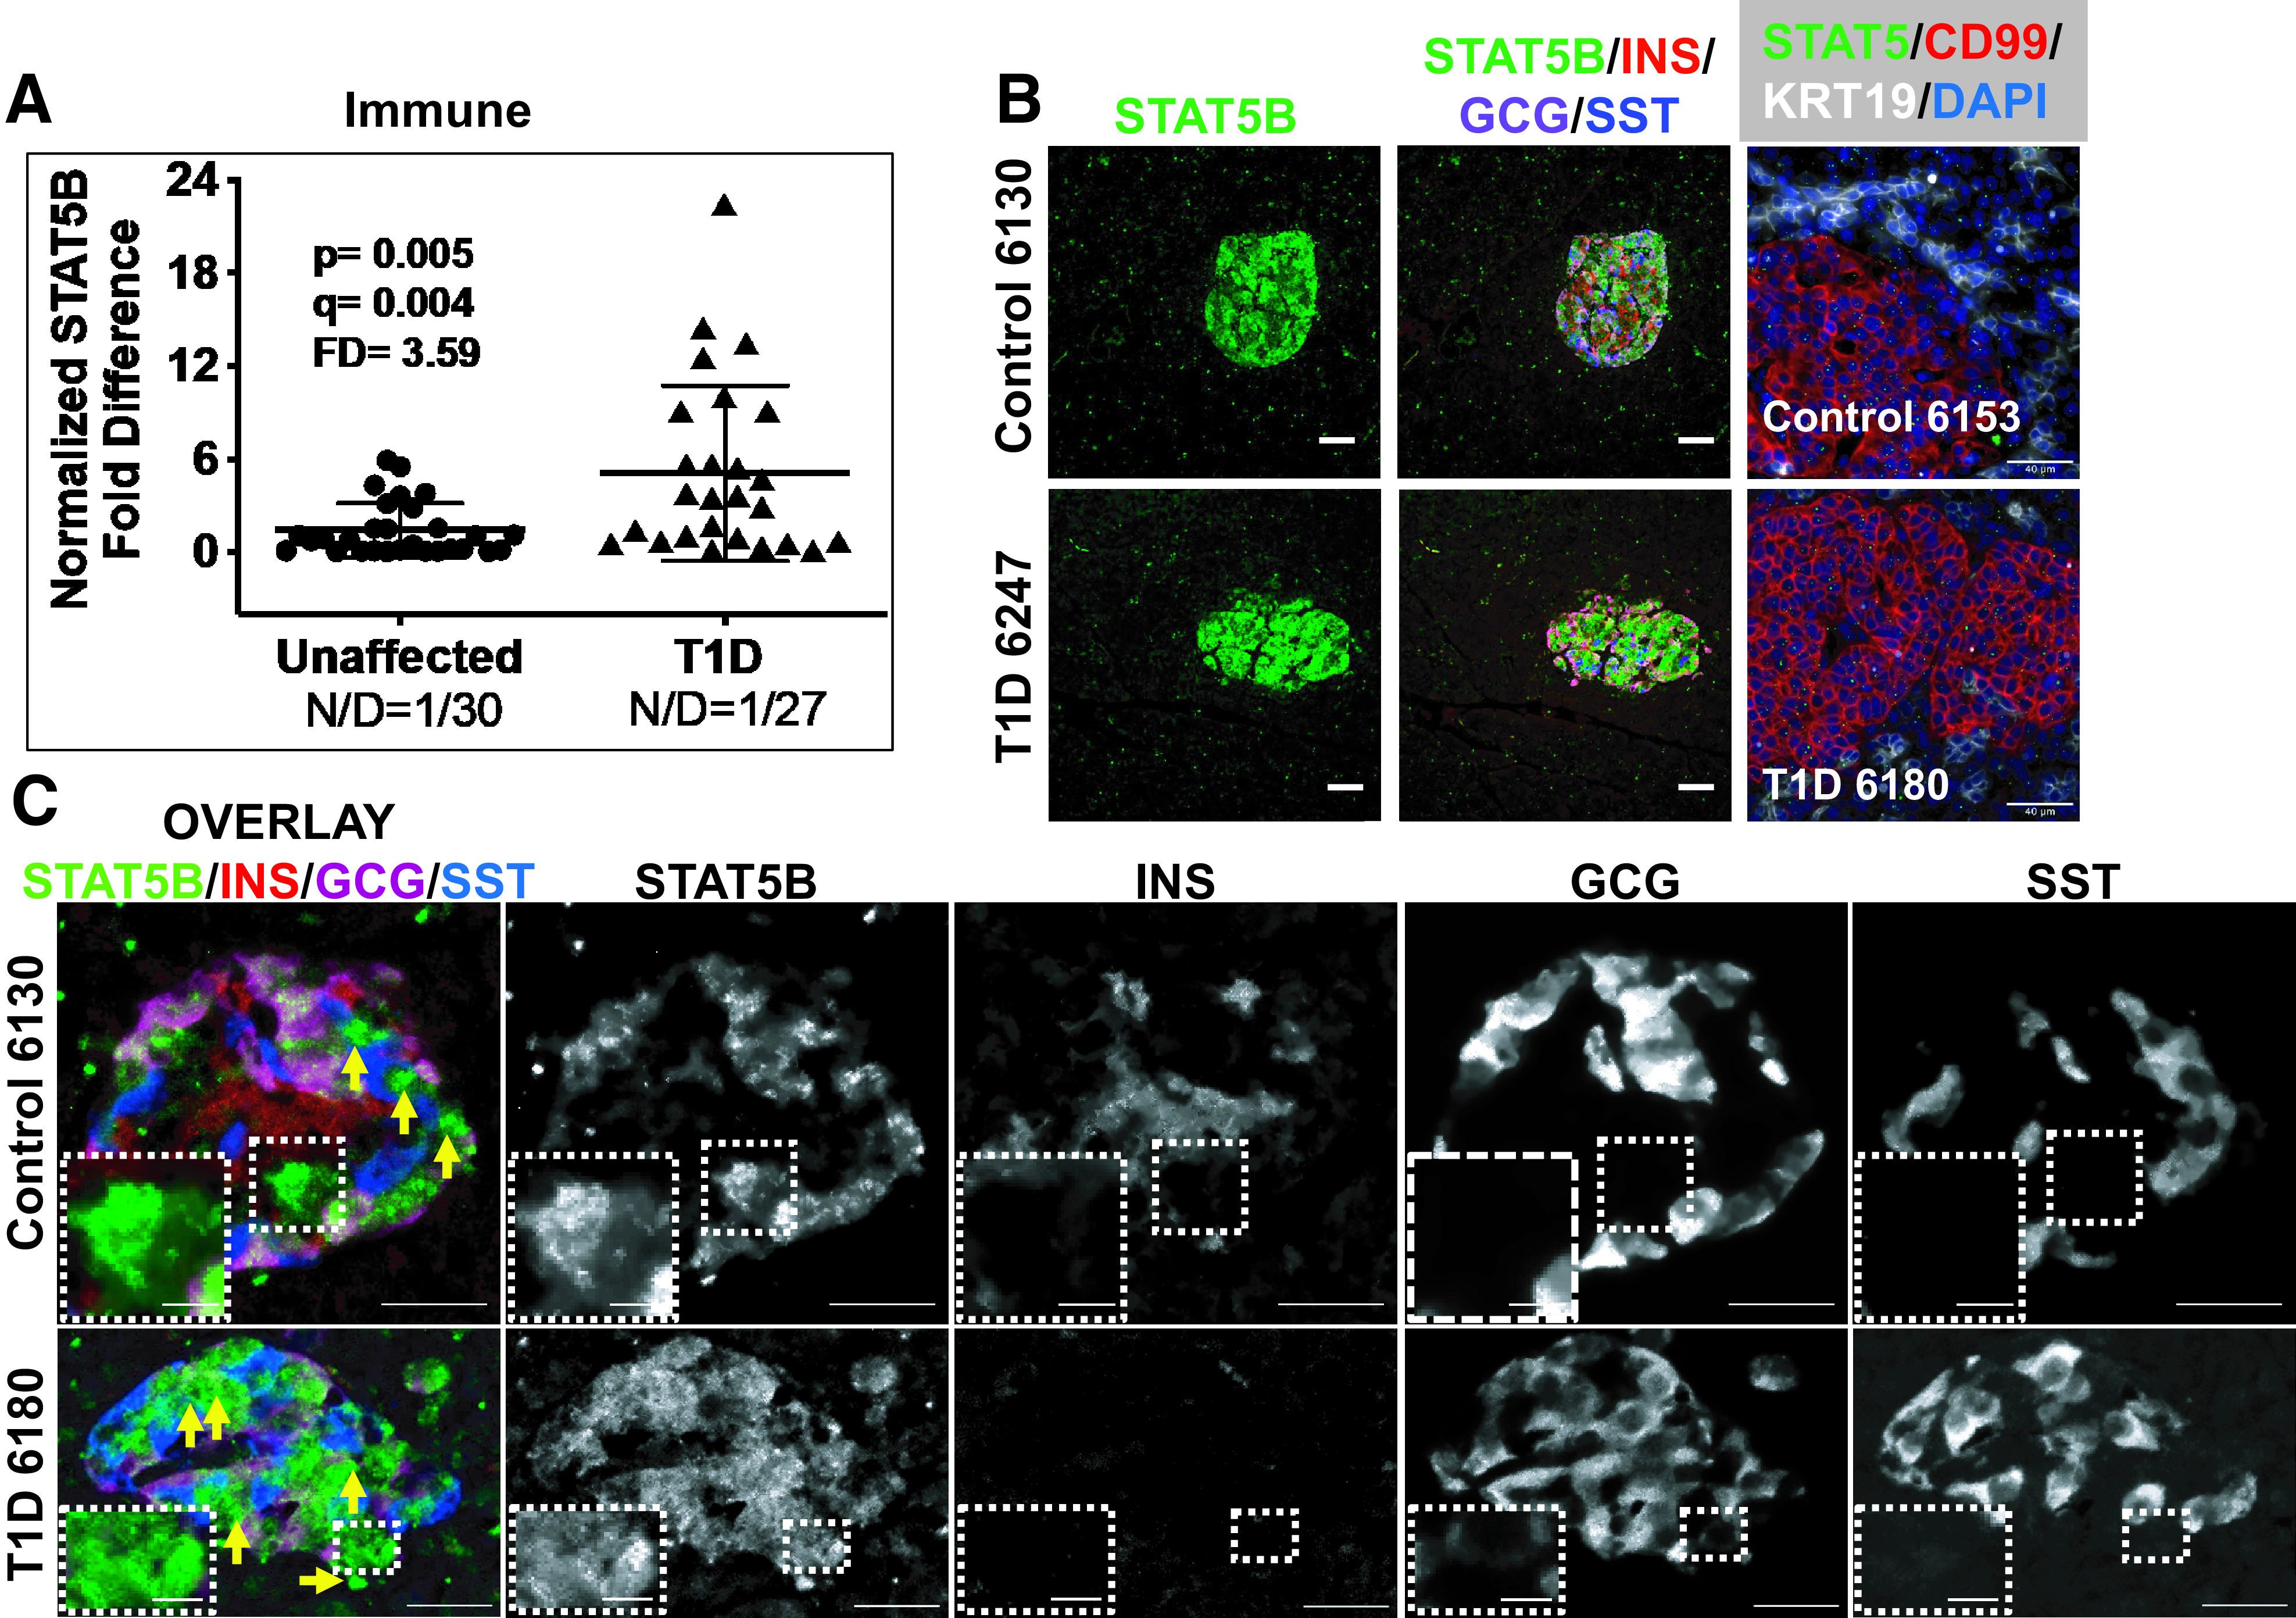
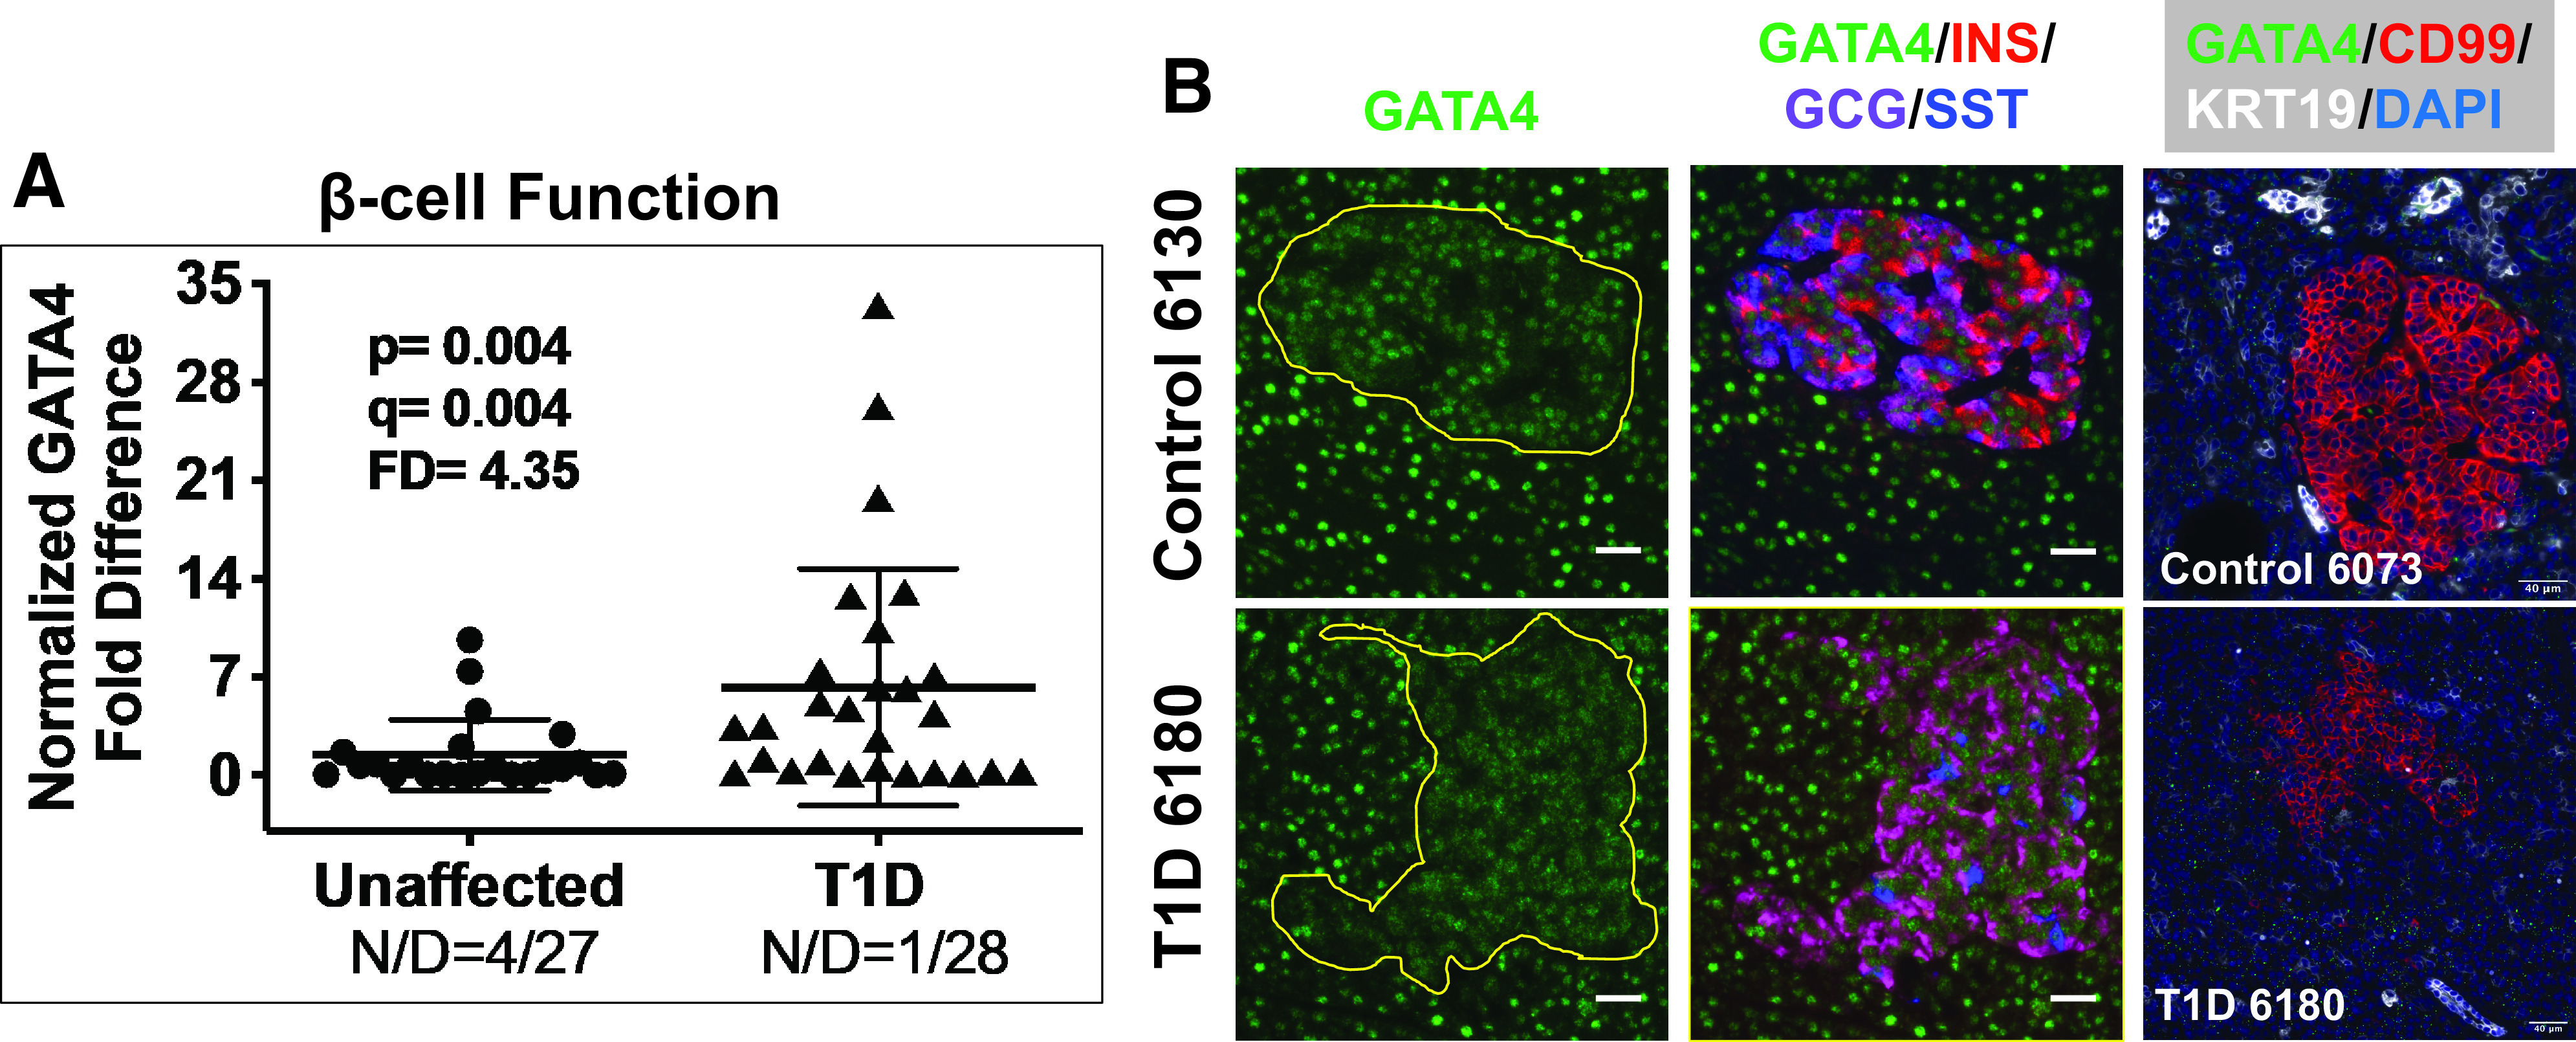
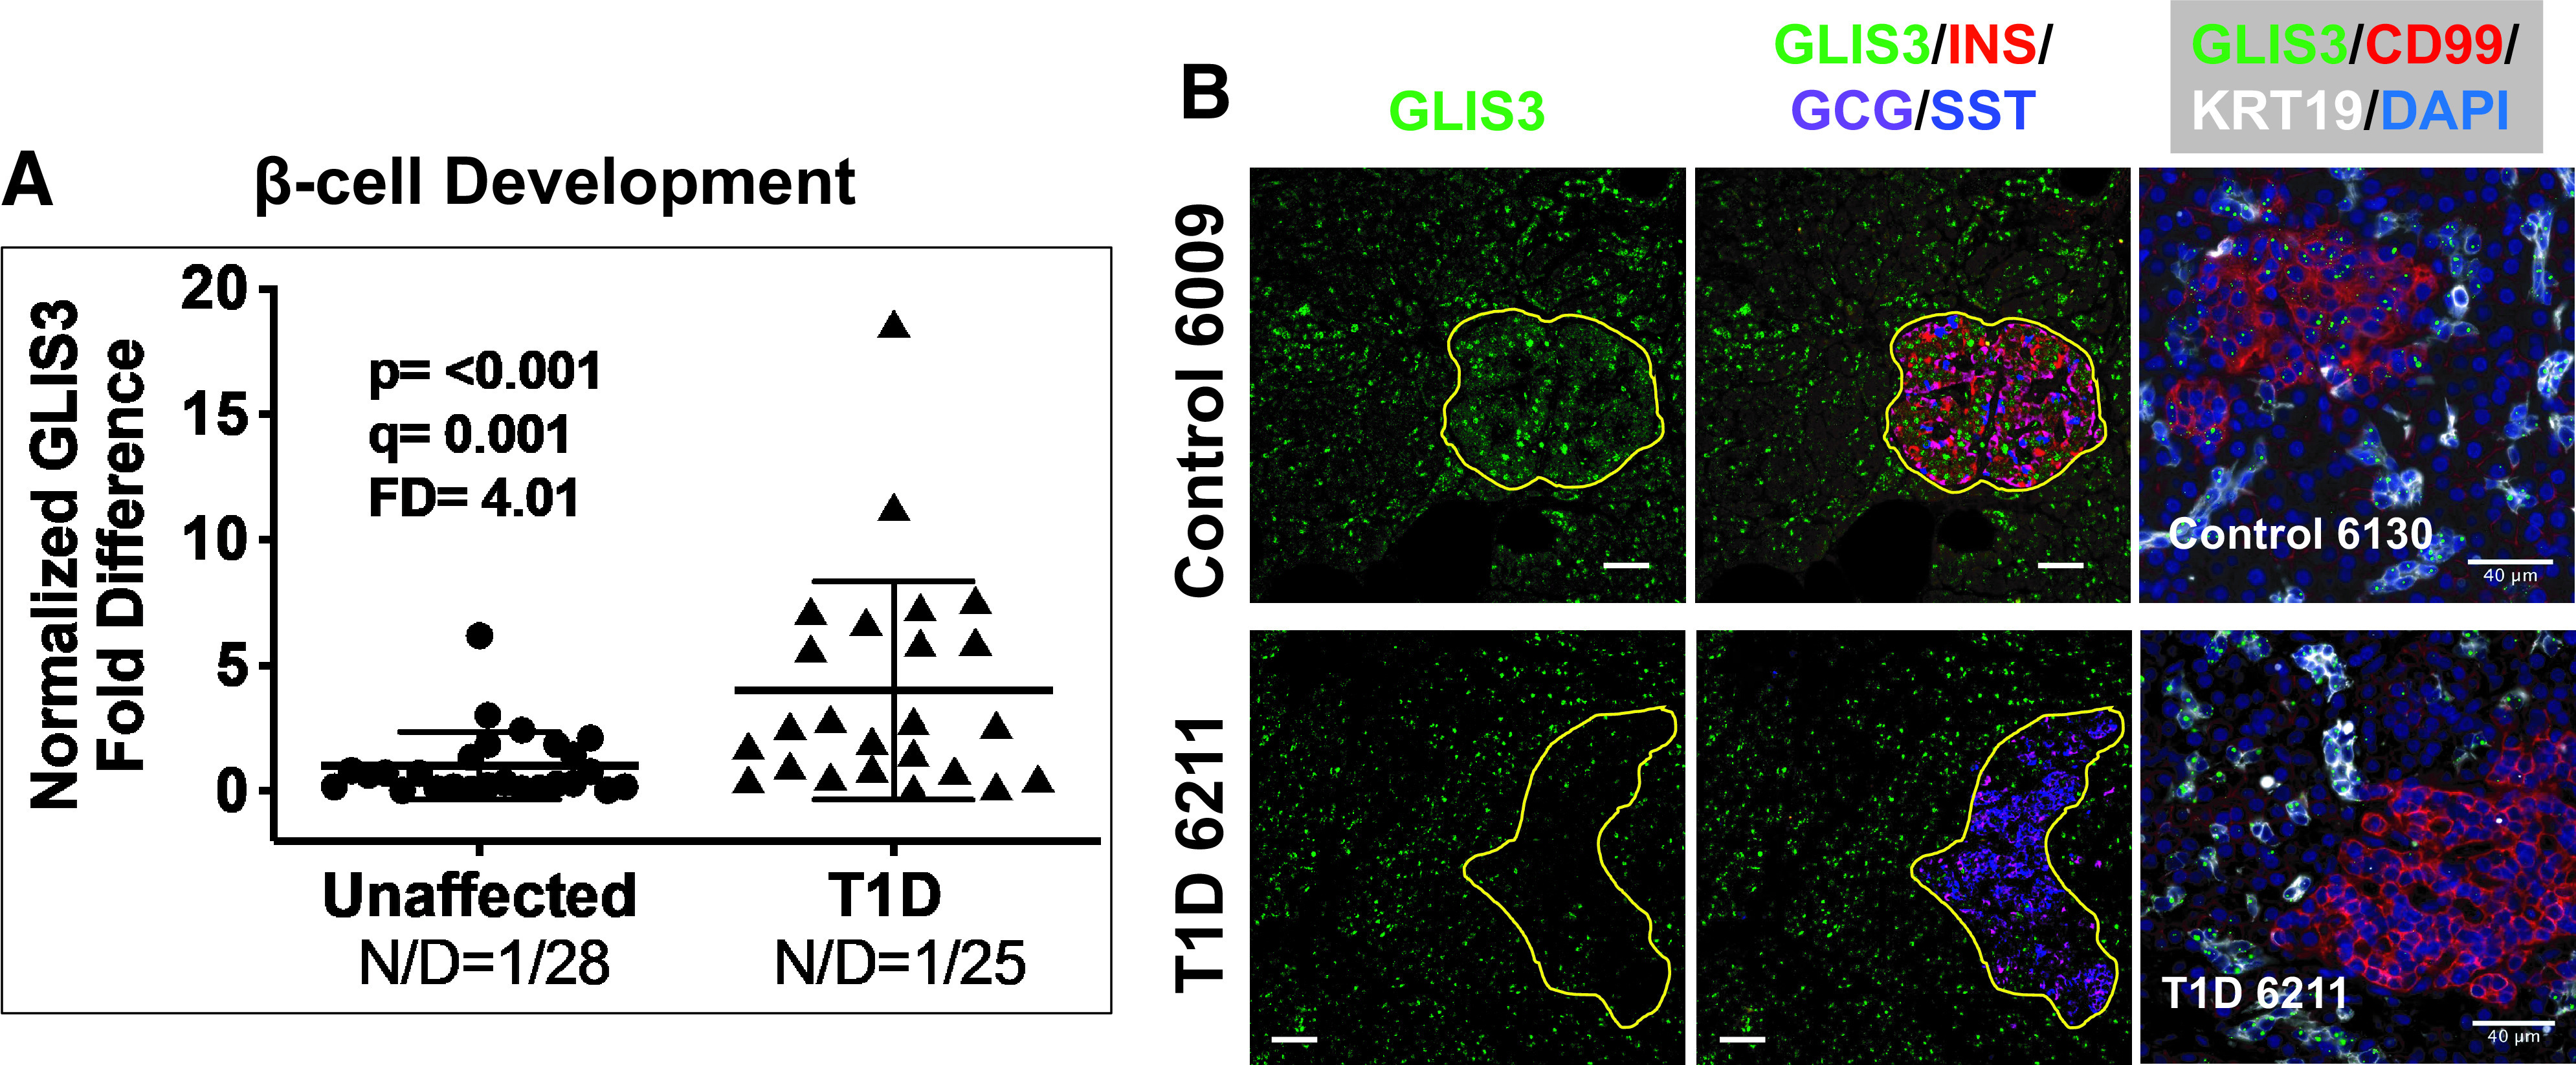
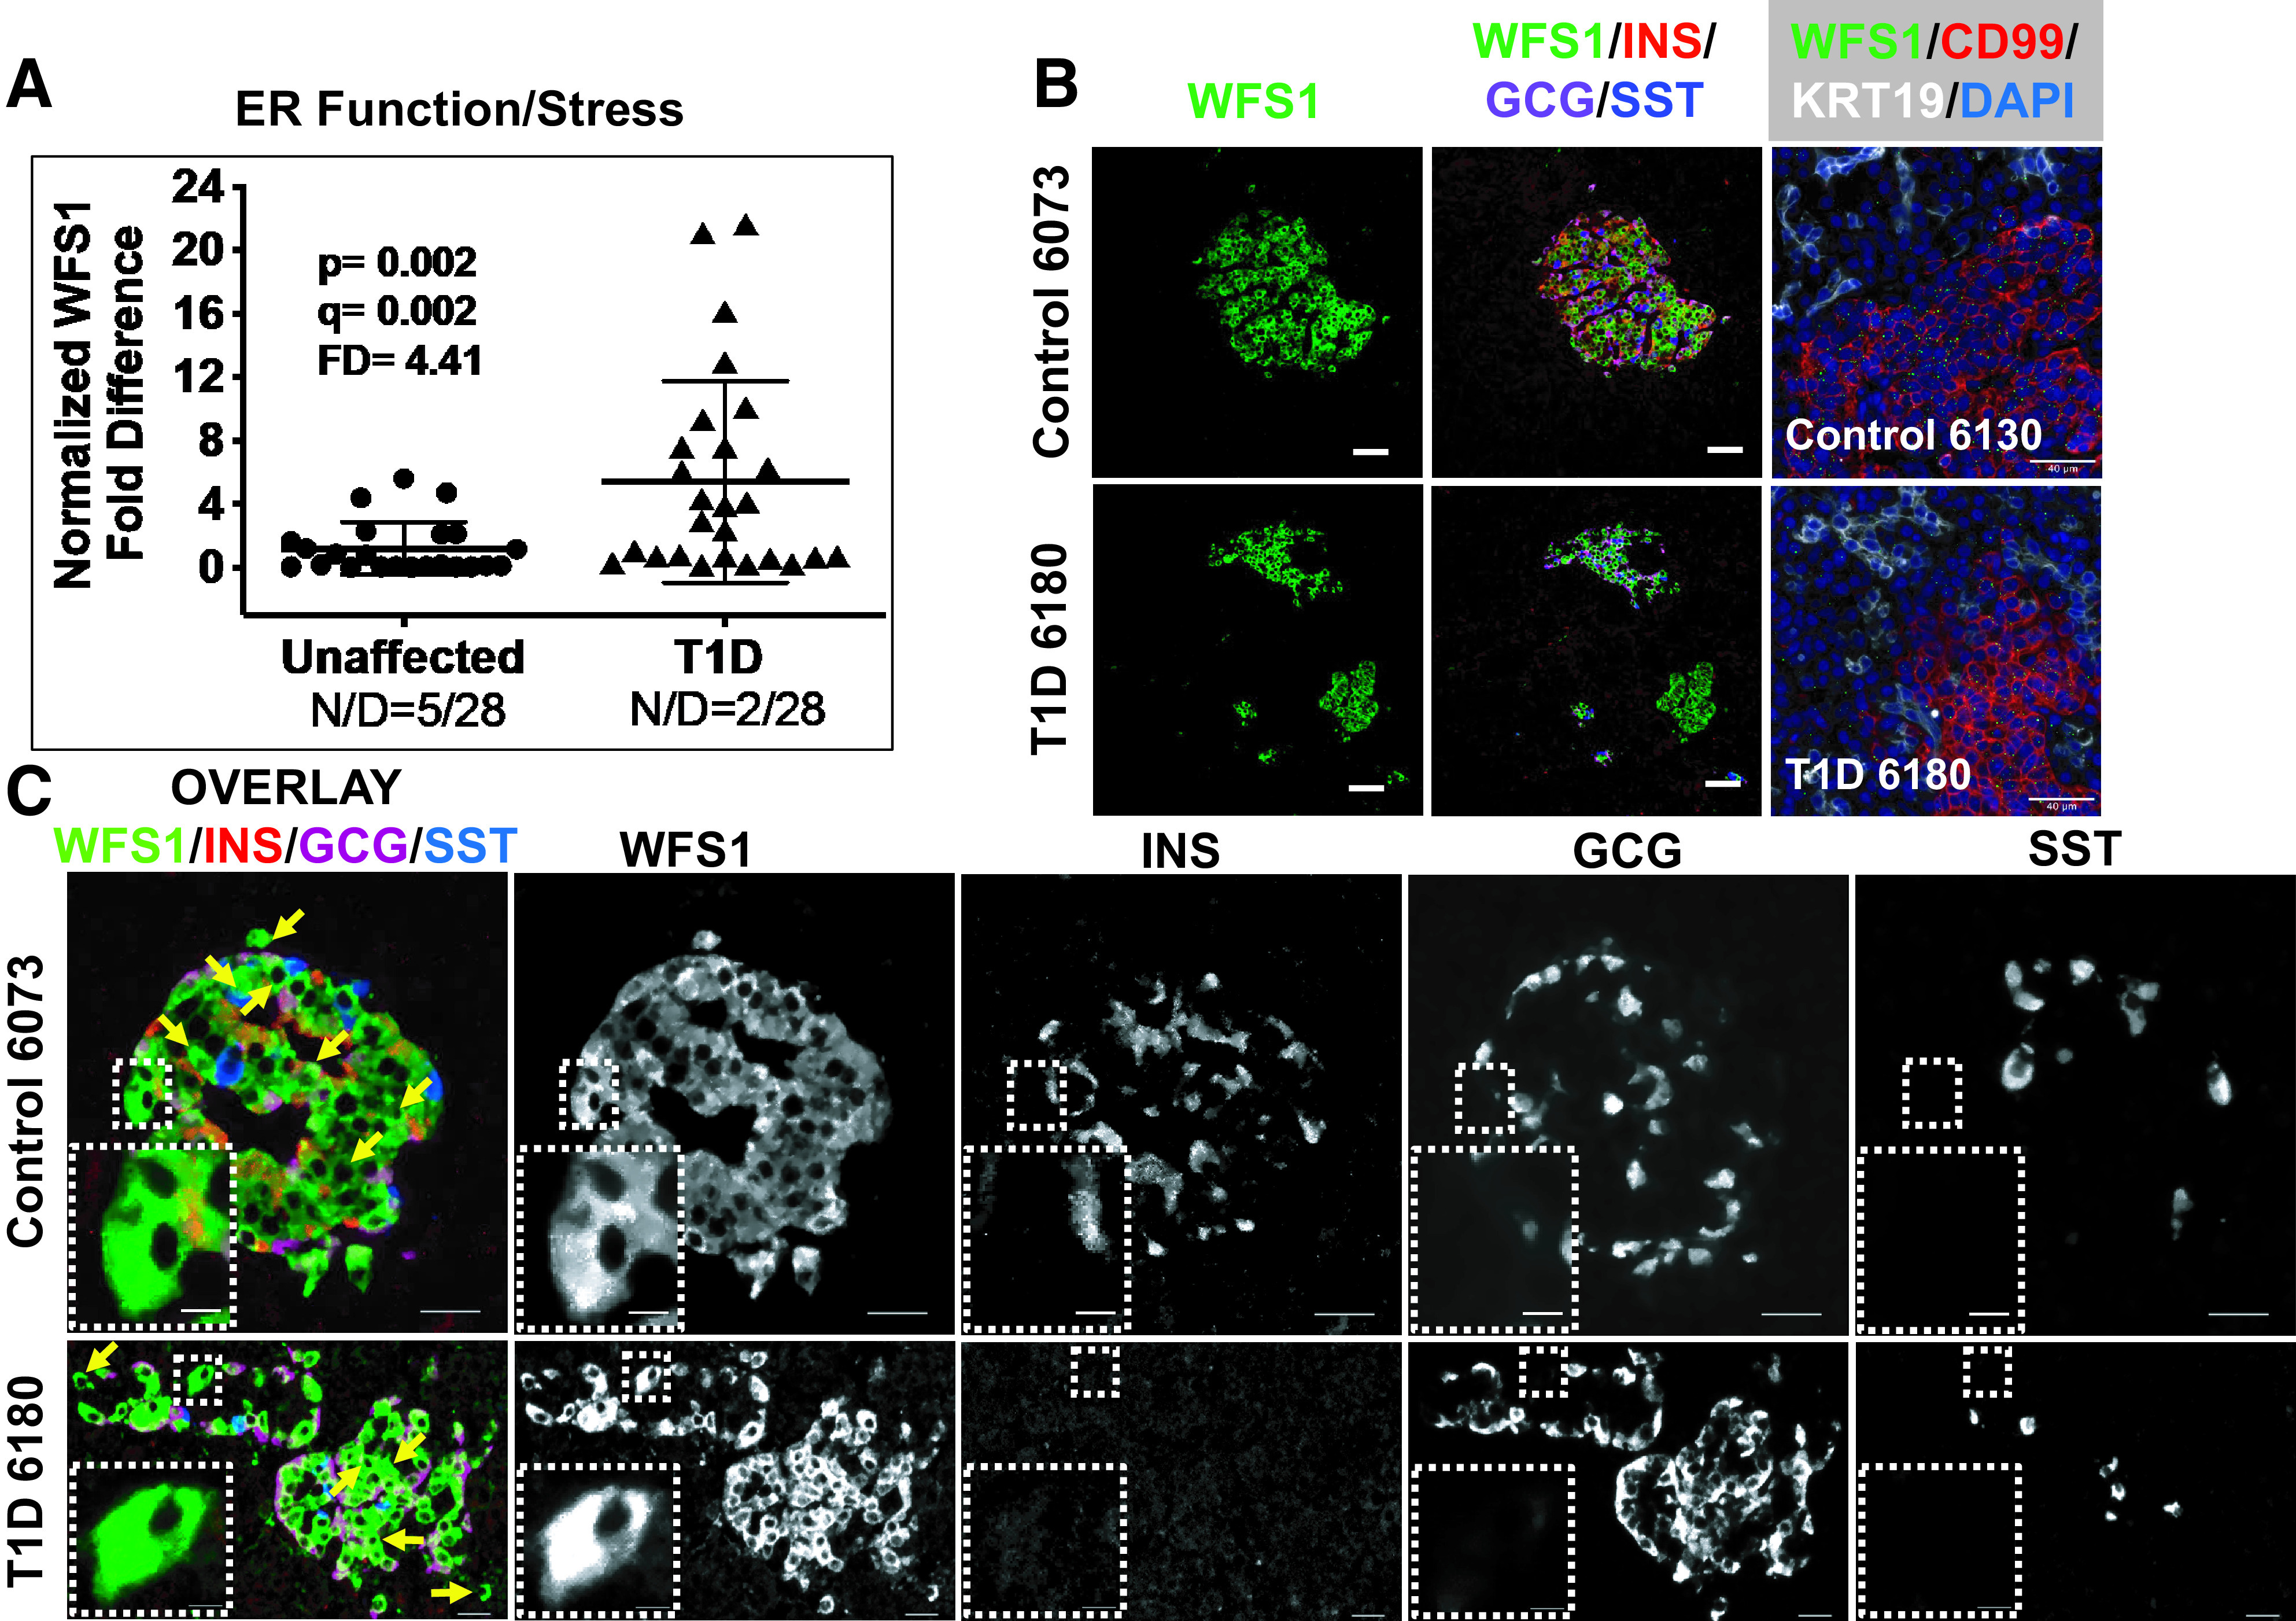
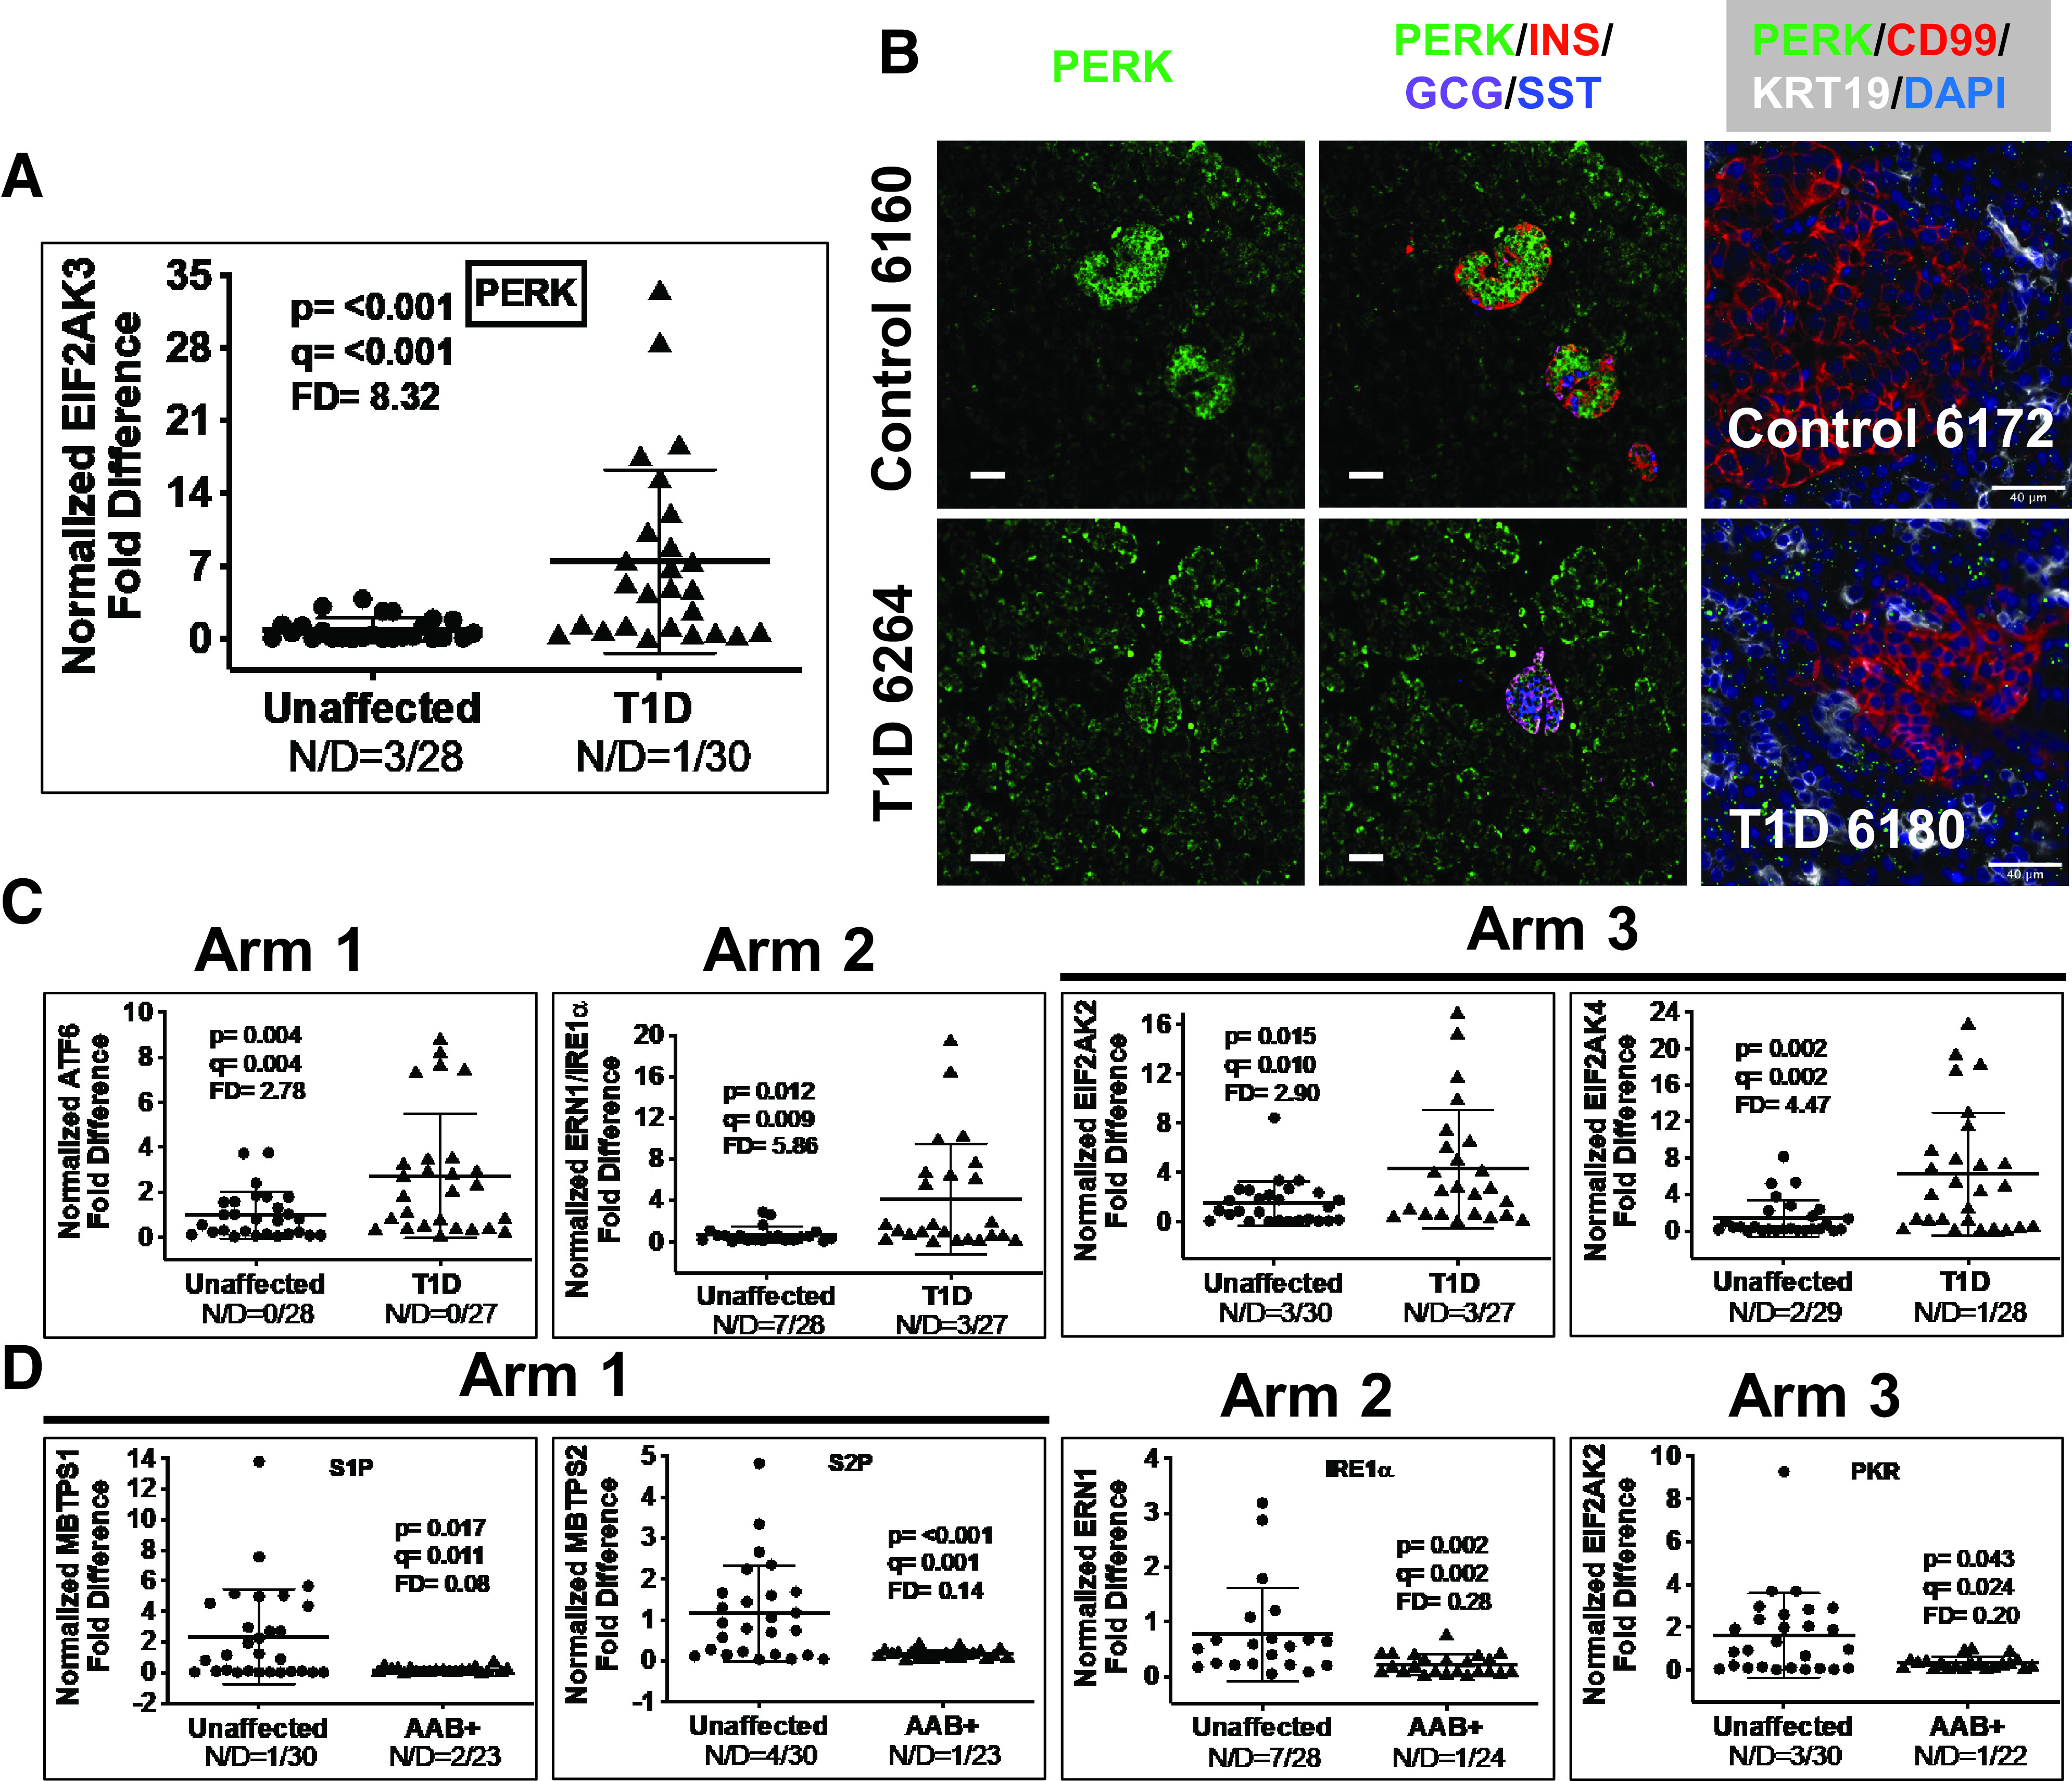
Type 1 diabetes (T1D) has a multifactorial autoimmune etiology, involving environmental prompts and polygenic predisposition. We hypothesized that pancreata from individuals with and at risk for T1D would exhibit dysregulated expression of genes associated with monogenic forms of diabetes caused by nonredundant single-gene mutations. Using a "monogenetic transcriptomic strategy," we measured the expression of these genes in human T1D, autoantibody-positive (autoantibody+), and control pancreas tissues with real-time quantitative PCR in accordance with the Minimum Information for Publication of Quantitative Real-Time PCR Experiments (MIQE) guidelines. Gene and protein expression was visualized in situ with use of immunofluorescence, RNAscope, and confocal microscopy. Two dozen monogenic diabetes genes showed altered expression in human pancreata from individuals with T1D versus unaffected control subjects. Six of these genes also saw dysregulation in pancreata from autoantibody+ individuals at increased risk for T1D. As a subset of these genes are related to cellular stress responses, we measured integrated stress response (ISR) genes and identified 20 with altered expression in T1D pancreata, including three of the four eIF2α-dependent kinases. Equally intriguing, we observed significant repression of the three arms of the ISR in autoantibody+ pancreata. Collectively, these efforts suggest monogenic diabetes and ISR genes are dysregulated early in the T1D disease process and likely contribute to the disorder's pathogenesis.
© 2021 by the American Diabetes Association.
Figures
Similar articles
-
Gene Expression Analysis of the Pre-Diabetic Pancreas to Identify Pathogenic Mechanisms and Biomarkers of Type 1 Diabetes.Front Endocrinol (Lausanne). 2020 Dec 23;11:609271. doi: 10.3389/fendo.2020.609271. eCollection 2020. Front Endocrinol (Lausanne). 2020. PMID: 33424774 Free PMC article.
-
Screening of monogenic autoimmune diabetes among children with type 1 diabetes and multiple autoimmune diseases: is it worth doing?J Pediatr Endocrinol Metab. 2019 Oct 25;32(10):1147-1153. doi: 10.1515/jpem-2019-0261. J Pediatr Endocrinol Metab. 2019. PMID: 31483759 Clinical Trial.
-
Persistence of Pancreatic Insulin mRNA Expression and Proinsulin Protein in Type 1 Diabetes Pancreata.Cell Metab. 2017 Sep 5;26(3):568-575.e3. doi: 10.1016/j.cmet.2017.08.013. Cell Metab. 2017. PMID: 28877460 Free PMC article.
-
Monogenic Diabetes: What It Teaches Us on the Common Forms of Type 1 and Type 2 Diabetes.Endocr Rev. 2016 Jun;37(3):190-222. doi: 10.1210/er.2015-1116. Epub 2016 Apr 1. Endocr Rev. 2016. PMID: 27035557 Free PMC article. Review.
-
Type 1 diabetes and inborn errors of immunity: Complete strangers or 2 sides of the same coin?J Allergy Clin Immunol. 2023 Jun;151(6):1429-1447. doi: 10.1016/j.jaci.2023.03.026. Epub 2023 Apr 24. J Allergy Clin Immunol. 2023. PMID: 37097271 Review.
Cited by
-
Inside the β Cell: Molecular Stress Response Pathways in Diabetes Pathogenesis.Endocrinology. 2022 Nov 14;164(1):bqac184. doi: 10.1210/endocr/bqac184. Endocrinology. 2022. PMID: 36317483 Free PMC article. Review.
-
Inhibition of the Eukaryotic Initiation Factor-2-α Kinase PERK Decreases Risk of Autoimmune Diabetes in Mice.bioRxiv [Preprint]. 2024 Jun 3:2023.10.06.561126. doi: 10.1101/2023.10.06.561126. bioRxiv. 2024. Update in: J Clin Invest. 2024 Jun 18;134(16):e176136. doi: 10.1172/JCI176136. PMID: 38895427 Free PMC article. Updated. Preprint.
-
The pathogenic "symphony" in type 1 diabetes: A disorder of the immune system, β cells, and exocrine pancreas.Cell Metab. 2023 Sep 5;35(9):1500-1518. doi: 10.1016/j.cmet.2023.06.018. Epub 2023 Jul 20. Cell Metab. 2023. PMID: 37478842 Free PMC article. Review.
-
Inhibition of the eukaryotic initiation factor-2α kinase PERK decreases risk of autoimmune diabetes in mice.J Clin Invest. 2024 Jun 18;134(16):e176136. doi: 10.1172/JCI176136. J Clin Invest. 2024. PMID: 38889047 Free PMC article.
-
Diabetes: Concepts of β-Cell Organ Dysfunction and Failure Would Lead to Earlier Diagnoses and Prevention.Diabetes. 2021 Nov;70(11):2444-2456. doi: 10.2337/dbi21-0012. Diabetes. 2021. PMID: 34711669 Free PMC article. Review.
References
-
- American Diabetes Association . 2. Classification and diagnosis of diabetes: Standards of Medical Care in Diabetes—2017. Diabetes Care 2017(Suppl. 1):S11–S24 - PubMed
-
- Antosik K, Borowiec M. Genetic factors of diabetes. Arch Immunol Ther Exp (Warsz) 2016;64(Suppl. 1):157–160 - PubMed
-
- Vaxillaire M, Bonnefond A, Froguel P. The lessons of early-onset monogenic diabetes for the understanding of diabetes pathogenesis. Best Pract Res Clin Endocrinol Metab 2012;26:171–187 - PubMed
Publication types
MeSH terms
Substances
Associated data
Grants and funding
LinkOut - more resources
Full Text Sources
Other Literature Sources
Medical
Research Materials
